
MQL5 Wizard Techniques you should know (Part 75): Using Awesome Oscillator and the Envelopes
Introduction
The combination of the awesome oscillator with envelopes channel is another indicator pairing that we are considering where we merge the synergies of trend following with support/resistance identification. We again consider 10 possible signal patterns that can be got from this pairing and perform evaluation tests on the pair USD JPY on the 30-minute timeframe for the year 2023 with forward tests being on the year 2024. Before jumping into the signal patterns, let's look at the basic definitions of each of these indicators, starting with the awesome oscillator. This was developed by the late Bill Williams as a trend indicator that compares short-term and long-term averages of the midpoint of an asset’s price.
This indicator, AO, is plotted as a histogram, and besides helping to spot trend direction & reversal signals; it can also be useful in identifying bearish/bullish divergences, twin-peaks, and zero line crossovers. The classic formula is as follows:
![]()
Where:
- AOt = Awesome Oscillator value at time t
- Mt=(Ht+Lt)/2 = Midpoint (median) price at time t
- Ht = High price at time t
- Lt = Low price at time t
- SMA5(Mt) = 5-period simple moving average of the midpoint price
- SMA34(Mt) = 34-period simple moving average of the midpoint price
This indicator’s bullish signal is usually when AO crosses above the zero line, which is when short term momentum exceeds the long term. The bearish signal is when AO crosses to below the zero line. This indicator can also be used in a twin-peaks strategy where two peaks above or below the zero line, with the later closer to the zero than the former, can portend changes in direction and thus a new signal. This indicator can thrive a lot in trending markets and can also take on a secondary role of momentum confirmation.
The envelopes channel, our second indicator, overlays two lines, above and below the price moving average via a percentage based deviation. The two created overlays are referred to as bands, an upper band and a lower band. This indicator serves to pinpoint overbought/oversold levels in asset price, as well as volatility boundaries. It is proficient on range-bound markets, unlike the AO above that thrives in trending markets. This usually implies it can work well with mean reversion strategies. Its formula is as follows:
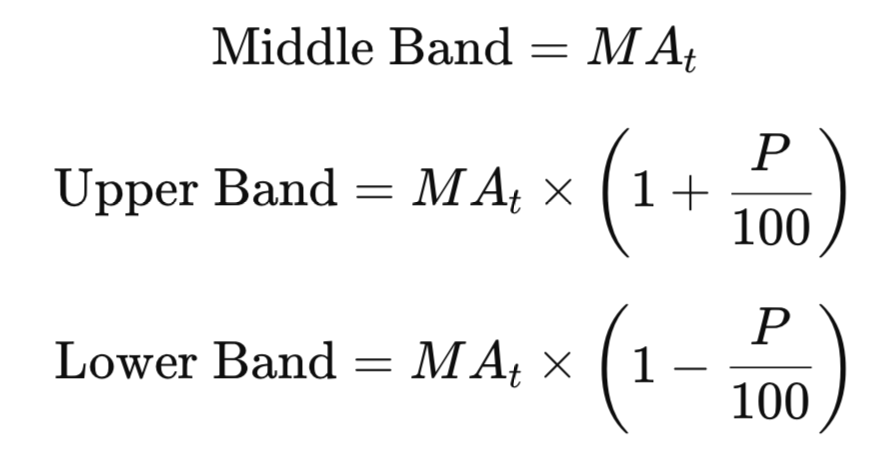
Where:
- MAt = Moving average (typically SMA or EMA) at time t
- P = Percentage deviation (e.g., 2%)
- Upper Band = Channel top boundary
- Lower Band = Channel bottom boundary
This envelope indicator is used when price touches the upper band indicating overbought conditions or when price comes into contact with the lower band, a mark of an oversold situation. The use of confirmation, especially in strongly trending markets, can be paramount as price may not ‘mean-revert’ but ride the band. Envelopes are dynamic, they expand in volatile markets and contract when markets cool down. They are often paired with other indicators such as RSI, or MACD, or volume indicators for signal validation, therefore our pairing with the AO is not really out of the ordinary.
Other possible synergies that can be developed from this combination are reduced lag when compared to trend signals. The envelope signals are always anticipating, unlike pure trend plays that rely on momentum cues. Besides enabling mean-reversion trades as already argued above, they not only thrive in range-bound choppy conditions, but they are good at exploiting momentum divergences in the form of reversal warnings at envelope boundaries.
Envelope Fake out at AO Extreme
Our opening pattern is your classic fake-out reversal signal that gets confirmed with an extreme reading in the AO. The bullish setup, which amounts to a fake bearish breakout, occurs when price briefly drops below the lower envelope and then snaps back inside the channel. When this is happening, the AO reflects an oversold situation. In other words, sellers push price outside support but cannot sustain it, marking exhaustion. Often at this point the AO is subzero, a sign of bearish momentum, and usually forming a local trough. For instance, the histogram may have been red and slowly shrinking in size, or you may see a small bullish divergence in AO with false breakdown. This confluence suggests downside momentum is waning as price has hit an extreme. We implement this pattern in MQL5 as follows:
//+------------------------------------------------------------------+
//| Check for Pattern 0.                                             |
//+------------------------------------------------------------------+
bool CSignalAO_Envelopes::IsPattern_0(ENUM_POSITION_TYPE T)
{  if
   (
      T == POSITION_TYPE_BUY &&
      AO(X()) > 0.0 &&
      AO(X() + 1) < 0.0 &&
      Close(X() + 2) > Envelopes_Lo(X() + 2) &&
      Close(X() + 1) <= Envelopes_Lo(X() + 1) &&
      Close(X()) > Envelopes_Lo(X()) //m_symbol.Bid()
   )
   {  return(true);
   }
   else if
   (
      T == POSITION_TYPE_SELL &&
      AO(X()) < 0.0 &&
      AO(X() + 1) > 0.0 &&
      Close(X() + 2) < Envelopes_Up(X() + 2) &&
      Close(X() + 1) >= Envelopes_Up(X() + 1) &&
      Close(X()) < Envelopes_Up(X())
   )
   {  return(true);
   }
   return(false);
}
An identical bearish fake-out takes place on the upper band, where price spikes above the upper envelope for a false bullish breakout, then retreats back below it. The AO would be above zero, possibly indicating a rounding top or falling green bars. This signals fading buying power. These fake-out patterns at their core are mean reversion signals. When price pierces an envelope band and then reverts inside, it often marks a rejection of the attempted breakout. The envelopes define an expected range of price, such that a quick return inside always means the move outside was a trap for late buyers or sellers. The AO’s role is to confirm that the trend did not actually support the breakout.
An extremely low AO or declining red histogram during a downside fake-out means oversold conditions and that sellers are exhausted. This increases the chances of a bullish reversal. Conversely, an extremely high AO or waning green histogram on an upside fake-out means overbought conditions. This means buyers are losing steam.
Adding a filter of AO increases the reliability of these fake outs or false breakouts. Not only does it increase probability of entries being genuine, given the entries at extremes when price re-enters the bands, but it provides a favourable risk/reward. This is because entries are made at or near extremes, which allows the stops to be placed just beyond the recent swing high/low. This would be just outside the envelope. Testing this pattern on the USD JPY on the 30-minute timeframe over 2 years over which only one, 2023, was used in training gives us the report below:
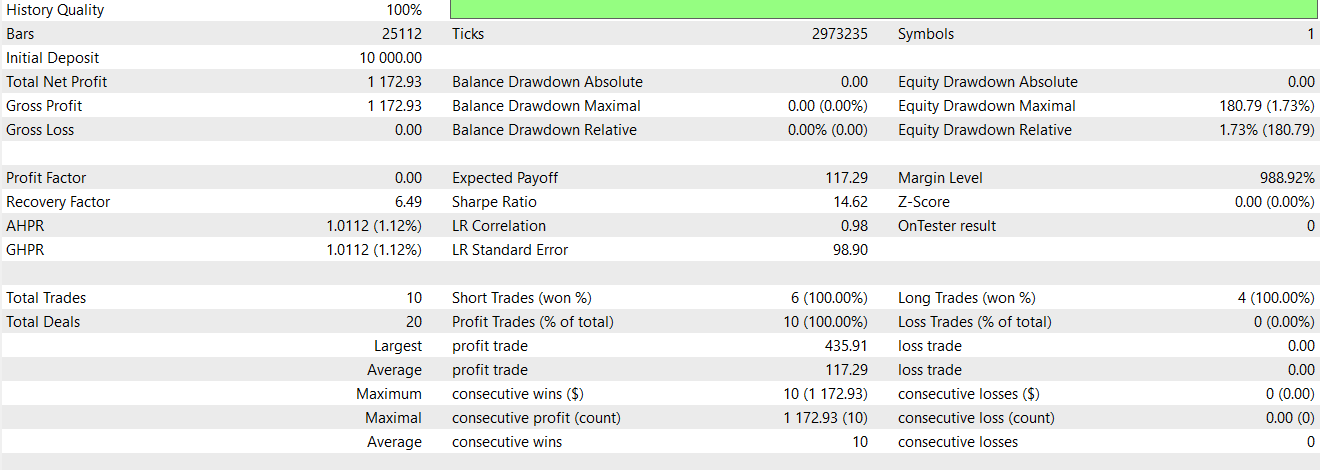
It appears our pattern is able to maintain a positive to flattish forward run, which is a promising sign, barring further testing.
Sustained Breakout with AO Momentum Confirmation
Pattern-1, in many aspects, is the opposite of a fake-out. It spots when a breakout beyond the envelope is real and likely to materialize. This is achieved by requiring strong momentum from the AO. The bullish signal triggers when the price closes above the upper envelope band for at least 2 consecutive candles and AO shows a high bullish momentum. This is marked by registering a large positive value or being in an overbought state relative to its recent range. Practically, if two successive bars close above the upper envelopes, it does point to robust upward thrust that was able to clear the resistance.
If concurrently, the AO is significantly above zero, possibly hitting multi-period highs or staying green at elevated levels, it confirms the buying pressure is strong. This is a strength continuation signal that implies the trend is still breaking out and not just briefly poking around. We implement pattern-1 in MQL5 as follows:
//+------------------------------------------------------------------+
//| Check for Pattern 1.                                             |
//+------------------------------------------------------------------+
bool CSignalAO_Envelopes::IsPattern_1(ENUM_POSITION_TYPE T)
{  vector _last = AO_Last3(X());
   if
   (
      T == POSITION_TYPE_BUY &&
      _last[0] < 0.0 &&
      _last[2] < 0.0 &&
      _last[0] > _last[2] &&
      Close(X() + 2) > Envelopes_Mid(X() + 2) &&
      Close(X() + 1) <= Envelopes_Mid(X() + 1) &&
      Close(X()) > Envelopes_Mid(X())
   )
   {  return(true);
   }
   else if
   (
      T == POSITION_TYPE_SELL &&
      _last[0] > 0.0 &&
      _last[2] > 0.0 &&
      _last[0] < _last[2] &&
      Close(X() + 2) < Envelopes_Mid(X() + 2) &&
      Close(X() + 1) >= Envelopes_Mid(X() + 1) &&
      Close(X()) < Envelopes_Mid(X())
   )
   {  return(true);
   }
   return(false);
}
The bearish counterpart is a breakout to the downside. When we have two or more consecutive closes below the lower envelope with the AO deeply negative as a result of selling momentum. This indicates a genuine breakdown with follow-through potential. This is a pattern tailored for trending markets. Unlike above in pattern-0 where we assumed the envelope would contain price, in this case price establishes itself outside the envelope for a period, signalling that volatility is spiking in the direction of the trend. The envelope can be thought of as a dynamic channel - when price can ride outside it for multiple bars. This is often a clue that the old range has given way to a new trend leg.
The AO, then, acts as a confirmation filter. For instance, if price closes above the upper band twice but AO is only tepidly above zero, the breakout could lack momentum and might be false. However, if AO remains , say, well above its median and showing consecutive tall green bars (a sign of accelerating momentum), this reinforces the case that the breakout has substance. Testing pattern-1 in similar conditions to pattern 0 does yield an impressive report with a decent forward walk as presented below:

Pattern-1 is one of the better performers in the forward walk test. Its chart pattern for a short is presented below;

AO Divergence at Envelope Support/Resistance
Our third pattern, pattern-2, leverages one of the most potent reversal signals in technical analysis. The bullish/bearish divergence between price and the oscillator, when price is at the envelope boundaries. A bullish divergence setup emerges when price makes a lower low that touches or slightly pierces the lower envelope, indicating a support test, and concurrently the AO would make a higher low, with its histogram trough more shallow on the second downswing than the first. Put differently, the market would be pushing to a new price low, but the AO would fail to reach a new momentum low. This is a classic sign that downward force is waning.
In this scenario, the envelope’s lower band serves as a strong support zone that coincides with the divergence, adding credence to the reversal case. We implement this pattern as follows in MQL5:
//+------------------------------------------------------------------+
//| Check for Pattern 2.                                             |
//+------------------------------------------------------------------+
bool CSignalAO_Envelopes::IsPattern_2(ENUM_POSITION_TYPE T)
{  if
   (
      T == POSITION_TYPE_BUY &&
      AO(X() + 2) > AO(X() + 1) &&
      AO(X() + 1) < AO(X()) &&
      Close(X() + 2) > Envelopes_Lo(X() + 2) &&
      Close(X() + 1) <= Envelopes_Lo(X() + 1) &&
      Close(X()) > Envelopes_Lo(X())
   )
   {  return(true);
   }
   else if
   (
      T == POSITION_TYPE_SELL &&
      AO(X() + 2) < AO(X() + 1) &&
      AO(X() + 1) > AO(X()) &&
      Close(X() + 2) < Envelopes_Up(X() + 2) &&
      Close(X() + 1) >= Envelopes_Up(X() + 1) &&
      Close(X()) < Envelopes_Up(X())
   )
   {  return(true);
   }
   return(false);
}
The bearish divergence variant is the mirror image. Price makes a higher high at or just above the upper envelope (testing key resistance), but the AO prints a lower high on its histogram peaks. This informs us that even though price hit a new high, the buying momentum was weaker the second time. This signals a likely top and reversal. Divergence patterns are established at forecasting trend changes. By requiring the price extremes to occur near the envelope bands, we end up focusing on divergences at logical support/resistance levels. This typically makes them more potent. To illustrate, a bullish divergence occurring right at the lower envelope could mark the final push of a down-move before a significant rebound.
The psychology here is intuitive. The envelope tells us the price is in an oversold location, and the AO tells us that relative momentum is no longer as bearish as implied by price action. Said another way, bears pushed price to a new low, but AO’s higher low shows bears are losing power. Often, by the time divergence completes, AO may also start to tick upwards, even as price is flat or making that new low, providing further evidence of a shift. The envelope contains the price move, and the failure to decisively break beyond it signals that support held. From testing, this pattern too appears to walk forward profitably, albeit in a choppy fashion. Its report is given below:

AO Zero-Line Cross and Pullback to Envelope Midline
Pattern-3 is a trend resumption aka ‘buy the dip/sell the rally’ kind of setup. It brings together momentum shift through the AO’s zero line with price pullback to a key moving average, the envelope’s midline. In the bullish version, the awesome oscillator crosses from below zero to above zero, signalling a momentum swing from negative to positive. Buyers gaining an upper hand. At around the same time, price, which had been in a pullback, does find support at or near the envelope midline - with the midline being the core moving average of the channel.
Essentially, price is returning to its mean, the midline, within an uptrend and as it does so, AO crosses above the zero signalling the pullback is most likely ending and upward momentum is on its way back. This thus gives a ‘buy the dip’ signal at the dynamic support midline. We implement this pattern in MQL5 like so:
//+------------------------------------------------------------------+
//| Check for Pattern 3.                                             |
//+------------------------------------------------------------------+
bool CSignalAO_Envelopes::IsPattern_3(ENUM_POSITION_TYPE T)
{  if
   (
      T == POSITION_TYPE_BUY &&
      AO(X()) - AO(X() + 1) > AO(X() + 1) - AO(X() + 2) &&
      AO(X() + 1) > AO(X() + 2) &&
      AO(X() + 2) > 0.0 &&
      Close(X() + 1) < Envelopes_Up(X() + 1) &&
      Close(X()) > Envelopes_Up(X())
   )
   {  return(true);
   }
   else if
   (
      T == POSITION_TYPE_SELL &&
      AO(X() + 1) - AO(X()) > AO(X() + 2) - AO(X() + 1) &&
      AO(X() + 2) > AO(X() + 1) &&
      AO(X() + 2) < 0.0 &&
      Close(X() + 1) > Envelopes_Lo(X() + 1) &&
      Close(X()) < Envelopes_Lo(X())
   )
   {  return(true);
   }
   return(false);
}
With the bearish setup, AO crosses below zero, since momentum and trends are turning bearish. This happens just as price rises inwards to the envelope midline from below. The midline serves as a dynamic resistance. This suggests a short entry on a rally taking place in a downtrend. A sell on a bounce to the mean. We thus capture classic trend-following entries with this pattern. Entry is in the direction of the larger trend, following a minor counter-trend move.
In an established trend, price normally fluctuates around this moving average - soaring above it in an uptrend and then descending back toward it, etc. When price pulls back to an upward inclining midline and holds, it's often a good entry zone for trend progression. AO’s zero line, in the meantime, acts as a clear separator between bullish and bearish momentum.
So, a given situation could feature the market in an upward motion, with price generally above the midline and the AO above zero. If we then have a small correction and the AO dips below zero indicating a slight bearish momentum and also price dips from above the midline down to touch it. If and when the AO crosses back above zero, that would be an indication that momentum is re-aligning to the prevalent trend, and would serve as a cue to re-entry. Our testing with this pattern like the three before it also has a successful forward walk. Its report is given below:

Volatility Squeeze and AO Breakout Bias
Pattern-4 capitalizes on a volatility contraction within the envelopes' indicator channel. Often called a squeeze - it precedes a breakout, while the AO gives indication on the likely direction the breakout will make. With this pattern, the envelope bands narrow substantially, which portends a period of low volatility or consolidation. In this context, we observe the upper and lower bands almost pinching closer together, or just flattening out. This also points to a quiet market phase where the ranges of price are tightening. In this squeeze, the AO is monitored for a gradual shift or bias. This is important because the AO might be lingering around the zero line while slowly rising from slightly below zero toward bullish terrain, for a long bias or vice versa.
In a bullish setup, you might see AO hopping around in a small range, given that price is range bound, but even in these situations AO’s histogram can often have an inclination to edge higher. This can be seen with the AO spending more time in short green bars than red. This subtle momentum buildup suggests that if volatility rises, on the squeeze end, the breakout could be to the upside. We implement pattern-4 as follows in MQL5:
//+------------------------------------------------------------------+
//| Check for Pattern 4.                                             |
//+------------------------------------------------------------------+
bool CSignalAO_Envelopes::IsPattern_4(ENUM_POSITION_TYPE T)
{  if
   (
      T == POSITION_TYPE_BUY &&
      AO(X() + 2) > AO(X() + 1) &&
      AO(X() + 1) < AO(X()) &&
      AO(X() + 1) > 0.0 &&
      Close(X() + 2) <= Envelopes_Mid(X() + 2) &&
      Close(X() + 2) >= Envelopes_Lo(X() + 2) &&
      Close(X() + 1) <= Envelopes_Mid(X() + 1) &&
      Close(X() + 1) >= Envelopes_Lo(X() + 1) &&
      Close(X()) <= Envelopes_Mid(X()) &&
      Close(X()) >= Envelopes_Lo(X())
   )
   {  return(true);
   }
   else if
   (
      T == POSITION_TYPE_SELL &&
      AO(X() + 2) > AO(X() + 1) &&
      AO(X() + 1) < AO(X()) &&
      AO(X() + 1) > 0.0 &&
      Close(X() + 2) >= Envelopes_Mid(X() + 2) &&
      Close(X() + 2) <= Envelopes_Up(X() + 2) &&
      Close(X() + 1) >= Envelopes_Mid(X() + 1) &&
      Close(X() + 1) <= Envelopes_Up(X() + 1) &&
      Close(X()) >= Envelopes_Mid(X()) &&
      Close(X()) <= Envelopes_Up(X())
   )
   {  return(true);
   }
   return(false);
}
Equally, a bearish biased squeeze would also have the AO gradually receding downward between small fluctuations. This may feature a slight series of lower highs on the histogram, while close to zero, suggesting the path of least resistance is down once a breakout happens. This pattern is akin to the renown Bollinger-Bands squeeze, difference being we’re using envelopes with the AO.
The narrowing usually implies the moving average isn’t shifting much and recent price highs/lows are not diverging meaningfully from it - a classic consolidation. The contraction of the envelope bands provides a visual cue, something which is easy to spot, and in fact quantify. For instance, measuring the percentage distance between the bands relative to the average can provide us with a metric.
Therefore, we have clarity when the pattern is ‘on’. However, low volatility periods are often times periods of low attention for several traders. Being alert during these times for AO bias can thus potentially give you a ‘jump on the crowd’ that usually reacts once a breakout is obvious. Testing for this pattern though presents us with our first signal pattern whose forward walk is questionable. It is given below, nonetheless:

AO Extreme Momentum with Expanding Envelope
Pattern-5 hones in on underlying powerful trends where momentum is at an extreme. It's marked by the AO staying at a very-high or very-low values for an extended period. This can serve as an indication of persistent buying or selling pressure. While this is happening with the AO, the envelopes also begin to become wider and also slope more steeply. This affirms a strong directional move.
In the bullish signal for pattern-5, the AO remains above the zero bound at an elevated level. This usually happens above recent peaks, meaning it is confined to positive territory. So this would look like an all-green, towering AO. Concurrently, the upper envelope band would be seen angling sharply upward. On the chart, it may seem that each new price bar is pushing the upper band higher, meaning the envelope is adjusting to higher prices.
In some implementations of this pattern, the ‘envelope expansion’ could mean that once the envelope tracking uses percentage measurements, the distance between the bands and price would increase even though the percentage is relatively constant. The visual to watch out for is the channel pointing upward, resolutely, and not being flat. In this layout where AO is above a given threshold, the envelope is pointing upward, we would be signalling a continuation buy. The trend would have strong traction and would likely continue to drive price higher. We implement this pattern in MQL5 as follows:
//+------------------------------------------------------------------+
//| Check for Pattern 5.                                             |
//+------------------------------------------------------------------+
bool CSignalAO_Envelopes::IsPattern_5(ENUM_POSITION_TYPE T)
{  vector _last = AO_Last3(X());
   if
   (
      T == POSITION_TYPE_BUY &&
      _last[0] < 0.0 &&
      _last[2] < 0.0 &&
      _last[0] > _last[2] &&
      Low(X()) < Low(X() + 1) &&
      Envelopes_Up(X() + 1) - Envelopes_Lo(X() + 1) > Envelopes_Up(X()) - Envelopes_Lo(X())
   )
   {  return(true);
   }
   else if
   (
      T == POSITION_TYPE_SELL &&
      _last[0] > 0.0 &&
      _last[2] > 0.0 &&
      _last[0] < _last[2] &&
      High(X()) > High(X() + 1) &&
      Envelopes_Up(X() + 1) - Envelopes_Lo(X() + 1) > Envelopes_Up(X()) - Envelopes_Lo(X())
   )
   {  return(true);
   }
   return(false);
}
The bearish counterpart is acknowledged when AO remains deeply negative, where several red histogram bars are evident, and they are sufficiently below the zero bound. This is coupled with the envelope tilting significantly downward, meaning there is sustained selling momentum for a continuation short. This pattern essentially flags the times when the market is in an extreme trend - think runaway rally or sell-off. With the envelope’s upper band continuously making new highs, with the lower band in tow, can be taken as ‘the price riding the band’.
Several strategies deem a market trending once price hugs the upper Bollinger or in this case Envelopes - here it is a similar concept, however we require AO to affirm the extraordinary momentum. In practice, pattern-5 can appear after some market consolidation, possibly following pattern-4 or pattern-1. Our test results for this pattern are presented below, and this one was also able to forward walk profitably:

Double Bottom/Top with AO Twin Peaks
Our seventh pattern, pattern-6 merges a double bottom or double top at the envelope boundary, with a novel AO pattern, commonly referred to as twin-peaks. For our bullish pattern, imagine price in a decline that is able to find support at the lower envelope, bounces off, then retests the lower band forming a W-profile double bottom. The two lows would be at about the same level in the envelope’s lower bound area, a support zone, indicating it held two times. In this process, the AO would concurrently form a bullish twin peak shape below its zero bound.
In the AO shape, the second trough would be higher than the first, meaning it is closer to zero. More importantly, though, the AO would still be sub-zero and would have made no crossover between the two troughs. These Twin Peaks are taken to represent a bullish momentum base forming given a decrease in the sell-off intensity. We implement this bullish reversal opportunity in MQL5 as follows:
//+------------------------------------------------------------------+
//| Check for Pattern 6.                                             |
//+------------------------------------------------------------------+
bool CSignalAO_Envelopes::IsPattern_6(ENUM_POSITION_TYPE T)
{  if
   (
      T == POSITION_TYPE_BUY &&
      AO(X() + 2) > 0.0 &&
      AO(X() + 1) < 0.0 &&
      AO(X()) > 0.0 &&
      Close(X() + 2) > Envelopes_Lo(X() + 2) &&
      Close(X() + 1) <= Envelopes_Lo(X() + 1) &&
      Close(X()) > Envelopes_Lo(X())
   )
   {  return(true);
   }
   else if
   (
      T == POSITION_TYPE_SELL &&
      AO(X() + 2) < 0.0 &&
      AO(X() + 1) > 0.0 &&
      AO(X()) < 0.0 &&
      Close(X() + 2) < Envelopes_Up(X() + 2) &&
      Close(X() + 1) >= Envelopes_Up(X() + 1) &&
      Close(X()) < Envelopes_Up(X())
   )
   {  return(true);
   }
   return(false);
}
The bearish equivalent of this pattern is a double top, M-shape, at the upper envelope. Price hits the upper band, pulls back then retests it, forming a high that is almost matching. At the same time, AO would show a bearish twin peak above zero with no crossover happening between the peaks and the second peak being lower than the first. This marks waning buying pressure and sets the stage for a drop in the price.
Pattern-6 at its core brings together classic chart patterns with oscillator confirmation. Having a double bottom at a known support, such as the envelope lower band, does suggest that the level is ‘defended’. On its own, the AO-Twin-Peaks is an established Bill Williams signal for its reversal sentiment. The envelope does provide context that these lows/highs occurred at an extreme price band, which adds validity the support/resistance was not arbitrary and is a deflection point when range-bound.
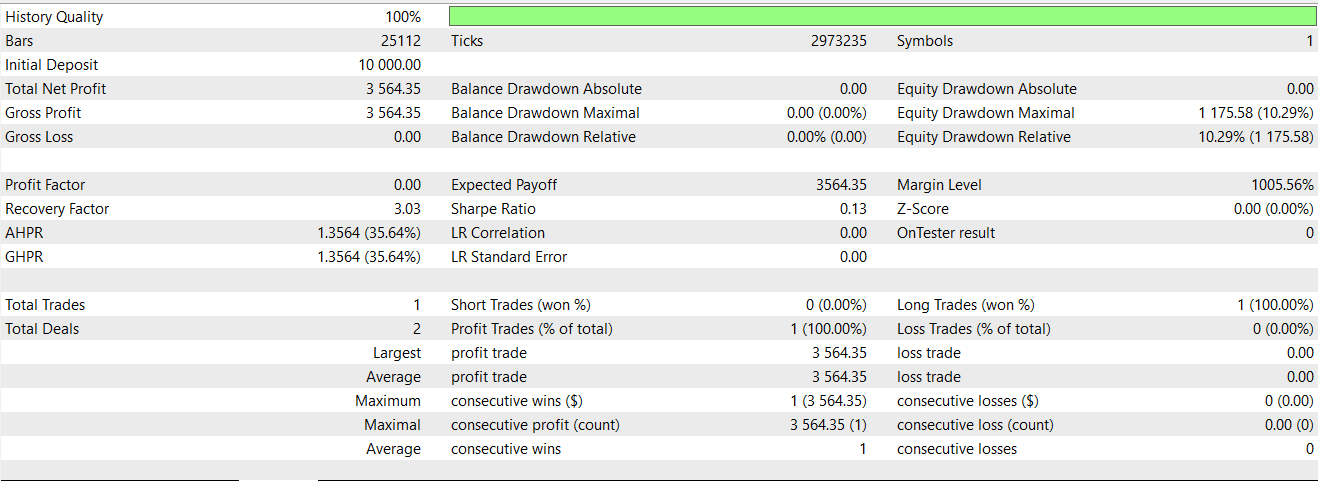
Usually, one tends to get in on a break of the double bottom’s neckline, the peak between the two lows or after the second bottom after conditions such as the AO turning green occur. The stop-loss naturally goes just below the double bottom’s lows for longs, or just above the double top’s highs for shorts. The localized risk is therefore small when compared to the potential reward, which can be with a move to the opposite end of the envelopes. Testing this pattern did not yield a sufficient number of trades in similar conditions to the other patterns of using symbol USD JPY, on 30-minute timeframe, over the same 2-year period. The entry pattern is too restrictive, which could mean it is best suited for even smaller timeframes? The report is below nonetheless:
Sharp AO Rebound from Oversold + Envelope Breakout
Pattern-7 spots explosive reversal moves that come after a period of extreme momentum in a given direction. It happens when the AO exhibits a sudden sharp swing from a deeply oversold condition to a bullish reading, coupled with price surging above the envelope’s upper band. This all happens when the signal is a bullish reversal. In practice, this bullish setup would feature the AO being very low as a mark of extreme bearish momentum after a major sell-off. Then following this, in a few bars the AO crosses the zero threshold to become positive.
What this points to is a whiplash in momentum - sellers went from total control to sudden collapse, losing out to buyers. In the same instance, price, which had been significantly depressed, would jump to above the envelope closing outside the channel, signalling a decisive upside breakout. This setup often happens thanks to a catalyst that is typically a news event. We implement this pattern in MQL5 as follows:
//+------------------------------------------------------------------+
//| Check for Pattern 7.                                             \
//+------------------------------------------------------------------+
bool CSignalAO_Envelopes::IsPattern_7(ENUM_POSITION_TYPE T)
{  if
   (
      T == POSITION_TYPE_BUY &&
      AO(X() + 2) > 0.0 &&
      AO(X() + 1) > AO(X() + 2) &&
      AO(X()) > AO(X() + 1) &&
      Close(X() + 2) <= Envelopes_Lo(X() + 2) &&
      Close(X() + 1) > Envelopes_Lo(X() + 1) &&
      Close(X()) > Close(X() + 1)
   )
   {  return(true);
   }
   else if
   (
      T == POSITION_TYPE_SELL &&
      AO(X() + 2) < 0.0 &&
      AO(X() + 1) < AO(X() + 2) &&
      AO(X()) < AO(X() + 1) &&
      Close(X() + 2) >= Envelopes_Up(X() + 2) &&
      Close(X() + 1) < Envelopes_Up(X() + 1) &&
      Close(X()) < Close(X() + 1)
   )
   {  return(true);
   }
   return(false);
}
The bearish version of this pattern is the inverse, with AO flipping strongly from overbought to subzero in a short period while price drops beneath the lower envelope band. This initiates a downside breakout reversal. This formation is at its core capturing a V-shaped reversal. It occurs at the time when markets that were trending or moving strongly in one direction, capitulate and snap the other way aggressively. The AO quantifies the momentum flip.
This pattern-7 basically assumes the previous extreme momentum was not enduring, is now reversed as a result of being triggered by something tangible. Without this trigger, one would simply witness a volatility spike in a still intact rally, such as a volatile retracement. Therefore, context is very important. One should thus look out for over extended rallies or news-supported event. Our pattern-7 appears to perform as well as pattern-1 in testing, with the forward walk being meaningful. We give the report of this below:
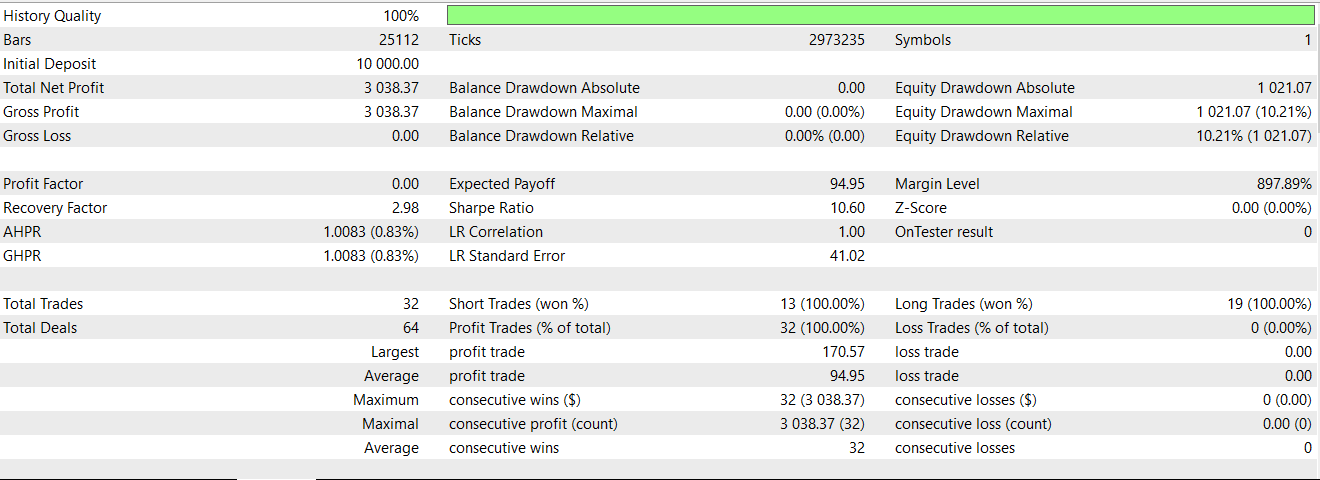
A chart representation of a bullish signal for pattern-7 is given below. We indicate these chart patterns for the best forward walkers however since the Expert Advisor source code is attached, the reader can better explore these on a post-test chart.

Post-Breakout Pullback to Envelope with AO Confirmation
Our penultimate signal-pattern is a ‘throwback’ or a ‘pullback-after-breakout’ strategy. It gets into play right after a strong breakout happens beyond the envelopes, once price momentarily reverts to test the broken envelope band. All the while, the AO would remain at an extreme level, marking that the dominant momentum is still intact. In the bullish setup, it's a situation where price broke out above the upper envelope in a surge, possibly due to a trend or a pattern-1 or pattern-7 situation. Once we have the initial burst, price pulls back slightly and crucially the low price of this retracement remains above the upper envelope line. In other words, price does not re-enter the envelope, but only kisses the upper band, staying marginally above it.
This effectively serves as a throwback to newfound support, that being the upper envelope. In this throwback, the AO stays bullish, above zero, and relatively high since momentum has not dissipated, but only paused. AO might dip a bit due to the minor retracement, however it should remain firmly positive. With these conditions, the pattern signals an entry that is low risk for an uptrend, the breakout is validated given the hold above the envelope, and the AO indicates bullish momentum. This is our MQL5 source for this pattern:
//+------------------------------------------------------------------+
//| Check for Pattern 8.                                             |
//+------------------------------------------------------------------+
bool CSignalAO_Envelopes::IsPattern_8(ENUM_POSITION_TYPE T)
{  if
   (
      T == POSITION_TYPE_BUY &&
      AO(X() + 2) > 0.0 &&
      AO(X() + 1) > AO(X() + 2) &&
      AO(X()) > AO(X() + 1) &&
      Close(X() + 2) > Envelopes_Up(X() + 2) &&
      Close(X() + 1) > Close(X() + 2) &&
      Close(X()) > Close(X() + 1)
   )
   {  return(true);
   }
   else if
   (
      T == POSITION_TYPE_SELL &&
      AO(X() + 2) < 0.0 &&
      AO(X() + 1) < AO(X() + 2) &&
      AO(X()) < AO(X() + 1) &&
      Close(X() + 2) < Envelopes_Lo(X() + 2) &&
      Close(X() + 1) < Close(X() + 2) &&
      Close(X()) < Close(X() + 1)
   )
   {  return(true);
   }
   return(false);
}
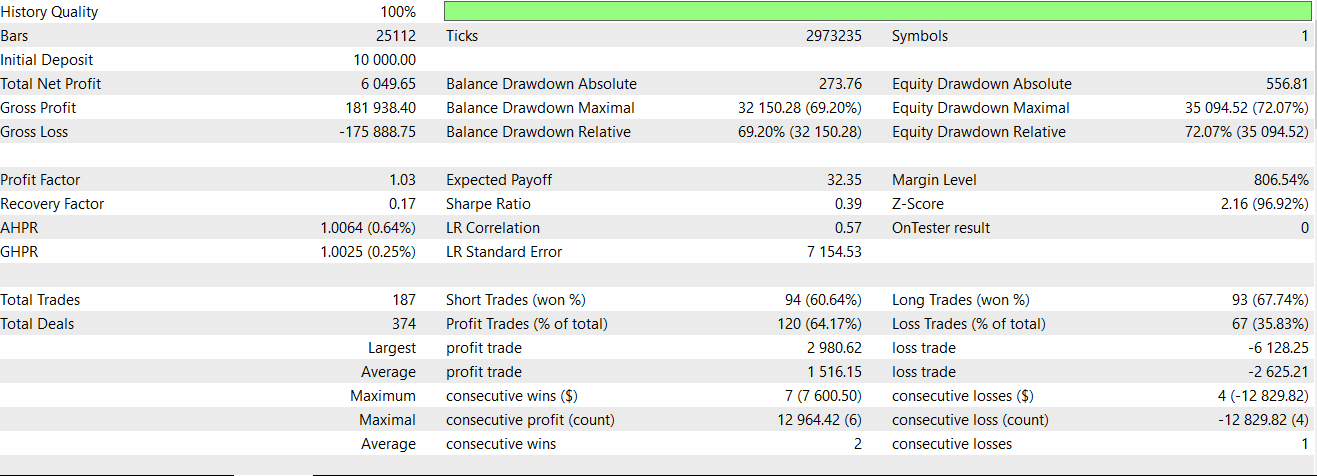
The bearish version is for a price break below the lower envelope, followed by a retracement upward, with the bounce high remaining below the lower band. The lower band thus acts as a resistance. With the AO staying negative, the setup presents an opportunity to short the ‘relief bounce’ with some confidence that the downtrend will continue. Pattern-8, on testing, becomes the first pattern to fail a profitable forward walk. Its report is given below:
Envelope Trend Tilt with AO Baseline Shift
The final pattern focuses on spotting the beginning of a new sustained trend by bringing together a clear change in the envelope’s slope with a confirmatory shift in AO’s baseline momentum. In a bullish scenario, the envelope channel that was flat prior would begin to tilt sharply up, signalling that price action has morphed to bullish. This is usually observed from the first highs of the upper band or the midline. To illustrate, each new bar sees the upper envelope higher than the prior for several bars in a row. While the envelope indicates a discovered bullish tilt, the AO also rises above its zero bound and meaningfully staying above it.
In practice, this implies the AO may have been oscillating about the zero or below in the previous range, but has now turned decisively positive as a result of sustained buying pressure. Many times one might see AO above the zero and remain green for some bars. Together, these conditions do make a powerful trend buy signal, since the market has in most probability exited its choppy/range phase and is now set on an orderly uptrend. We code this pattern in MQL5 as follows:
//+------------------------------------------------------------------+
//| Check for Pattern 9.                                             |
//+------------------------------------------------------------------+
bool CSignalAO_Envelopes::IsPattern_9(ENUM_POSITION_TYPE T)
{  if
   (
      T == POSITION_TYPE_BUY &&
      AO(X() + 2) > AO(X() + 1) &&
      AO(X() + 1) > AO(X()) &&
      AO(X()) > 0.0 &&
      Close(X() + 2) > Envelopes_Mid(X() + 2) &&
      Close(X() + 1) <= Envelopes_Mid(X() + 1) &&
      Close(X()) > Envelopes_Mid(X())
   )
   {  return(true);
   }
   else if
   (
      T == POSITION_TYPE_SELL &&
      AO(X() + 2) < AO(X() + 1) &&
      AO(X() + 1) < AO(X()) &&
      AO(X()) < 0.0 &&
      Close(X() + 2) < Envelopes_Mid(X() + 2) &&
      Close(X() + 1) >= Envelopes_Mid(X() + 1) &&
      Close(X()) < Envelopes_Mid(X())
   )
   {  return(true);
   }
   return(false);
}
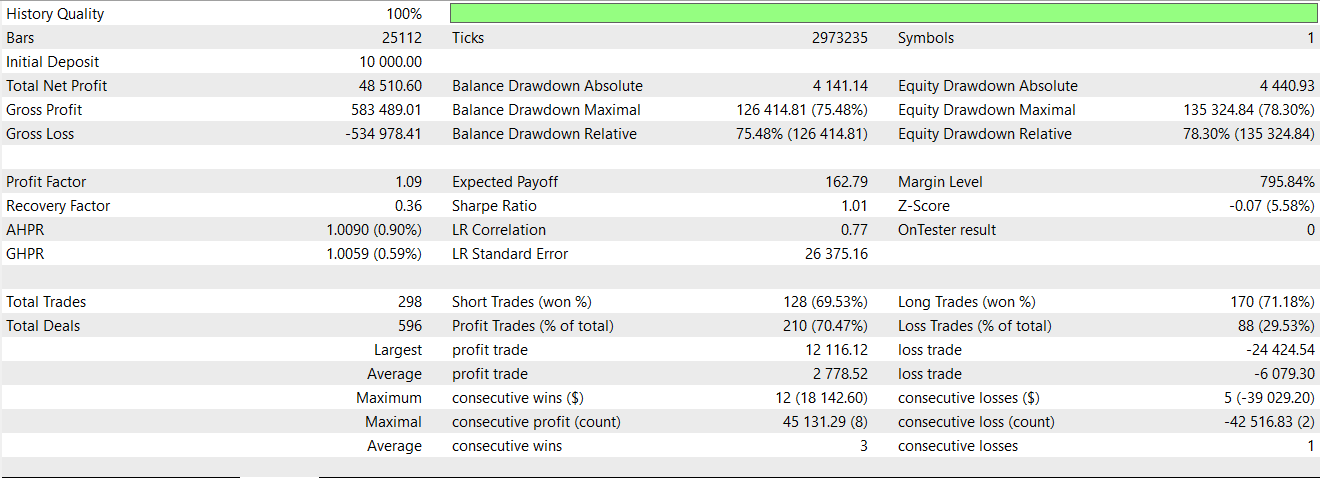
The bearish mirror of this is the envelope turning downward, with the lower band stepping lower, bar by bar. The AO, simultaneously falls below zero, and staying subzero as a sign a new downtrend is taking shape. This pattern serves as a confirmation. It does not try to catch the absolute tops or bottoms, like with pattern-7 or pattern-6. All it does is try spotting the subtle shifts from a sideways or weak market to a trending one. Our testing of this pattern over the 2-year period on USD JPY 30-minute time frame also did not profitably walk forward as we had in pattern-8 above. The report is given below:
Conclusion
For this article, we have looked at another indicator pairing of the Awesome Oscillator and the Envelope Channels. Our examination is based on a one-year window for training/optimization and one-year of forward testing. As has always been stressed in these articles, this test window is limited and extra diligence on the part of the reader in exploring different types of markets is very important before these ideas can be used in a live setting. We will follow up this piece with another article that examines if the two patterns 8 and 9, that could not forward walk, can be positively influenced by supervised learning.
| name | description |
|---|---|
| WZ-75.mq5 | Wizard Assembled Expert Advisor whose header shows files included |
| SignalWZ-75.mqh | Custom Signal Class File for use in Wizard Assembly |
These attached files are meant to be used in the MQL5 Wizard to assemble an Expert Advisor. There are guides here for new readers.
Warning: All rights to these materials are reserved by MetaQuotes Ltd. Copying or reprinting of these materials in whole or in part is prohibited.
This article was written by a user of the site and reflects their personal views. MetaQuotes Ltd is not responsible for the accuracy of the information presented, nor for any consequences resulting from the use of the solutions, strategies or recommendations described.
 Self Optimizing Expert Advisors in MQL5 (Part 9): Double Moving Average Crossover
 Implementing Practical Modules from Other Languages in MQL5 (Part 02): Building the REQUESTS Library, Inspired by Python
 From Novice to Expert: Animated News Headline Using MQL5 (VI) — Pending Order Strategy for News Trading
 MQL5 Trading Tools (Part 4): Improving the Multi-Timeframe Scanner Dashboard with Dynamic Positioning and Toggle Features
- Free trading apps
- Over 8,000 signals for copying
- Economic news for exploring financial markets
You agree to website policy and terms of use