YouTube'dan Mağaza ile ilgili eğitici videoları izleyin
Bir alım-satım robotu veya gösterge nasıl satın alınır?
Uzman Danışmanınızı
sanal sunucuda çalıştırın
sanal sunucuda çalıştırın
Satın almadan önce göstergeyi/alım-satım robotunu test edin
Mağazada kazanç sağlamak ister misiniz?
Satış için bir ürün nasıl sunulur?
MetaTrader 5 için teknik göstergeler - 7

MACD divergence indicator finds divergences between price chart and MACD indicator and informs you with alerts (popup, mobile notification or email) . Its main use is to find trend reversals in the chart. Always use the divergence indicators with other technical assets like support resistance zones, candlestick patterns and price action to have a higher possibility to find trend reversals. Three confirmation type for MACD divergences: MACD line cross zero level Price returns to previous H/L Crea
FREE

If you like this free tool, check out my EA which is currently on a Launch Sale for only $39 ! https://www.mql5.com/zh/market/product/159451?source=Site Short Description: A specialized technical indicator designed for Gold (XAUUSD) trading. It automatically identifies market swings, plots key 0.382 and 0.618 Fibonacci retracement levels, and sen mobile push nothiations not sat 面紙 面 面 面面 筆/內托are detected. 【Key Features】 Dual Monitoring Mode: Simultaneously tracks the 0.382 (Shallow Retracement)
FREE

Was: $69 Now: $49 Blahtech VWAP - Volume Weighted Average Price (VWAP) is the ratio of price to total volume. It provides an average price over a specified time interval. Links [ Install | Update | Documentation ] Feature Highlights
Configurable VWAP Line Sessions, intervals, anchored or continuous Previous day settlement line Standard Deviation bands Alerts at bar close or real time Automatic Broker or Tick volumes Significantly reduced CPU usage
Input Parameters
Expert Advisor Mo

This indicator automatically identifies market structure and plots Fibonacci retracement levels in real time.
It detects key swing highs and lows to mark structural points such as higher highs, higher lows, lower highs, and lower lows, helping traders quickly understand trend direction and structural shifts.
Based on the detected structure, the indicator dynamically draws Fibonacci levels, allowing traders to easily spot potential retracement, pullback, and entry zones without manual drawing.
Orderflow Scalp Pro v2.4 delivers institutional-grade trading intelligence through advanced volume analysis, dynamic VWAP calculations, real-time aggressive score monitoring, and precision arrow signals. This complete trading system transforms complex market data into clear, actionable signals for consistent profitability on 3-4 minute timeframes.
Full Documentation: [Download PDF] Four Powerful Components in One System Volume Profile HeatMap with POC/VAH/VAL Transform your charts into inst

Improved version of the free HMA Trend indicator (for MetaTrader 4) with statistical analysis. HMA Trend is a trend indicator based on the Hull Moving Average (HMA) with two periods. HMA with a slow period identifies the trend, while HMA with a fast period determines the short-term movements and signals in the trend direction.
The main differences from the free version: Ability to predict the probability of a trend reversal using analysis of history data. Plotting statistical charts for analyzi
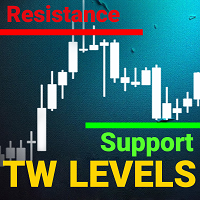
support resistance levels indicator mt5:
Bu araç, insan gözünün aynı doğruluğuyla bir grafikte destek ve direnç çizgilerini, ayrıca Fibonacci seviyelerini tanımlayan ve çizen çok zamanlı bir göstergedir. Forex için TW destek ve direnç seviyeleri, fiyat stabilizasyonu ve sıçramalarının önceki seviyelerini belirlemek için grafiği tarayan karmaşık bir algoritmaya sahiptir ve dokunuş sayısını kaydeder.
Destek ve direnç seviyelerini ve Fibonacci geri çekilmelerini manuel olarak çizmeye mi yoruldun
AI ChartPattern Pro
AI ChartPattern Pro, traderların gelişmiş grafik formasyonlarını önyargı veya manipülasyon olmadan objektif bir şekilde tanımlamalarına yardımcı olmak için tasarlanmış yüksek hassasiyetli bir göstergedir. Sürüm 1.0, iki güçlü formasyon içeriyor: Wolfe Dalgası ve Omuz Baş Omuz (OBO) yapısı. Bu gösterge sadece formasyonları göstermekle kalmaz, aynı zamanda işlem sinyalleri de sağlar: Giriş fiyatı Zararı Durdur (SL) Kâr Al 1 (TP1) Kâr Al 2 (TP2) Tüm bunlar minimum kullanıcı aya
FREE

This indicator provides the ability to recognize the SMC pattern, essentially a condensed version of the Wyckoff model. Once the pattern is confirmed by RTO, it represents a significant investment opportunity. There are numerous indicators related to SMC beyond the market, but this is the first indicator to leverage patterns to identify specific actions of BigBoy to navigate the market. The SMC (Smart Money Concept) pattern is a market analysis method used to understand the behavior of "smart

EPo-CreW Forex Super ORB-H4 Göstergesine Hoş Geldiniz!
Bu kılavuz, piyasanın ilk 4 saatlik açılış aralığına dayanarak yüksek olasılıklı işlem fırsatlarını belirlemek için bu güçlü aracın nasıl kullanılacağını öğretir.
İster yeni başlayan ister deneyimli bir yatırımcı olun, bu sistem daha fazla güven ve tutarlılıkla işlem yapmanıza yardımcı olacaktır. BU BİR DEMO ÜRÜNDÜR. KURULUM TARİHİNDEN İTİBAREN 30 GÜN SONRA SÜRESİ DOLAR. Tam sürüm burada: https://www.mql5.com/en/market/product/160926?source=
FREE

Price Volume Distribution
Fiyat seviyesine gore islem hacmi dagitimini analiz eden Volume Profile gostergesi. MT5 icin POC, Value Area, hacim zirvelerini ve bolge tabanli sinyal filtrelemeyi goruntular.
Genel Bakis
Price Volume Distribution, MetaTrader 5 icin bir hacim analiz gostergesidir. M1 zaman dilimi verilerini kullanarak fiyat seviyelerindeki hacim dagitimini hesaplar ve goruntular, histogram cubuklari ve referans cizgileri ile gorsel temsil saglar. Sistemi anlamak için kullanım kılavu

This indicator plots the volume profile by Price on the chart
There are 5 ways to view it:
By Total Volume Traded (Premium Version); Volume Ticks(Forex) Separated by Buyers and Sellers (Premium Version); Buyers Only (Premium Version); Sellers Only (Premium Version); Business balance (Buyers - Sellers) (Premium Version); .
It is possible to select how many days the profiles will be calculated.( Premium Version)
On the current day it recalculates the histogram data for each new candlestick.
FREE
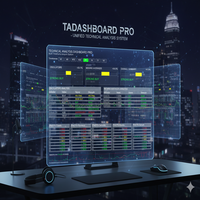
Technical Analysis Dashboard Pro (TADashboard Pro) – Birleşik Teknik Analiz Sistemi TADashboard Pro , birden fazla göstergeyi ( indikatör ) ve zaman dilimini ( timeframe ) tek bir görsel arayüzde birleştiren gelişmiş bir teknik analiz panelidir. Hassasiyet ve verimlilik arayan yatırımcılar ( trader ) için tasarlanan bu sistem, 8 farklı zaman diliminde eş zamanlı olarak 7 osilatör ve 4 hareketli ortalamayı analiz eder ve karar verme sürecini basitleştiren normalize edilmiş puanlar üretir. Temel Ö
FREE
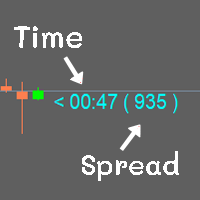
Show the time of candlesticks and spread. All data will be displayed in a rod. Can change color Can fix the size as needed
MT4 : Link https://www.mql5.com/en/market/product/102742 MT5 : Link https://www.mql5.com/en/market/product/102834
Most free code on various websites I didn't write it myself. I only do a little bit.
If you like it, please give 5 stars with it. Thank you.
FREE

Introduction
Reversal Candles is a cutting-edge non-repainting forex indicator designed to predict price reversals with remarkable accuracy through a sophisticated combination of signals.
Signal Buy when the last closed candle has a darker color (customizable) and an up arrow is painted below it Sell when the last closed candle has a darker color (customizable) and a down arrow is painted above it
FREE

Always getting MARGIN CALLS again and again? Still haven’t found an indicator or technique that DELIVERS CONSISTENT DAILY PROFIT ? Tired of depositing funds and desperately wishing you could FINALLY WITHDRAWING ?
Don’t worry. I’m a REAL FULL TIME TRADER and I’ll share with you the very indicator I'VE BEEN USING MYSELF to successfully become a full-time trader.
STOP WASTING time with indicators that aren’t created by real traders and have no proven track record!
Start today with th

A top-quality implementation of the famous Super Trend indicator, which needs no introduction. It is completely loyal to the original algorithm, and implements many other useful features such as a multi-timeframe dashboard. [ Installation Guide | Update Guide | Troubleshooting | FAQ | All Products ] Easy to trade It implements alerts of all kinds It implements a multi-timeframe dashboard It is non-repainting and non-backpainting Input Parameters
ATR Period - This is the average true range peri
FREE

Quantum Heiken Ashi PRO ile tanışın Pazar eğilimleri hakkında net bilgiler sağlamak üzere tasarlanan Heiken Ashi mumları, gürültüyü filtreleme ve yanlış sinyalleri ortadan kaldırma yetenekleriyle ünlüdür. Kafa karıştırıcı fiyat dalgalanmalarına veda edin ve daha sorunsuz, daha güvenilir bir grafik sunumuna merhaba deyin. Quantum Heiken Ashi PRO'yu gerçekten benzersiz kılan şey, geleneksel şamdan verilerini okunması kolay renkli çubuklara dönüştüren yenilikçi formülüdür. Kırmızı ve yeşil çubukl
ICONIC SMC Göstergesi — Kurumsal Düzeyde Netlikle İşlem Yapın Nihayet, manuel zahmet olmadan nesnel SMC . Grafikleri saatlerce işaretleyip girişinizi birkaç pip ile kaçırmaktan bıktınız mı? Gerçek para söz konusu olduğunda okumanızdan şüphe mi ediyorsunuz? Öznel ve zaman yiyen SMC devri bitti. ICONIC SMC Göstergesi “bir araç daha” değildir. Kurumsal seviyede bir analiz motorudur; Smart Money Concepts akışının tamamını otomatikleştirir ve grafiğinizi yüksek olasılıklı fırsatların canlı bir paneli
FREE

Desenvolvido por smart2trader.com Smart Super Trend é um indicador avançado de identificação de tendências, desenvolvido para detectar com alta precisão movimentos de alta e baixa do mercado . O indicador Super Trend da Smart utiliza algoritmos adaptativos combinados com filtros de volatilidade , proporcionando sinais mais limpos e alinhados à dinâmica real do preço. Conta ainda com um sistema inteligente de monitoramento que notifica, em tempo real, sempre que ocorre uma mudança de tendência ,
FREE

The Volume Profile Fixed Range indicator is a powerful tool designed for MetaTrader 5 (MT5) platforms. It visualizes the distribution of trading volume over a fixed historical range of bars, helping traders identify key price levels where significant volume has accumulated. This aids in spotting support/resistance zones, value areas, and potential reversal or breakout points. Below is a detailed description of its features:
Key Features: - Fixed Range Analysis: Analyzes volume profile based on
FREE

VWAP, or volume-weighted average price, helps traders and investors observe the average price that major traders consider the "fair price" for that move. VWAP is used by many institutions to set up large operations.
In this indicator, you can enjoy the following features:
Daily VWAP, with option to display your current price next to the chart VWAP Weekly, with option to display your current price next to the chart Monthly VWAP, with option to display your current price next to the chart
FREE

Gelişmiş momentum osilatörü, daha doğru aşırı alım ve aşırı satım sinyalleri için periyodunu piyasa oynaklığına göre otomatik olarak ayarlar. Çalışma Prensibi: Gösterge, yüksek oynaklıkta kısalan ve düşük oynaklıkta uzayan uyarlanabilir bir periyot hesaplaması kullanır. Bu dinamik ayar, piyasa trend halindeyken daha hızlı sinyaller sağlar ve yatay piyasa koşullarında yanlış sinyalleri azaltır. RSI değeri, bu değişken periyoda göre hesaplanır, bu da onu mevcut piyasa koşullarına daha duyarlı hale
FREE
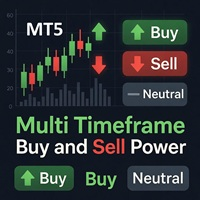
Multi Timeframe Buy and Sell Power
The "Multi Timeframe Buy and Sell Power" indicator for MetaTrader 5 is a versatile tool designed to provide traders with a clear visual representation of market pressure across nine standard timeframes, from M1 to MN1. By aggregating buy and sell strength percentages derived from recent price action and tick volume, it helps identify potential trends, reversals, and neutral market conditions in real-time. The indicator displays this information in a compact da
FREE
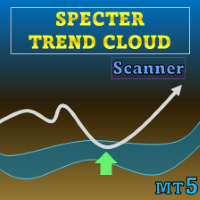
Özel teklif : ALL TOOLS , her biri sadece $35 ! Yeni araçlar $30 olacaktır ve ilk hafta veya ilk 3 satın alma için geçerlidir! Trading Tools Channel on MQL5 : En son haberleri almak için MQL5 kanalımı takip edin Specter Trend Cloud , piyasa yönünü ve kritik yeniden test fırsatlarını vurgulamak üzere tasarlanmış, hareketli ortalamalara dayalı bir trend görselleştirme aracıdır. Uyarlanabilir ortalamaları oynaklık ayarıyla birleştirerek, trend değişimlerinde tersine dönen renkli bir “bu

Volumes with Moving Average , hareketli bir ortalama ile desteklenmiş basit ve anlaşılır bir hacim göstergesidir.
Nasıl kullanılır?
Hem destek/direnç seviyelerinden hem de trend kanallarının volatilite kırılmalarından bir anlaşmaya girerken sinyalleri filtrelemek için çok uygundur. Ayrıca bir pozisyonu hacme göre kapatmak için bir sinyal olabilir.
Girdi parametreleri:
Hacimler - gerçek veya tik hacmi. MA_period - hareketli ortalama periyodu.
FREE
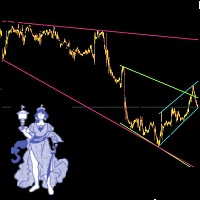
Leave a comment if you would like me to write an EA to trade these trendlines... if enough interest, will write an EA. Automatic Trendlines, updated automatically. To Set up 3 different (or mroe) Trendlines on chart, simply load the indicator as many times and name it differntly.. the example in the picture below is indicator 1 (loaded 1st time): Name: Long, StartBar: 50, BarCount: 500, Color: Pink indicator 2 (loaded 2nd time): Name: Short, StartBar: 20, BarCount: 200, Color: Green indicator 3
FREE

After your purchase, feel free to contact me for more details on how to receive a bonus indicator called VFI, which pairs perfectly with Easy Breakout for enhanced confluence!
Easy Breakout MT5 is a powerful price action trading system built on one of the most popular and widely trusted strategies among traders: the Breakout strategy ! This indicator delivers crystal-clear Buy and Sell signals based on breakouts from key support and resistance zones. Unlike typical breakout indicators

Volume Bar POC Göstergesi , işlem hacmine dayalı olarak önemli fiyat seviyelerini (Kontrol Noktası, POC) doğru bir şekilde görselleştiren yenilikçi bir araçtır. Bu gösterge, her bir mum çubuğu içindeki tüm fiyat noktalarını analiz eder ve en önemli fiyat seviyelerini gösterir. Bu seviyeler, güçlü destek ve direnç bölgeleri olarak kullanılabilir. Gün içi ve uzun vadeli ticaret stratejileri için idealdir. Volume Bar POC Göstergesi Nasıl Çalışır? Gösterge, her mum çubuğunun oluşumu sırasında POC'yi

Mean Reversion Supply Demand Indicator Mean Reversion Supply Demand is the indicator to detect the important supply demand zone in your chart. The concept of supply demand trading relies on the quantity mismatching between buying and selling volumes in the financial market. Typically, supply demand zone serves to predict the turning point. The wave pattern, for any supply demand zone to work as an successful trade, looks like the price must touch the base zone, move away and then return to zone

Daily VWAP Indicator (Volume Weighted Average Price) Special Deal! Leave a review and get the indicator Long & Short Cointegration Analyzer for free — just send me a message!
Description The Daily VWAP (Volume Weighted Average Price) indicator is an essential tool for traders seeking to identify the true average price of an asset throughout the day, adjusted by traded volume. Primarily used by institutional and professional traders, the daily VWAP serves as a reference point to identify the av
FREE
Heiken Ashi Smoothed Göstergesi (MT5) Gürültü filtresiyle gelişmiş Heiken Ashi. Yanlış sinyalleri azaltır, trendleri erken yakalar. Forex, endeks ve kripto için ideal (H1-D1). Nasıl Çalışır ve Düzgünleştirilir? Geleneksel Heiken Ashi, önceki dönemlerin açık, kapanış, yüksek ve düşük değerlerini ortalama alarak mumları hesaplar, bu zaten küçük dalgalanmaların etkisini azaltır. Ancak Heiken Ashi Smoothed , "ham" fiyatlara (raw) ek düzgünleştirme filtresi uygulayarak bu yaklaşımı yükseltir. Doğruda
FREE
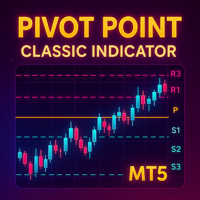
Detailed Description: The Pivot Point Classic Indicator is designed for traders who rely on classic pivot points and midpoints levels for their trading strategies. By automatically calculating and plotting these levels, the indicator provides a clear, visual representation of critical price areas where the market may reverse or break out. Key Features: Automatic Pivot Point Calculations : Automatically calculates pivot points, three support (S1, S2, S3) and resistance (R1, R2, R3) levels bas
FREE

Gravity Bands
A powerful all-in-one market structure, momentum, and trend framework for any intraday trader. Pay attention only 10 copies are sold at 49 USD! Next Price 69 USD. With the indicator you get a full mechanical trading plan and free EA code to automate your trading! Contact us after you have purchased the indicator! The Gravity Bands Indicator is designed for traders who want clarity — not noise.
Whether you scalp or day-trade, this tool gives you a clean visual structure of the m

The Volume Delta Indicator is a technical analysis tool that combines volume analysis with price action to identify potential trading opportunities. This indicator analyzes the difference between buying and selling pressure through candle structure analysis. Key Features Volume Delta Calculation : Measures buy/sell volume difference using candle structure analysis EMA Smoothing : Applies exponential moving average to smooth volume data Breakout Detection : Identifies price breakouts with volume
FREE

Stochastic MTF Dashboard Stochastic MTF Dashboard , verimliliği artırmak amacıyla tasarlanmış görsel bir çözümdür. Mevcut grafiğinizden ayrılmadan, 6 farklı zaman dilimine kadar Stokastik osilatörünün durumunu eş zamanlı olarak izlemenize olanak tanır. Amacı, kafa karışıklığını gidermek ve size piyasa gücü hakkında anlık bir okuma sağlamaktır: Kırmızı: Aşırı Alım Bölgesi: Fiyatta olası yorulma (Satış fırsatı). Yeşil: Aşırı Satım Bölgesi: Fiyatta olası toparlanma (Alış fırsatı). Gri: Nötr Bölge:
FREE
Are you ready to dominate the volatile world of synthetic indices trading? The Golden Boom and Crash Spike Indicator is the revolutionary MT5 indicator designed exclusively for high-stakes traders targeting explosive spikes in Boom 300 and Crash 300 . Optimized for the M1 (one-minute) timeframe , this advanced tool leverages proprietary AI-driven spike detection and precise price action analysis to generate non-repainting buy/sell arrows with unparalleled accuracy. Whether you're s

Pips Hunter PRO birkaç yıl içinde geliştirilmiştir ve selefinin geliştirilmiş bir versiyonudur. Bu güçlü gösterge, alım ve satım girişleri oluşturmak için piyasa ve fiyat geçmişini analiz eder. Bu girişlerin hesaplanması için, birlikte çalışan farklı göstergelerin yanı sıra daha az uygun girişleri filtreleyen ve bunları ortadan kaldıran karmaşık bir istatistiksel logaritma kullanır / MT4 sürümü .
Özellikler Yeniden boyama yok
Bu gösterge, yeni veriler geldiğinde değerlerini değiştirmez
G
FREE

Introducing the MACD Enhanced – an advanced MACD (Moving Average Convergence Divergence) indicator that provides traders with extended capabilities for trend and momentum analysis in financial markets. The indicator uses the difference between the fast and slow exponential moving averages to determine momentum, direction, and strength of the trend, creating clear visual signals for potential entry and exit points. Attention! To achieve the best results, it is recommended to adapt the indicator
FREE

Simplify your trading experience with Trend Signals Professional indicator. Easy trend recognition. Precise market enter and exit signals. Bollinger Bands trend confirmation support. ATR-based trend confirmation support. (By default this option is OFF to keep interface clean. You can turn it ON in indicator settings.) Easy to spot flat market conditions with ATR-based trend confirmation lines. Highly customizable settings. Fast and responsive. Note: Do not confuse ATR-based trend confirmation
FREE

A indicator for detecting FVGS
I hope this helps you scalp and generate money for yourself
NOTE BETTER:
Trading is risky and you can lose all your funds , use the money you are willing to lose
NOTE BETTER:
Trading is risky and you can lose all your funds , use the money you are willing to lose
NOTE BETTER:
Trading is risky and you can lose all your funds , use the money you are willing to lose
FREE

HiperCube AutoTrend Lines Darwinex Zero'da %20 indirim kodu: DWZ2328770MGM_20 Bu gösterge, destekleri ve dirençleri kolayca belirlemenize, grafikte çizgiler çizmenize ve piyasada önemli bir noktanın nerede olduğunu bilmenize yardımcı olur. Bu araç, işinizin bir kısmını sizin için yaparak, ticaretinizi yarı otomatik hale getirmenin en iyi yoludur. Direnç veya Destek, bazen belirlenmesi zor olan önemli seviyelerdir, ancak artık bu size daha fazla kafa karışıklığı yaratmayacaktır HiperCube Autotre
FREE
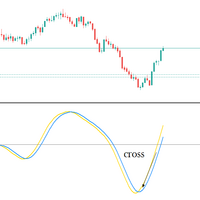
Big promotion on the Robos, Get yours now Robos Indicator The ROBOS indicator is a multi timeframe oscillator that targets the overbought and oversold regions of a price chart, a signal is indicated by the two lines crossing, compatible with all tradable instruments
Latest Release
The latest release is the version 4.0
#What's new in version 4.0 ?
Features
Extreme oversold and overbought levels
ROBOS version 4.0 comes with cool new feature , the ability to target only extrem
Genel Açıklama
Piyasadaki üç ana aşamayı belirlemek için net sinyaller ve basit kurallar. Bu gösterge, Asya seansına dayalı bir birikim (Accumulation) aşamasını gerçek zamanlı olarak algılar, manipülasyon (Manipulation) aşamasında likidite süpürmelerini tespit eder ve dağıtım (Distribution) aşamasında trend yönünü onaylar. Yükseliş aşaması için yeşil oklar, düşüş aşaması için kırmızı oklar gösterir, Asya kutusunu (Asia Box) özelleştirilebilir renk ve kenarlıkla çizer ve isteğe bağlı olarak hızl
FREE

Was: $49 Now: $33 Blahtech Better Volume provides an enhanced version of the vertical volume bars. Each bar is compared to the previous 20 bars. Depending on its volume, range and volume density it will be assigned a state and colour. Low Volume – Minimum volume High Churn – Significant volume with limited movement Climax Neutral – High volume with unclear direction
Climax Up – High volume with bullish direction Climax Dn – High volume with bearish direction Climax Churn – High vol

Otomatik Bağlı VWAP'lar ile Ticaretteki İçgörüleri Keşfedin: Otomatik Bağlı VWAP'lar , ticaret dünyasında rehberiniz olarak hizmet eder. Bu göstergeler, kritik piyasa dönüm noktalarını belirler ve VWAP çizgilerini kullanarak grafiğinizde gösterir. Bu, bağlı VWAP stratejilerini kullanan tüccarlar için bir oyun değiştiricidir. Nasıl Çalışır? Yüksek Noktaları Tanımlama: Eğer mevcut mumun en yüksek fiyatı önceki mumun en yüksek fiyatından düşükse, Ve önceki yüksek, ondan öncekinden daha yüksekse, Bi
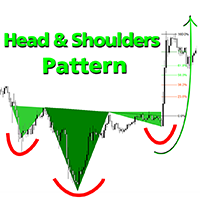
Hoş Geldin Fiyatı: 35 $ Baş ve Omuz Deseni , hem yükseliş hem de düşüş Baş ve Omuz formasyonlarını içeren güvenilir desen tanıma arayan traderlar için idealdir. Entegre Fibonacci seviyeleri, boyun çizgisi kırılım tespiti ve erken tahmin teknikleriyle donatılmıştır. Grafik yapılarını ve trend dönüşlerini belirlemede teknik analize ve hassasiyete önem verenler için güçlü bir MT5 aracıdır. Çift Tespit Yöntemi Yöntem 1 - Klasik Desen Tespiti
Tanımlanmış yapısal kurallar kullanarak standart Baş ve O
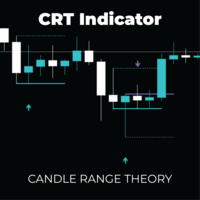
CRT Pro: Multi-Timeframe Reversal System Unlock high-probability reversal setups with the precision of Candle Range Theory (CRT) combined with Advanced DSL Trend Analysis. The CRT Multi-Timeframe System is not just a signal indicator; it is a complete trading framework designed to identify "Liquidity Sweeps" and false breakouts—the exact moments institutional money enters the market. By filtering these powerful reversal patterns through a customizable Multi-Timeframe (MTF) engine and DSL (Di
Haven Average Daily Range , ortalama günlük aralığı (ADR) hesaplayan ve görüntüleyen, yatırımcılara volatiliteyi ve potansiyel günlük fiyat hareketlerini değerlendirmek için vazgeçilmez bir araç sunan güçlü ve esnek bir göstergedir. En son güncelleme ile gösterge, geçmiş verileri doğrudan grafik üzerinde analiz etme yeteneği ekleyerek daha da işlevsel hale geldi! Diğer ürünlerime göz atın -> BURADAN Ana Özellikler: Geçmiş ADR Seviyeleri: Derinlemesine analiz ve görsel geriye dönük test (backtes
FREE
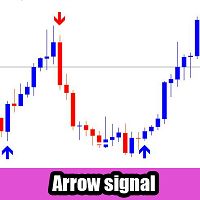
This indicator is designed to support traders by providing non-repainting arrow signals combined with dynamic period adjustment technology .
Its focus is on consistency, clarity, and flexibility, making it suitable for different timeframes and trading styles. Once a signal is generated, it does not repaint, drift, or disappear, ensuring that historical chart signals remain identical to real-time usage.
Recommendations Best Pairs: EURUSD, AUDUSD, XAUUSD, and similar liquid instruments Multi-Curre

It is a MetaTrader 5 integrated drawing tool inspired on the "Pointofix" software. You can paint, make annotations and drawings on the chart in real time. It works in multiple timeframes, that is, the drawings can be visualized in different timeframes. The drawings are also saved in files and can be restored even on MetaTrader restarting.
Simple and Pratical
Chart Pen is designed as simple, beautiful and innovative way to create and manage all your chart analysis. There is no existing drawing
FREE
Haven Trend Tracker PRO - Trend Dünyasındaki Rehberiniz Piyasa ile uyum içinde işlem yapmak isteyen yatırımcılar için tasarlanmış güçlü bir çoklu zaman dilimi göstergesi olan Haven Trend Tracker PRO 'yu sunuyoruz. Temel amacı, hem çalışma (LTF) hem de daha yüksek (HTF) zaman dilimlerinizde trend yönünü aynı anda göstererek şüphelerinizi ortadan kaldırmaktır. Diğer ürünlerim -> BURADA . Trendi takip ederek işlem yapmak en güvenilir stratejidir. Gösterge, piyasadaki baskın gücü belirlemenize v

Discover the MSG Method: Master the Major Session Gap for Consistent Forex Profits Unlock the power of the MSG Method – our proprietary Major Session Gap strategy designed to capture high-probability trades during key market session transitions. Developed by the T1 FX Team, this innovative approach leverages algorithmic precision to identify and exploit price gaps between major trading sessions (London, New York, and Tokyo). Why Choose the MSG Method? High-Probability Setups : Focuses on session
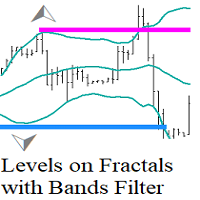
Levels on Fractals with Bands Filter bunlar Bollinger Bantları göstergesi ile filtrelenmiş fraktallara dayalı seviyelerdir.
Bollinger Bantları Filtreli Fraktallar Üzerindeki Seviyeler, destek ve direnç seviyelerini belirlemek için fraktallar ve Bollinger Bantları göstergesinin bir kombinasyonunu kullanan bir teknik analiz aracıdır.
Nasıl kullanılır?
Dış Bollinger bandının arkasında bir fraktal oluştuğunda (volatilite kırılması), fiyatın aşırı bir seviyeye ulaştığını ve yön değiştirebileceğ
FREE

NOTE: Turn Pattern Scan ON
This indicator identifies Swing Points, Break of Structure (BoS), Change of Character (CHoCH), Contraction and Expansion patterns which are plotted on the charts It also comes with Alerts & Mobile notifications so that you do not miss any trades. It can be used on all trading instruments and on all timeframes. The non-repaint feature makes it particularly useful in backtesting and developing profitable trading models. The depth can be adjusted to filter swing points.
FREE

An ICT fair value gap is a trading concept that identifies market imbalances based on a three-candle sequence. The middle candle has a large body while the adjacent candles have upper and lower wicks that do not overlap with the middle candle. This formation suggests that there is an imbalance where buying and selling powers are not equal. Settings Minimum size of FVG (pips) -> FVGs less than the indicated pips will be not be drawn Show touched FVGs Normal FVG color -> color of FVG that hasn't
FREE
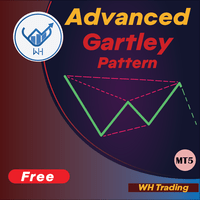
Gelişmiş Gartley Modeli tanıma göstergesine hoş geldiniz Bu gösterge, fiyat yapısının HH ve LL'sine ve Fibonacci Seviyelerine göre gartley desenini tespit eder ve belirli fib seviyeleri karşılandığında gösterge, deseni grafikte gösterir. MT4 Sürümü: WH Advanced Gartley Pattern MT4 **Bu Gösterge, tüm model tanımayı içeren Ultimate Harmonic Patterns MT5 kombinasyonunun bir parçasıdır.**
Özellikler : Gartley modelini yüksek doğrulukla tespit etmek için Gelişmiş Algoritma. Çok Hızlı
FREE
Strong Bull V7 B&C The ultimate M5 indicator for Boom & Crash indices, providing clear, filtered buy/sell signals to eliminate market noise and enhance your trading precision. Benefit-Focused Master the volatile Boom & Crash markets with Strong Bull V7 B&C . This intelligent indicator provides clear visual arrows and text labels for high-probability setups on the M5 timeframe. Its unique symbol-filtering technology automatically hides conflicting signals (no buys on Crash, no sells on Boom), en

Market Profile 3 MetaTrader 5 indicator version 4.70— is a classic Market Profile implementation that can show the price density over time, outlining the most important price levels, value area, and control value of a given trading session. This indicator can be attached to timeframes between M1 and D1 and will show the Market Profile for daily, weekly, monthly, or even intraday sessions. Lower timeframes offer higher precision. Higher timeframes are recommended for better visibility. It is als
FREE

Altın Hedefler en iyi trend göstergesidir. Göstergenin benzersiz algoritması, teknik ve matematiksel analiz faktörlerini dikkate alarak varlık fiyatının hareketini analiz eder, en karlı giriş noktalarını belirler, ok şeklinde bir sinyal ve fiyat seviyesini (SATIN ALMA Girişi / SAT Girişi) verir. bir sipariş açın. Gösterge aynı zamanda Zararı Durdur için fiyat seviyesini ve Kâr Al için beş fiyat seviyesini anında görüntüler.
DİKKAT: Göstergenin kullanımı çok kolaydır. Göstergeyi tek tıklamayl
Pazara doğru ve zamanında girişler için akıllı asistan. Fiyat seviyelere ulaştığında gösterge bip sesi çıkarır ve uyarılar verir. Destek ve direnç seviyelerini manuel olarak ayarlayabilir veya bunu algoritmaya emanet edebilirsiniz. Fiyatın seviyeye ulaştığı anda mum kalıpları ek olarak işaretlenir. Benzersiz mum kalıpları, klasik kalıpların ve seviyelerin kırılması ve kırılması modellerinin bir simbiyozudur. Borsada oldukça karlı ticaret için çoğu durumda emir belirlemek yeterli değildir ve tücc
FREE

ADX göstergesi trendi ve gücünü belirlemek için kullanılır. Fiyatın yönü +DI ve -DI değerleriyle, ADX değeri ise trendin gücünü gösterir. +DI -DI'nin üzerindeyse piyasa yükseliş trendindedir, tam tersi ise düşüş trendindedir. ADX 20'nin altında ise kesin bir yön yoktur. Gösterge bu seviyeyi kırdığı anda orta güçte bir trend başlıyor. 40'ın üzerindeki değerler güçlü bir trendi (düşüş trendi veya yükseliş trendi) gösterir.
Ortalama Yönlü Hareket Endeksi (ADX) göstergesinin çoklu para birimi ve ç

Bar Countdown With Symbol Info is a sleek, non-intrusive Heads-Up Display (HUD) designed to keep essential market data in front of your eyes without cluttering the chart. It combines a smart candle timer with a comprehensive symbol information strip.
Key Features: Smart Candle Countdown: Follow-Price Mode: The timer attaches dynamically to the Bid price line, moving up and down with the market so your eyes never leave the action. Dynamic Coloring: The background changes color in real-time
FREE

Yeni Başlayanlar veya Uzman Tüccarlar için En İyi Çözüm!
Bu gösterge benzersiz, yüksek kaliteli ve uygun fiyatlı bir ticaret aracıdır çünkü bir dizi tescilli özellik ve gizli bir formül ekledik. Yalnızca BİR grafikle 28 döviz çiftinin tümü için Uyarılar verir. Yeni bir trendin veya scalping fırsatının tam tetik noktasını belirleyebildiğiniz için ticaretinizin nasıl gelişeceğini hayal edin!
Yeni temel algoritmalar üzerine inşa edilen bu sistem, potansiyel işlemlerin belirlenmesini ve onaylanma
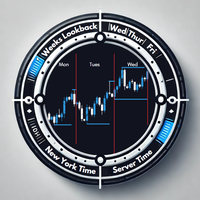
Overview The Daily Session Separator indicator is a powerful tool designed to enhance your trading experience by clearly marking daily trading sessions on your chart. It helps traders visualize daily boundaries, session highs and lows, and essential day-specific data to make informed decisions. With its seamless integration into any chart and dynamic adaptability, this indicator is a must-have for traders who rely on precision and clarity. Key Features Daily Session Separators Automatically adds
FREE

The "Sniper MACD" indicator is an improved version of the classic MACD, designed to enhance trading efficiency. It features additional filtering and multiple smoothing methods, allowing for more accurate signals. Features: Additional Filtering: Improves signal quality, reducing the likelihood of false triggers and increasing forecast accuracy. Multiple Smoothing: Reduces market noise, providing more reliable signals. Volume Integration: The built-in volume indicator helps assess market conditio
FREE
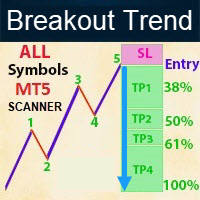
Contact me for instruction, any questions! - Lifetime update free - Non-repaint - I just sell my products in Elif Kaya Profile, any other websites are stolen old versions, So no any new updates or support. Introduction Breakout Trend Scanner indicator works based on the Elliott Wave in technical analysis describes price movements in the financial market that are related to changes in trader sentiment and psychology and finds end of movement and breakout trend. The Elliott Wave pattern that is f

Bu gösterge, MetaTrader 4 ve 5 için etkileşimli bir Elliott Dalga etiketleme aracıdır.
Kullanıcının, grafik üzerindeki menüden etiket boyutunu, rengini ve dalga türünü (ABC düzeltmeleri, 5 dalgalı impulslar veya WXY yapıları) seçerek dalga etiketlerini manuel olarak grafiğe yerleştirmesine olanak tanır.
Grafikte tek bir tıklamayla, gösterge seçilen fiyat ve zaman noktasına uygun dalga etiketlerini sırasıyla yerleştirir ve yatırımcıların Elliott Dalga yapılarını görsel olarak haritalandırmasına v
FREE

Integrated Dashboard Scanner – Version 4.00 The Ultimate Market Command Center just got smarter. Now with Programmable Logic Presets. The Integrated Dashboard Scanner (IDS) monitors multiple symbols and timeframes from a single, DPI-aware panel. Version 4.00 introduces a revolutionary Preset Editor , allowing you to combine signals from different modules into complex, custom strategies without writing a single line of code. NEW IN VERSION 4.00: Filter Presets & Logic Editor Stop scanning for

Divergence Matrix SE – Özel Sürüm
Ana divergansları hassas bir şekilde belirleyin ve fiyatın olası dönüş noktalarını anında görün!
Divergans noktalarını otomatik olarak göstererek piyasa analizine yardımcı olun — artık önemli hareketleri kaçırmayın. Divergence Matrix SE, MACD, MACD Histogram ve Stochastic için divergans uyarılarını korur ve hafif, sade bir deneyim sunar. Güvenilir sinyaller sağlamak için diverganslar, oluşumlarından 4 mum sonra gösterilir; böylece piyasa gürültüsü filtrelenir v
FREE
MetaTrader mağazasının neden alım-satım stratejileri ve teknik göstergeler satmak için en iyi platform olduğunu biliyor musunuz? Reklam veya yazılım korumasına gerek yok, ödeme sorunları yok. Her şey MetaTrader mağazasında sağlanmaktadır.
Alım-satım fırsatlarını kaçırıyorsunuz:
- Ücretsiz alım-satım uygulamaları
- İşlem kopyalama için 8.000'den fazla sinyal
- Finansal piyasaları keşfetmek için ekonomik haberler
Kayıt
Giriş yap
Gizlilik ve Veri Koruma Politikasını ve MQL5.com Kullanım Şartlarını kabul edersiniz
Hesabınız yoksa, lütfen kaydolun
MQL5.com web sitesine giriş yapmak için çerezlerin kullanımına izin vermelisiniz.
Lütfen tarayıcınızda gerekli ayarı etkinleştirin, aksi takdirde giriş yapamazsınız.