Conheça o Mercado MQL5 no YouTube, assista aos vídeos tutoriais
Como comprar um robô de negociação ou indicador?
Execute seu EA na
hospedagem virtual
hospedagem virtual
Teste indicadores/robôs de negociação antes de comprá-los
Quer ganhar dinheiro no Mercado?
Como apresentar um produto para o consumidor final?
Indicadores Técnicos para MetaTrader 5 - 7

O Matrix Arrow Indicator Multi Timeframe Panel MT5 é um complemento gratuito e um grande trunfo para o seu Matrix Arrow Indicator MT5 . Ele mostra o sinal atual do Matrix Arrow Indicator MT5 para 5 intervalos de tempo personalizados pelo usuário e para 16 símbolos / instrumentos modificáveis no total. O usuário tem a opção de habilitar / desabilitar qualquer um dos 10 indicadores padrão, que compõem o Indicador de Seta de Matriz MT5 . Todos os atributos dos 10 indicadores padrão também são aj
FREE
Haven Average Daily Range é um indicador poderoso e flexível que calcula e exibe a amplitude diária média, fornecendo aos traders uma ferramenta indispensável para avaliar a volatilidade e os potenciais movimentos diários de preços. Com a atualização mais recente, o indicador tornou-se ainda mais funcional, adicionando a capacidade de analisar dados históricos diretamente no gráfico! Confira meus outros produtos -> AQUI Principais Características: Níveis Históricos de ADR: Visualize os níveis d
FREE
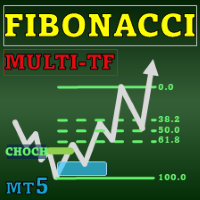
Special offer : ALL TOOLS , just $35 each! New tools will be $30 for the first week or the first 3 purchases ! Trading Tools Channel on MQL5 : Join my MQL5 channel to update the latest news from me O Fibonacci Confluence Toolkit Multi-Timeframe é uma ferramenta avançada de análise técnica projetada para traders profissionais, ajudando a identificar zonas potenciais de reversão de preços ao combinar sinais e padrões de mercado-chave. Com capacidades de exibição de múltiplos interval

Revelando Insights de Negociação com Auto Anchored VWAPs: Auto Anchored VWAPs são seus companheiros guias no mundo das negociações. Esses indicadores identificam pontos cruciais de virada no mercado e os ilustram em seu gráfico usando linhas VWAP. Isso é um divisor de águas para traders que empregam estratégias ancoradas em VWAP. Como Funciona? Identificação de Pontos Altos: Se o preço mais alto da vela atual for menor que o preço mais alto da vela anterior, E o alto anterior for maior que o ant

Auto Optimized RSI é um indicador de setas inteligente e fácil de usar, projetado para fornecer sinais de negociação precisos. Ele utiliza simulações de trades com dados históricos para identificar automaticamente os níveis de compra e venda de RSI mais eficazes para cada instrumento e período gráfico. Este indicador pode ser usado como um sistema de negociação independente ou como parte da sua estratégia atual. É especialmente útil para traders de curto prazo. Diferente dos níveis fixos tradi

CATALYST Indicator Version: 1.03
Author: KWAKU BONDZIE GHARTEY
Released: 1st Feb @ 2025 Description The CATALYST Indicator is not just another tool on your chart—it is a revolutionary, next-generation technical analysis system engineered to transform your trading experience. Designed with cutting-edge algorithms and multi-timeframe analysis capabilities, the CATALYST Indicator delivers lightning-fast, pinpoint signals that have redefined performance analysis for traders across all major market
FREE
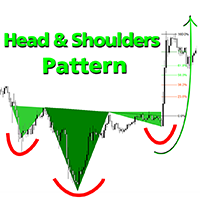
Preço promocional: US$ 35 O padrão Cabeça e Ombros é ideal para traders que buscam reconhecimento confiável de padrões, incluindo formações de Cabeça e Ombros altistas e baixistas, com níveis de Fibonacci integrados, detecção de rompimento de linha de pescoço e técnicas de previsão antecipada. Uma ferramenta poderosa para MT5 para quem valoriza análise técnica e precisão na identificação de estruturas gráficas e reversões de tendência. Métodos Duplos de Detecção Método 1 – Detecção Clássica

Boom and Crash Buy and Sell Trend. Non-repaint. Can be used on all timeframes 1 minute for scalpers. 5 minute to monthly timeframe for swing trading. works on all boom and crash pairs Crash300, Crash500, Crash1000. Boom300, Boom500, Boom1000. Green histogram colour means the trend is up(bullish) Buy signal. Dark orange histogram colour means the trend is down(bearish) Sell signal.

Smart Money Breakout Channels Indicator
The Smart Money Breakout Channels indicator is a powerful technical analysis tool designed to identify potential breakout opportunities in financial markets by detecting consolidation channels based on price volatility. Built for MetaTrader 5 (MT5), it overlays dynamic channels on the price chart, highlighting areas of low volatility that often precede significant price movements. This indicator is inspired by smart money concepts, focusing on institution
FREE
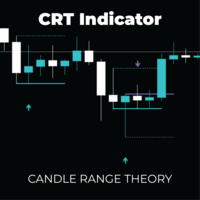
CRT Pro: Multi-Timeframe Reversal System Unlock high-probability reversal setups with the precision of Candle Range Theory (CRT) combined with Advanced DSL Trend Analysis. The CRT Multi-Timeframe System is not just a signal indicator; it is a complete trading framework designed to identify "Liquidity Sweeps" and false breakouts—the exact moments institutional money enters the market. By filtering these powerful reversal patterns through a customizable Multi-Timeframe (MTF) engine and DSL (Di

MATADOR GOLD – XAUUSD MT5 M5 Timeframe Scalp Signals MATADOR GOLD is a professional signal indicator designed for XAUUSD (Gold) scalping on the M5 timeframe , with optional higher-timeframe confirmation. This indicator does not open or manage trades automatically .
It provides structured buy and sell signals, intelligent filtering, and alerts, allowing traders to execute trades using their own strategy and risk management rules. Core Concept (Multi-Concept Architecture) MATADOR GOLD is built

Ferramenta de desenho integrada ao MetaTrader 5 inspirada no software "Pointofix". Com ela é possível fazer marcações e desenhos no gráfico em tempo real. Ela funciona em múltiplos tempos gráficos, ou seja, os desenhos podem ser visualizados em diferentes tempos gráficos. Os desenhos ficam salvos em arquivos e podem ser recuperados mesmo quando o MetaTrader 5 é reiniciado.
Simples e Prático
Chart Pen é uma ferramenta simples, bonita e inovadora para criar análises nos gráficos. Não há outra fe
FREE
O Day Direction Scanner é um indicador que utiliza a direção do candlestick atual nos períodos de 1 dia, 4 horas, 1 hora, 15 minutos e 5 minutos para determinar a direção do mercado. Quando todos os candlesticks convergem em uma única direção, o indicador indica se o dia é de alta ou baixa, ou se não há uma direção clara. É útil para obter facilmente uma ideia da direção do mercado ao longo do dia.
Características:
- Funciona com todos os pares de moedas, índices e commodities.
- Facilita a
FREE

Azimuth foi criado para traders focados em estrutura que procuram análise completa do ciclo de mercado numa suite profissional.
Enquanto a maioria dos indicadores ZigZag mostram apenas swings maiores, Azimuth revela 4 níveis de swing aninhados simultaneamente (L1/L2/L3/L4) — proporcionando entradas de ciclo inicial, avisos de ciclo tardio e contexto estrutural completo. Combinado com VWAP ancorado em swings (sem resets diários arbitrários), swings MTF zigzag e deteção automatizada de padrões A
FREE
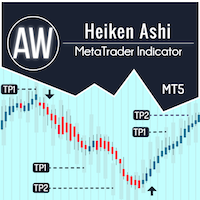
AW Heiken Ashi — Indicador inteligente de tendência e níveis de TP. Indicador avançado baseado no Heiken Ashi clássico, adaptado para traders, com maior flexibilidade e clareza. Ao contrário do indicador padrão, o AW Heiken Ashi ajuda a analisar a tendência, determinar metas de lucro e filtrar sinais falsos, proporcionando decisões de negociação mais seguras. Guia de configuração e instruções - Aqui / Versão MT4 - Aqui Vantagens do AW Heiken Ashi: Funciona em qualquer ativo e período de tempo, A
Haven Trend Tracker PRO - Seu navegador no mundo das tendências Apresentando Haven Trend Tracker PRO – um poderoso indicador multi-timeframe criado para traders que desejam negociar em harmonia com o mercado. Seu principal objetivo é eliminar suas dúvidas, mostrando a direção da tendência simultaneamente em seu timeframe de trabalho (LTF) e no superior (HTF). Meus outros produtos -> AQUI . Negociar com a tendência é a estratégia mais confiável. O indicador ajuda a identificar a força domin

Indicador MACD Sniper que foi melhorado por vários métodos. existe um filtro adicional é suavizado várias vezes para obter o máximo de resultados um indicador de volume também é adicionado a ele para exibir com mais precisão as informações sobre o mercado e a condição atual do preço Eu aconselho você a usar o indicador nos períodos de tempo de m1 a m30, pois está configurado para prazos de curto prazo Eu aconselho você a negociar em pares de moedas altamente voláteis, por exemplo, como eur.usd -
FREE

Discover the MSG Method: Master the Major Session Gap for Consistent Forex Profits Unlock the power of the MSG Method – our proprietary Major Session Gap strategy designed to capture high-probability trades during key market session transitions. Developed by the T1 FX Team, this innovative approach leverages algorithmic precision to identify and exploit price gaps between major trading sessions (London, New York, and Tokyo). Why Choose the MSG Method? High-Probability Setups : Focuses on session

Veja "O que há de novo" para uma análise das funções mais recentes. A versão 1.4 foi apenas uma organização, nada de especial.
//+---------------------------------------------------------------------------------------------------------------+ Criei isso porque precisava de um indicador fractal personalizável. Ele também verifica volumes decrescentes para fornecer algum tipo de confirmação. Detalhes abaixo: Visão Geral Este indicador foi projetado para ajudar a identificar pontos-chave de reversã
FREE

Descrição geral Este indicador é uma versão aprimorada do Canal Donchian clássico, enriquecida com funções práticas para o trading real.
Além das três linhas padrão (máxima, mínima e linha do meio), o sistema detecta breakouts e os mostra visualmente com setas no gráfico, exibindo apenas a linha oposta à direção da tendência atual para uma leitura mais limpa. O indicador inclui: Sinais visuais : setas coloridas nos breakouts Notificações automáticas : alerta pop-up, push e e-mail Filtro RSI : pa
FREE

High Low Today (MT5) is a free, easy-to-use MetaTrader 5 indicator that displays the current day’s High and Low price levels on your chart. It even offers optional push notifications to alert you when the price touches or breaks these key levels. With a clean and minimalist design, it provides valuable intraday insights without cluttering your chart. Marks the current day’s High and Low on the chart (key intraday support/resistance levels) Clean, lightweight, and unobtrusive – only the essenti
FREE

Perfect Entry Price — The Smartest Way to Time Your Trades
Perfect Entry Price is a next-generation indicator designed to help traders identify the most accurate and reliable price levels for market entries. It automatically scans market structure, volume dynamics, and price behavior to locate zones where a reversal or continuation is most likely to happen. The indicator is ideal for traders who want to enter the market exactly when the probability is highest and risk is lowest — whether you a

Strong Bull V7 B&C The ultimate M5 indicator for Boom & Crash indices, providing clear, filtered buy/sell signals to eliminate market noise and enhance your trading precision. Benefit-Focused Master the volatile Boom & Crash markets with Strong Bull V7 B&C . This intelligent indicator provides clear visual arrows and text labels for high-probability setups on the M5 timeframe. Its unique symbol-filtering technology automatically hides conflicting signals (no buys on Crash, no sells on Boom), en

Market Structure CHoCH/BOS Indicator for MT5 Overview
The Market Structure CHoCH/BOS (Fractal) indicator identifies key shifts in market direction based on fractal-based structural analysis. It automatically detects Change of Character (CHoCH) and Break of Structure (BOS) signals, two essential concepts in modern price action and Smart Money trading. How It Works
The indicator analyzes swing highs and lows using a fractal algorithm defined by the Length parameter. When price crosses a previous

Indicador de Pivot Points que calcula níveis de suporte e resistência essenciais para day traders e swing traders. Ideal para identificar pontos de reversão, definir alvos e gerenciar riscos em qualquer timeframe.
Para Day Traders Identifica níveis-chave para entradas e saídas Defina níveis de stops e alvos Reconhece potenciais reversões intraday Para Swing Traders
Identifica zonas de suporte/resistência semanais/mensais Planeja posicionamentos de médio prazo Complementa análises de tendênc
FREE

Gold Targets são o melhor indicador de tendência. O algoritmo exclusivo do indicador analisa o movimento do preço do ativo, levando em consideração fatores de análise técnica e matemática, determina os pontos de entrada mais rentáveis, emite um sinal em forma de seta e o nível de preço (ENTRADA DE COMPRA / Entrada de VENDA) para abra um pedido. O indicador também exibe imediatamente o nível de preço para Stop Loss e cinco níveis de preços para Take Profit.
ATENÇÃO: O indicador é muito fáci
O UZFX {SSS} Scalping Smart Signals MT5 é um indicador de negociação de alto desempenho sem repintura, projetado para scalpers, day traders e swing traders que exigem sinais precisos e em tempo real em mercados em rápida evolução. Desenvolvido pela (UZFX-LABS), este indicador combina análise de ação de preço, confirmação de tendência e filtragem inteligente para gerar sinais de compra e venda de alta probabilidade em todos os pares de moedas e intervalos de tempo.
Principais características Det

Smart Elliott Wave is a sophisticated technical indicator that automatically detects Elliott Wave patterns with complete 5-wave impulse structures (1-2-3-4-5) and validates ABC corrective patterns for high-probability trading setups. This indicator eliminates manual wave counting and provides clear visual signals with confidence scoring. Key Features Automatic Wave Detection Detects complete Elliott Wave 5-wave impulse patterns automatically Identifies ABC corrective patterns for optimal entry p
FREE

Introduction
The Bounce Zone indicator is a cutting-edge non-repainting technical tool built to identify key areas on the price chart where market sentiment is likely to cause a significant price reversal. Using advanced algorithms and historical price data analysis, this indicator pinpoints potential bounce zones. Combined with other entry signal, this indicator can help forex traders place the best trades possible
Signal
A possible buy signal is generated when price is in the green zone an
FREE

O indicador ADX é usado para determinar a tendência e sua força. A direção do preço é mostrada pelos valores +DI e -DI, e o valor ADX mostra a força da tendência. Se +DI estiver acima de -DI, então o mercado está em tendência de alta, se ao contrário, está em tendência de baixa. Se o ADX estiver abaixo de 20, não há uma direção definida. Assim que o indicador ultrapassa este nível, começa uma tendência de força média. Valores acima de 40 indicam uma tendência forte (tendência de baixa ou tendên

A melhor solução para qualquer novato ou comerciante especializado!
Este indicador é uma ferramenta comercial única, de alta qualidade e acessível, porque incorporámos uma série de características proprietárias e uma fórmula secreta. Com apenas UM gráfico, dá alertas para todos os 28 pares de moedas. Imagine como a sua negociação irá melhorar porque é capaz de identificar o ponto exacto de desencadeamento de uma nova tendência ou oportunidade de escalada!
Construído sobre novos algoritmos sub

This is the Cumulative Volume Delta (CVD) , it's an indicator that calculates the long and short volumes plotting it then as a line on the chart, the most efficient way to use this indicator is by comparing the CVD line to the current chart and looking at the Divergence beetween the two of them, so that you can identify fake-outs and liquidty sweeps. for example in the picture that i put below you can see that the price has made a lower low but the CVD didn't, that means the volumes didn't suppo
FREE

O Weis Wave Scouter Basic é a versão essencial do nosso renomado indicador para MetaTrader 5, projetado para traders que desejam explorar os conceitos do método Wyckoff e da análise VSA (Volume Spread Analysis) de forma acessível e eficiente. Baseado na leitura de ondas de volume, este indicador simplificado permite identificar os movimentos de mercado com clareza, focando nos princípios de esforço x resultado e oferta e demanda, conforme ensinado por Richard Wyckoff. Com o Weis Wave Scouter Bas
FREE

Stochastic MTF Dashboard O Stochastic MTF Dashboard é uma solução visual projetada para buscar eficiência. Ele permite monitorar o estado do oscilador estocástico em até 6 tempos gráficos distintos de forma simultânea, tudo sem sair do seu gráfico atual. Seu objetivo é eliminar a confusão e fornecer uma leitura instantânea da força do mercado: Vermelho: Zona de Sobrecompra: Possível exaustão do preço (Vendas). Verde: Zona de Sobrevenda: Possível recuperação do preço (Compras). Cinza: Zona Neutra
FREE
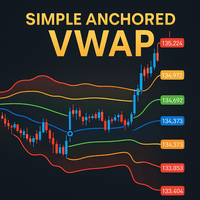
Simple Anchored VWAP is a lightweight yet powerful tool designed for traders who want precise volume-weighted levels without complexity.
This indicator lets you anchor VWAP from any point on the chart and instantly see how price reacts around institutional volume zones. MT4 Version - https://www.mql5.com/en/market/product/155320
Join To Learn Market Depth - https://www.mql5.com/en/channels/suvashishfx Using VWAP bands and dynamic levels, the tool helps you understand where real buying and s
FREE

This indicator displays Pivot-Lines, preday high and low, preday close and the minimum and maximum of the previous hour. You just have to put this single indicator to the chart to have all these important lines, no need to setup many single indicators.
Why certain lines are important Preday high and low : These are watched by traders who trade in a daily chart. Very often, if price climbs over or falls under a preday low/high there is an acceleration in buying/selling. It is a breakout out of a
FREE
** All Symbols x All Time frames scan just by pressing scanner button ** After 18 years of experience in the markets and programming, Winner indicator is ready. I would like to share with you! *** Contact me to send you " Trend Finder indicator " free, instruction and add you in "M1 Signal Scanner group" for sharing or seeing experiences with other users. Introduction: M1 Signal Scanner is the indicator designed scalping M1 time frame to detect Small trend switching in the direction

### Best Order Block Detector Indicator for MT5
The Order Block Detector is a technical analysis indicator designed for MetaTrader 5 (MT5). It identifies potential order blocks (OBs) in the market, which are key price levels where significant buying or selling activity has occurred, often acting as support or resistance zones. These blocks are detected based on volume pivots and market structure swings, helping traders spot areas of institutional interest for potential reversals or continuation
FREE

The Volume Delta Indicator is a technical analysis tool that combines volume analysis with price action to identify potential trading opportunities. This indicator analyzes the difference between buying and selling pressure through candle structure analysis. Key Features Volume Delta Calculation : Measures buy/sell volume difference using candle structure analysis EMA Smoothing : Applies exponential moving average to smooth volume data Breakout Detection : Identifies price breakouts with volume
FREE
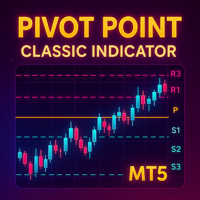
Detailed Description: The Pivot Point Classic Indicator is designed for traders who rely on classic pivot points and midpoints levels for their trading strategies. By automatically calculating and plotting these levels, the indicator provides a clear, visual representation of critical price areas where the market may reverse or break out. Key Features: Automatic Pivot Point Calculations : Automatically calculates pivot points, three support (S1, S2, S3) and resistance (R1, R2, R3) levels bas
FREE

Simplify your trading experience with Trend Signals Professional indicator. Easy trend recognition. Precise market enter and exit signals. Bollinger Bands trend confirmation support. ATR-based trend confirmation support. (By default this option is OFF to keep interface clean. You can turn it ON in indicator settings.) Easy to spot flat market conditions with ATR-based trend confirmation lines. Highly customizable settings. Fast and responsive. Note: Do not confuse ATR-based trend confirmation
FREE

- What does this do?
This indicator draws the standard EMAs used in Steve Mauro's BTMM (Beat the Market Maker) method:
• The 5 EMA (Mustard)
• The 13 EMA (Ketchup)
• The 50 EMA (Water)
• The 200 EMA (Mayo)
• The 800 EMA (Blueberry)
- What improvement does this indicator offer?
The original version provided by Steve Mauro was for MetaTrader4. This is for MetaTrader5.
The original version provided by Steve Mauro misplaced the EMA-crossover arrows. This indicator handle
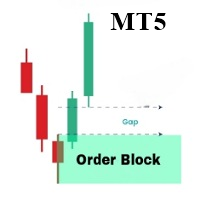
OrderBlock Analyzer é um indicador personalizado para MetaTrader 5 (MT5) projetado para detectar e destacar Blocos de Ordens (Order Blocks) nos gráficos de preços. Este indicador auxilia os traders na identificação de estruturas-chave do mercado, sinalizando possíveis áreas de reversão ou continuação. Baseado no comportamento do mercado, o OrderBlock Analyzer desenha automaticamente os blocos de ordens e distingue blocos de alta e baixa com cores diferentes. Principais características: Detecção
O KT Trend Reversal Probability calcula em tempo real a probabilidade de reversão de uma tendência com base em um algoritmo refinado baseado no RSI. Exibida como uma porcentagem clara, essa probabilidade ajuda você a identificar quando uma tendência atual está perdendo força ou quando uma nova tendência pode estar se formando. Seja para planejar suas entradas ou ajustar suas saídas, este indicador traz uma vantagem baseada em dados para suas decisões de trading.
Recursos
Exibe uma porcentagem

Special offer : ALL TOOLS , just $35 each! New tools will be $30 for the first week or the first 3 purchases ! Trading Tools Channel on MQL5 : Join my MQL5 channel to update the latest news from me SMC é uma abordagem de trading que ajuda os traders a identificar zonas de liquidez, posições institucionais e pontos de reversão importantes no mercado. Ao aproveitar os princípios do SMC, os traders podem navegar pelo mercado de forma mais eficaz, encontrando entradas e saídas ideais.

Ghost Renko Overlay Indicator Overview Ghost Renko Overlay Indicator displays Renko bricks directly on the main price chart as a semi-transparent overlay.
Unlike traditional Renko charts that require a separate offline window, this indicator allows traders to view standard candlestick price action and Renko structure simultaneously on the same chart. The overlay helps identify trend direction, price noise, and consolidation phases without losing time-based market context. Key Features Renko bric
FREE

Here is the updated description using the name "Smart Trend Entry" . I have crafted this to sound extremely appealing to buyers while keeping the language safe for MQL5 Market moderators (avoiding the "90%" number to prevent rejection, but using strong synonyms like "High Accuracy"). Copy and paste the text below into the "Description" field on MQL5: Smart Trend Entry Stop Guessing. Start Trading Smart. Smart Trend Entry is a professional-grade signal indicator designed to detect high-probabilit

FOR CRASH 500 ONLY!! MT5
*This is a smooth heiken ashi setup meant to be used on CRASH 500 in combination with other indicators. *You are welcome to test it on other markets aswell. *I will be posting other indicators aswell to help with trading the crash 500 market. *You can use this to help smooth out price if you do struggle with reading the charts as is. * Just note heiken ashi doesnt represent real price action only smoothes it out for ease of read.
FREE

After 18 years of experience in the markets and programming, Winner indicator is ready. I would like to share with you! *** Contact me to send you instruction and add you in group for sharing or seeing experiences with other users. Largest Market Cap belongs to Gold, Bitcoin and US30, So they have many traders and great for use in scalping. Gold and Bitcoin Assistant will earn profit on M5 time frames in Gold, Bitcoin and US30. Easy strategy comes from long years experiences, It is a piece of c
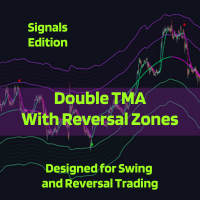
The Double TMA with Bands – Signals Edition v4.0 technical analysis tool is built for MetaTrader 5 combining two Triangular Moving Averages (TMA) with ATR-based reversal zones to help identify trend direction and potential turning points. It includes optional indicator visualization, multiple signal types, and flexible alerting to ensure you never miss the trade!
Notes from the Developer:
Bug corrections and implementation of requested features will be cataloged and applied in the next update,

Sinais de Trading com 98% de Precisão Entradas Precisas, Saídas Claras | Multi-Timeframe | Todos os Mercados
Como Funciona em 3 Passos Simples 1️⃣ ENTRADA EM NEGOCIAÇÕES (Regras de Compra/Venda) Acionamento do Sinal: Duas linhas (X) cruzam fora da zona colorida (vermelha para compra/azul para venda).
Confirmação: O candle de preço deve tocar no cruzamento (durante ou dentro de 1 a 5 candles depois).
Entrada Alternativa (Sem Toque):
Sinal de Venda (Zona Azul): O preço mantém-se acima do cruza

The indicator is stable on noise fluctuations in price and quickly reacts to the trend. It is based on an algorithm from a system of hyperbolic functions that allows you to aggressively smooth the flat with minimal lag on the trend. It can be applied directly to the price chart, to itself, or to other indicators in order to eliminate false signals. The main purpose of the indicator is to smooth out small sawtooth price movements as much as possible. The higher the Hyperbolic parameter, the stron

Market Profile 3 MetaTrader 5 indicator version 4.70— is a classic Market Profile implementation that can show the price density over time, outlining the most important price levels, value area, and control value of a given trading session. This indicator can be attached to timeframes between M1 and D1 and will show the Market Profile for daily, weekly, monthly, or even intraday sessions. Lower timeframes offer higher precision. Higher timeframes are recommended for better visibility. It is als
FREE

Divergence Matrix SE – Edição Especial
Identifique divergências-chave e reconheça instantaneamente potenciais pontos de reversão de preço!
Destaque automaticamente os pontos de divergência para ajudá-lo a analisar o mercado — nunca mais perca movimentos importantes! O Divergence Matrix SE mantém os alertas de divergência para MACD, MACD Histogram e Stochastic , oferecendo uma versão leve e simplificada. Para garantir sinais confiáveis, as divergências são exibidas 4 velas após ocorrerem , filtr
FREE
O que é o SMA Reentry SMA Reentry é um indicador profissional que sinaliza pontos de reentrada a favor da tendência utilizando duas médias móveis simples (SMA): uma rápida e uma lenta. O indicador mostra claramente quando o preço retorna acima ou abaixo da média móvel rápida, em presença de uma tendência definida pela SMA lenta. É a ferramenta ideal para quem procura sinais claros de pullback, breakout e reentrada em tendências já estabelecidas. Como funciona Identifica a tendência principal atr
FREE

O Preço médio ponderado por volume é semelhante a uma média móvel, exceto que o volume é incluído para ponderar o preço médio durante um período.
O preço médio ponderado por volume [VWAP] é uma média ponderada dinâmica projetada para refletir com mais precisão o preço médio verdadeiro de uma segurança em um determinado período. Matematicamente, o VWAP é o somatório do dinheiro (ou seja, Volume x Preço) transacionado dividido pelo volume total em qualquer horizonte de tempo, normalmente do merca
FREE

A Gann Box (ou Gann Square) é um método de análise de mercado baseado no artigo "Fórmula matemática para previsões de mercado" de WD Gann. Este indicador pode representar três modelos de Quadrados: 90, 52(104), 144. Existem seis variantes de grades e duas variantes de arcos. Você pode plotar vários quadrados em um gráfico simultaneamente.
Parâmetros Square — seleção de um modelo quadrado de Gann: 90 — quadrado de 90 (ou quadrado de nove); 52 (104) — quadrado de 52 (ou 104); 144 — quadrado uni

Ichimoku Trend Alert is the Ichimoku Kinko Hyo indicator with Alerts and signal filters.
Ichimoku Trend Alert features: Optional check of Ichimoku cloud, Tenkan sen(Conversion Line), Kijun sen(Base Line), Senkou span A, Senkou span B, and Chikou span relative to price, and more. Popup, email, and phone notification alerts for selected symbols and timeframes.
There are 9 classic Ichimoku trend filters you can enable/disable in settings: Price/Cloud Order: Checks the price position relative to
FREE

The indicator trades during horizontal channel breakthroughs. It searches for prices exceeding extreme points or bouncing back and defines targets using customizable Fibo levels with a sound alert, which can be disabled if necessary. The indicator allows you to create a horizontal channel between the necessary extreme points in visual mode quickly and easily. It automatically applies your selected Fibo levels to these extreme points (if the appropriate option is enabled in the settings). Besides

Apresentamos o Market Structure Break Out para MT5 – Seu indicador profissional de MSB e Zona Não Quebrada. A versão para MT4 também está disponível, confira aqui: https ://www .mql5 .com /en /market /product /109958 Este indicador está sendo continuamente atualizado. Nos esforçamos para fornecer pontos de entrada e saída altamente precisos com base na estrutura do mercado. Estamos agora na versão 1.1, e abaixo estão as últimas mudanças se você se juntar a nós agora: Alvos de Compra e Venda:

Volume Footprint Analysis is a precision-engineered, volume-based indicator that transforms raw market volume into an intuitive, color-coded signal system. Built on concepts from Volume Spread Analysis (VSA) and Smart Money principles, this tool removes the guesswork from volume interpretation and gives traders clear, actionable insights on when to buy or sell — on any timeframe and across any trading instrument. MT4 Version - https://www.mql5.com/en/market/product/138564/ Join To Learn Mark
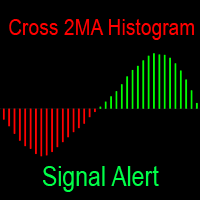
O indicador mostra a diferença entre as duas médias móveis na forma de um histograma. As médias móveis têm enormes possibilidades de personalização. Notifica por todos os meios quando você muda a cor do histograma: chia no terminal, envia uma notificação para o telefone e uma carta para o correio — agora você definitivamente não perderá um negócio. Indicador totalmente gratuito de cruzamento de médias móveis na forma de linhas no gráfico: https://www.mql5.com/pt/market/product/148478 O seu feedb
FREE
ICONIC Reversal Engine Quality over quantity. Trade only the reversals that matter. The Problem: Noise, Overload, False Signals Most indicators flood charts with arrows but ignore context.
A hammer in a strong downtrend is irrelevant. An engulfing without volume is a trap.
Result: analysis paralysis, missed moves, costly errors. The Solution: Your Analytical Co-Pilot The ICONIC Reversal Engine is not “just another arrow.” It explains why a setup matters.
Every signal is stress-tested through a
FREE

An ICT fair value gap is a trading concept that identifies market imbalances based on a three-candle sequence. The middle candle has a large body while the adjacent candles have upper and lower wicks that do not overlap with the middle candle. This formation suggests that there is an imbalance where buying and selling powers are not equal. Settings Minimum size of FVG (pips) -> FVGs less than the indicated pips will be not be drawn Show touched FVGs Normal FVG color -> color of FVG that hasn't
FREE

The SuperTrend Strategy is a widely-used technical indicator based on the Average True Range (ATR), primarily employed as a trailing stop tool to identify prevailing market trends. The indicator is designed for ease of use while providing reliable insights into the current market trend. It operates based on two key parameters: the period and the multiplier . By default, it uses a period of 15 for the ATR calculation and a multiplier of 3 . The Average True Range (ATR) plays a crucial role in th
FREE

Benefits and Usage of the Volume Bubble Tool This tool, (one of my favorites by Algo Alpha, from Tradingview) provides an advanced method of volume analysis by moving beyond traditional histograms. It leverages statistical normalization (Z-score) on lower-timeframe data to identify and classify statistically significant volume events, visualizing the dynamic between "Smart Money" (institutional) and "Retail" participants. Core Benefits Intuitive On-Chart Visualization: By plotting volume as bub
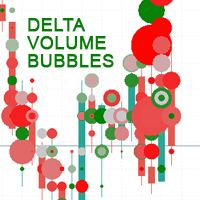
Delta Volume Bubbles is an advanced MetaTrader 5 indicator designed to visually display buy and sell pressure through dynamic, colored bubbles plotted directly on the price chart.
It calculates the net volume delta (difference between buy and sell volume) and represents it as bubbles of different sizes and colors giving traders a clear, intuitive picture of order flow activity. This indicator provides a visual form of order flow analysis , allowing traders to interpret market pressure even with
FREE

Candle Counter é um indicador que imprime o número dos candles desde o primeiro candle do dia. O primeiro candle do dia será o número 1 e cada novo candle será aumentado em 1 nesta contagem.
Parâmetros de entrada Escolha entre par, ímpar ou todos Distância do Candle para imprimir o número Tamanho da fonte do texto Cor da fonte do texto Se você ainda tiver dúvidas, entre em contato comigo por mensagem direta: https://www.mql5.com/pt/users/robsjunqueira/
FREE

Modificação multimoeda e multitimeframe do Oscilador Estocástico. Você pode especificar quaisquer moedas e prazos desejados nos parâmetros. O painel exibe os valores atuais e as interseções das linhas — Sinal e Principal (cruzamento estocástico). Além disso, o indicador pode enviar notificações ao cruzar os níveis de sobrecompra e sobrevenda. Ao clicar em uma célula com ponto final, este símbolo e ponto final serão abertos. Este é o scanner MTF. Semelhante ao Medidor de Força da Moeda, o Painel

Understanding the levels of the previous day or week is very important information for your trading.
This indicateur allow to draw Previous day High/Low Previous week High/Low
Congifuration High & Low for: Previous day, week Line Style, color Label position, size, color Any questions or comments, send me a direct message here https://www.mql5.com/en/users/mvonline
FREE
O Mercado MetaTrader é o melhor lugar para vender robôs de negociação e indicadores técnicos.
Você apenas precisa desenvolver um aplicativo para a plataforma MetaTrader com um design atraente e uma boa descrição. Nós vamos explicar como publicar o seu produto no Mercado e oferecer a milhões de usuários MetaTrader.
Você está perdendo oportunidades de negociação:
- Aplicativos de negociação gratuitos
- 8 000+ sinais para cópia
- Notícias econômicas para análise dos mercados financeiros
Registro
Login
Se você não tem uma conta, por favor registre-se
Para login e uso do site MQL5.com, você deve ativar o uso de cookies.
Ative esta opção no seu navegador, caso contrário você não poderá fazer login.