MetaTrader 5용 기술 지표 - 7

For those who struggle with overbloated Volume Profile/Market Profile indicators, here is a solution that contains only the Point of Control (POC) information. Super-fast and reliable, the Mini POC indicator presents this vital information visually within your chart. Totally customizable in splittable timeframes, type of Volume, calculation method, and how many days back you need.
SETTINGS Timeframe to split the POCs within the day. Volume type to use: Ticks or Real Volume. Calculation method .
FREE

이 인디케이터는 임의의 지점에서 거래량을 분석하고 해당 거래량의 시장 소진(exhaustion) 수준을 계산합니다. Meravith 주요 라인: 강세 거래량 소진선 – 목표로 사용됩니다. 약세 거래량 소진선 – 목표로 사용됩니다. 추세선 – 시장 추세를 나타냅니다. 시장이 강세인지 약세인지에 따라 색상이 변경되며, 추세 지지선 역할을 합니다. 사용 방법: 보라색 세로선을 더블 클릭한 후 원하는 위치로 이동시키십시오. 추세와 조정을 포함해 무엇이든 분석할 수 있습니다. 인디케이터를 시장의 상단, 하단 또는 중요하다고 생각되는 임의의 지점으로 이동시킬 수 있습니다. 좋은 방법은 시장이 소진선 사이에 머물도록 Meravith를 설정하는 것입니다. 이렇게 하면 추적할 수 있는 명확한 목표를 갖게 됩니다.
초기 소진선이 돌파되면 새로운 소진선이 나타나며, 추가로 거래 가능한 채널이 형성됩니다. 소진 수준에 도달하면 인디케이터의 위치를 다시 조정하거나 다른 시간 프레임으로 전환하여 새로운 소진

Smart Structure Concepts MT5 is an all-in-one Smart Money Concepts indicator created to help traders visually read institutional structure and understand why each movement occurs. Unlike most indicators on the Market, this system does not only draw patterns or zones. It teaches.
Every visual element (BOS, CHoCH, OB, FVG, EQH, EQL, PDH, PDL, etc.) includes educational tooltips that explain the concept and the suggested trader action (buy, sell, or wait).
These on-chart explanations make it perfe
FREE

Introduction
Reversal Candles is a cutting-edge non-repainting forex indicator designed to predict price reversals with remarkable accuracy through a sophisticated combination of signals.
Signal Buy when the last closed candle has a darker color (customizable) and an up arrow is painted below it Sell when the last closed candle has a darker color (customizable) and a down arrow is painted above it
FREE

B2U Market State System Part of the B2U Market State System A professional indicator suite designed to analyze market structure, trend state, and momentum. B2U Market State System 의 구성 요소입니다. 시장 구조, 추세 상태, 모멘텀을 입체적으로 분석하기 위한 전문 인디케이터 시스템입니다. Highlights structurally validated reaction zones after FVG inversion. The New Generation of Inversion Fair Value Gaps B2U IFVG BOX & Zone visually analyzes market reaction zones formed after Fair Value Gap (FVG) inversion. 차세대 Inversion Fair Value Gaps FVG 반
FREE
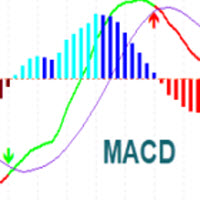
MACD Indicator It has MACD line, Signal line, and Histogram. The Histogram has 4 colors based on Direction Above and Below the Zero Line, showing its movement direction as simple as possible. Allows Show MACD & Signal Line, Show Change In color of MACD Line based on cross of Signal Line. Show Dots at Cross of MacD and Signal Line, Turn on and off Histogram. Enjoy your trading experience, and feel free to share your comments and reviews.
If you are interested in this indicator, you might be i
FREE

The SMC Market Structure indicator tracks key price action shifts using Smart Money Concepts (SMC), helping traders identify institutional behavior and overall trend direction.
It automatically detects and displays: Break of Structure (BOS) – Signals continuation of trend Change of Character (CHOCH) – Indicates potential reversal Swing Highs and Lows – Used to define market structure and directional bias
Each structural event is clearly marked on the chart, allowing traders to visualize momentu
FREE

초보자 또는 전문가 트레이더를 위한 최고의 솔루션!
이 지표는 우리가 독점 기능과 새로운 공식을 통합했기 때문에 독특하고 고품질이며 저렴한 거래 도구입니다. 단 하나의 차트로 28 Forex 쌍의 통화 강도를 읽을 수 있습니다! 새로운 추세 또는 스캘핑 기회의 정확한 트리거 포인트를 정확히 찾아낼 수 있기 때문에 거래가 어떻게 개선될지 상상해 보십시오.
사용 설명서: 여기를 클릭 https://www.mql5.com/en/blogs/post/697384
그것이 첫 번째, 원본입니다! 쓸모없는 지망생 클론을 사지 마십시오.
더 스페셜 강력한 통화 모멘텀을 보여주는 하위 창의 화살표 GAP가 거래를 안내합니다! 기본 또는 호가 통화가 과매도/과매도 영역(외부 시장 피보나치 수준)에 있을 때 개별 차트의 기본 창에 경고 표시가 나타납니다. 통화 강도가 외부 범위에서 떨어질 때 풀백/반전 경고. 교차 패턴의 특별 경고
추세를 빠르게 볼 수 있는 다중 시간 프레임 선택이 가능합

Entry Point M5 — a complete trading system. Entry Point M5 is a powerful indicator designed as a fully functional trading system suitable for any currency pair. It analyzes the price structure, identifying key moments of market reversals and the emergence of new impulses. The indicator can adapt to different market phases — from strong trending movements to sideways ranges — providing visually clear signals without the need for additional filters or auxiliary tools. Trading with this system is e

XAU POWER : The Gold Velocity Matrix XAU Power is an analytical suite specifically designed for Gold (XAUUSD) traders. This tool moves beyond traditional lagging indicators by utilizing a proprietary Velocity Decoupling Algorithm to measure the hidden energy balance between Gold and the US Dollar. Engineered for precision, XAU Power PRO synchronizes market momentum with a high-level Structural Trend Engine, giving you a definitive edge in identifying high-probability entry zones while avoiding
FREE

Market Structure ICT 인디케이터 1. 자동화된 시장 구조 분석 가장 큰 장점은 주관적인 해석으로 인한 오류를 줄여준다는 것입니다. 정확한 추세 식별: 추세 지속을 위한 **BOS (구조 돌파)**와 추세 반전을 위한 **CHoCH (추세 성격 변화)**를 자동으로 식별합니다. 스윙 분류: 단기, 중기, 장기 등 시장 구조 유형을 선택할 수 있어 스캘퍼와 스윙 트레이더 모두에게 적합합니다. 2. 전문 대시보드 다른 타임프레임을 확인하기 위해 화면을 전환할 필요가 없습니다. 한눈에 보는 분석: 대시보드는 모든 타임프레임(M1~W1)의 상태를 한 화면에 표시합니다. 점수 시스템: 하위 타임프레임의 점수를 합산하여 전반적인 편향 (Overall Bias) (예: "강한 상승" 또는 "혼조")을 요약해 줍니다. 추세의 신선도: BOS가 방금 발생한 "신규 돌파(Fresh Break)"인지 오래된 구조인지 알려줍니다. 3. 차트 상의 MTF 표시 (멀티 타임프레임) 정밀한 진입

The Golden PainX and GainX Spike Indicator is a cutting-edge, AI-powered trading tool engineered exclusively for the synthetic indices market. It masterfully combines proprietary spike detection algorithms and real-time price action analysis to generate high-probability, non-repainting trade signals with exceptional accuracy. Important( Use only on PainX 400and GainX 400 (M1 one minute timeframe) Identifies high-probability spikes with non-repainting buy/sell arrows. Automatically sets profit t

Bar Countdown With Symbol Info is a sleek, non-intrusive Heads-Up Display (HUD) designed to keep essential market data in front of your eyes without cluttering the chart. It combines a smart candle timer with a comprehensive symbol information strip.
Key Features: Smart Candle Countdown: Follow-Price Mode: The timer attaches dynamically to the Bid price line, moving up and down with the market so your eyes never leave the action. Dynamic Coloring: The background changes color in real-time
FREE

Price Action Suvo - Ultimate SMC & Trend Indicator
Key Features 1. Advanced Market Structure (BOS & CHoCH) Dual Structure Analysis: Automatically identifies both Internal Structure (short-term) and Swing Structure (major trends). BOS & CHoCH: Clearly marks Break of Structure (BOS) and Change of Character (CHoCH) with distinct styles. Visual Perfection: Internal: Dotted lines for minor structure. Swing: Solid lines for major structure. No Overlap: Fixed logic prevent
FREE
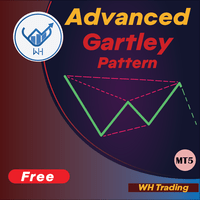
고급 Gartley 패턴 인식 표시기에 오신 것을 환영합니다. 이 지표는 가격 구조의 HH 및 LL과 피보나치 수준을 기반으로 가틀리 패턴을 감지하고 특정 fib 수준이 충족되면 지표가 차트에 패턴을 표시합니다. MT4 버전 : WH Advanced Gartley Pattern MT4 **이 표시기는 모든 패턴 인식을 포함하는 콤보 Ultimate Harmonic Patterns MT5 의 일부입니다.**
특징 : 높은 정확도 로 Gartley 패턴을 감지하는 고급 알고리즘. 매우 빠르고 리소스가 적습니다 (머신에 대한 요구가 적음). 지연 이나 다시 그리기가 없습니다. 사용자 정의 Fib 수준 조정(선호하는 설정에 따라 피보나치 수준을 변경할 수 있음) 약세 및 강세 패턴을 동시에 표시합니다(약세 또는 강세 설정에 대해 여러 패턴을 표시하는 기능 포함). 거래 수준 라인을 표시합니다(조정 가능한 중지 및 목표
FREE

L'indicatore "Heikin Ashi" è stato progettato per migliorare l'analisi dei grafici finanziari con un sistema di candele Heikin Ashi. Le candele Heikin Ashi sono un metodo avanzato per visualizzare il prezzo, che aiuta a filtrare il rumore del mercato, rendendo più chiara l'interpretazione dei trend e migliorando la qualità delle decisioni di trading. Questo indicatore consente di visualizzare le candele Heikin Ashi al posto delle candele giapponesi tradizionali, rendendo l'analisi grafica più pu
FREE

King Smart Liquidity MT5는 외환, 금, 지수, 비트코인 및 기타 시장에서 기관 자금 흐름과 주요 은행들을 추적하도록 특별히 설계된 고급 분석 지표입니다. 이 지표는 "스마트 머니 컨셉" 방법론을 기반으로 개발되었으며, 이는 가격 행동, 유동성 영역, 그리고 주요 금융 기관들이 시장에서 어떻게 행동하는지에 대한 이해에 의존합니다. 이 지표는 단순히 선이나 영역을 그리는 것이 아니라, 기존의 지연되는 지표들과는 차원이 다른 실제 시장 구조에 대한 포괄적인 분석을 제공합니다.
**주요 기능:**
1. **고급 시장 구조 분석** * 중요한 고점과 저점(HH, HL, LL, LH)의 탐지 및 강도 표시가 포함된 라벨링 * 구조 돌파(BOS) 및 성격 변화(CHoCH) 지점의 정확한 식별 * 더블 탑/바텀 탐지 및 즉각적인 시각적 알림 * 가격 행동에 기반한 실제 시장 방향에 대한 명확한 뷰
2. **스마트 오더 블록

This indicator draws price channels. Easy to use. It has various settings, for example, you can configure it to show channels only for buy or sell, you can display trend lines instead of channels. There are many trading strategies that are based on trading in channels, you can trade on the rebound from the borders of the channels, or the breakdown of the channel. Parameters History - the maximum number of bars for building channels; Distance - the minimum distance from one maximum (or minimum

Spike Blaster Pro – The Ultimate Spike Detection Tool Spike Blaster Pro is a next-generation MT5 indicator designed specifically for synthetic markets. It works seamlessly on Boom Index and Weltrade Index , providing traders with sharp, reliable spike detection signals. What makes Spike Blaster Pro powerful is its 5 Core Strategies built into one system, giving traders a multi-layer confirmation before signals appear. This ensures high accuracy and reduces false alerts. 5 Core Strategies B
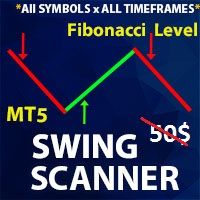
** All Symbols x All Time frames scan just by pressing scanner button ** Discount: The price is $50$, But now it is just $35, Limited time offer is active.
*** Contact me to send you instruction and add you in "Swing scanner group" for sharing or seeing experiences with other users. Swing EA: https://www.mql5.com/en/market/product/124747 Introduction: Swing Scanner is the indicator designed to detect swings in the direction of the trend and possible reversal swings. The indicator st
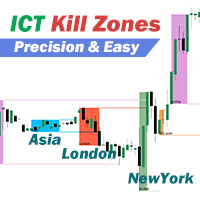
ICT 킬존의 5가지 시간대를 다른 색상으로 표시하고 추적을 따라 시간대 내 가격 영역을 표시하면 피벗 포인트 가격이 깨지거나 거래 기간이 끝날 때까지 고점과 저점 기준선이 자동으로 연장됩니다. 이 지표는 추세와 함께 거래할 거래 돌파 지점을 찾는 데 도움이 됩니다. ICT 킬존은 시장에서 거래량과 변동성이 증가하는 경향이 있는 특정 기간으로, 트레이더에게 잠재적 수익 기회를 열어줍니다. 5개의 킬존은 모두 고유한 색상과 주기로 사용자 지정할 수 있으며 원하는 대로 미세 조정하거나 완전히 다른 시간대로 조정할 수 있습니다. 표시기는 조정 사항을 자동으로 추적합니다. 인디케이터를 처음 사용할 때는 시간 오프셋을 설정해야 하는데, '현재 브로커 UTC 시프트'에서 메타트레이더 브로커 시간의 UTC 시차를 입력합니다(예: 메타트레이더의 기본 시간대가 UTC+3인 경우 3을 입력하고 베이징 시간으로 변경된 경우 8을 입력). 일광 절약 시간제(DST) 적용 지역의 경우, DST가 적용되면

Smart Fibo Zones are powerful, auto-generated Fibonacci Retracements that are anchored to key market structure shifts . These zones serve as critical Supply and Demand levels, guiding you to identify potential price reactions and confirm market direction. Fibonacci calculations, widely used by professional traders, can be complex when it comes to identifying highs and lows. However, Smart Fibo Zones simplify this process by automatically highlighting order blocks and key zones, compl
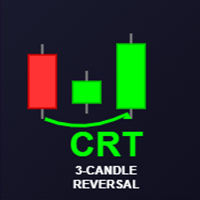
CRT Bomb Indicator - MT5 GBPUSD The CRT Bomb is a professional trading indicator that detects high-probability 3-candle reversal patterns (CRT - Candle Reversal Technique) across all timeframes and symbols. VPS is recomended so that you dont miss any CRT setups as they form , for entries you can use your manual analysis for confirmation like FVG, OBS etc Works on GBPUSD ONLY BUY THE FULL VERSION WORKING ON ANY INSTRUMENT HERE https://www.mql5.com/en/market/product/155393 Key Features: Identif
FREE

Strifor Lot Calculator is a tool for MetaTrader 5 that helps traders calculate the correct lot size based on risk and stop-loss.
It allows you to trade more consciously, manage risks better, and save time on manual calculations. Advantages Accurate risk control – automatically calculates the lot size according to your chosen risk %. Two working modes – manual input or quick calculation using chart lines. Supports all popular instruments – forex pairs, gold (XAUUSD), oil (USOIL/WTI), indices (US
FREE

YOU CAN NOW DOWNLOAD FREE VERSIONS OF OUR PAID INDICATORS . IT'S OUR WAY OF GIVING BACK TO THE COMMUNITY ! >>> GO HERE TO DOWNLOAD
This system is an Heiken Ashi system based on RSI calculations . The system is a free open source script originally published on TradingView by JayRogers . We have taken the liberty of converting the pine script to Mq4 indicator . We have also added a new feature which enables to filter signals and reduces noise on the arrow signals.
Background
HEIKEN ASHI
Th
FREE

40% off. Original price: $50 (Ends on February 15)
Advanced Bollinger Bands Scanner is a multi symbol multi timeframe Bollinger bands dashboard that monitors and analyzes the Bollinger Bands indicator from one chart. This panel scans the Bollinger bands indicator in up to 28 configurable instruments and 9 timeframes for price overbought/oversold, price consolidation (Bollinger bands squeeze), and consolidation breakout (squeeze break) with a deep scan feature to scan all market watch symbols
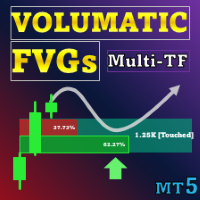
특별 할인 : ALL TOOLS , 개당 $35 . 신규 도구 는 $30 첫 주 또는 처음 3회 구매 에 한해 제공됩니다! Trading Tools Channel on MQL5 : 최신 소식을 받으려면 제 MQL5 채널에 참여하세요 Volumatic Fair Value Gaps (FVG)은 의미 있는 가격 불균형 구역을 식별·유지하고, 각 갭 내부의 방향성 거래량을 분해합니다. 거래량은 하위 시간프레임(기본 M1, 사용자 선택 가능)에서 샘플링되며, 매수/매도 비중으로 나뉘어 합계가 100%인 두 개의 퍼센트 바로 표시됩니다. 각 FVG의 오른쪽에는 총 거래량 라벨도 표시됩니다. 사용자 설정에 따라 가격이 반대 경계를 종가로 돌파(더 엄격)하거나 고가/저가의 심지로 접촉(더 민감)할 때 갭은 완화되어 제거됩니다.
MT5 버전 더보기: Volumatic Fair Value Gaps MT5 Multi Timeframe MT4 버전 더보기: Volumatic F

VWAP, or volume-weighted average price, helps traders and investors observe the average price that major traders consider the "fair price" for that move. VWAP is used by many institutions to set up large operations.
In this indicator, you can enjoy the following features:
Daily VWAP, with option to display your current price next to the chart VWAP Weekly, with option to display your current price next to the chart Monthly VWAP, with option to display your current price next to the chart
FREE
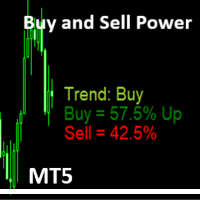
Simple Indicator that shows the Buy and Sell volume in percent. The Buy and Sell Power indicator for MetaTrader 5 calculates and displays estimated buy/sell volume percentages over a user-defined period (default: 14 bars) using tick volume data. It overlays text labels on the chart showing Buy % (with "Up" if >51%), Sell % (with "Dn" if >51%), and a trend signal based on thresholds: Neutral (<55%), Trend: Buy/Sell (55%+), Trend: Strong Buy/Sell (62%+), Trend Max UP/Down (65%+), or Trend change s
FREE

Stop searching for Fair Value Gaps manually. The Institutional Imbalance Scanner is a highly optimized analytical tool that identifies market inefficiencies with institutional precision – without slowing down your MetaTrader. Why this indicator? Most FVG indicators clutter your chart with outdated data and drain valuable CPU power. Our scanner uses a Smart-Update Algorithm that calculates only during real market changes. The Highlights: SMC Logic: Detects true Liquidity Voids based on Smart Mone
FREE
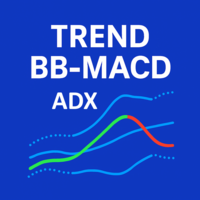
트렌드 BB MACD ADX 필터 지표 트렌드 BB MACD ADX 필터 는 볼린저 밴드(BB) , MACD , 그리고 **평균 방향성 지수(ADX)**를 결합한 고급 기술적 도구입니다. 이제 +DI 와 -DI 를 사용한 완전한 방향 분석 시스템과 MACD와의 교차 확인 옵션을 포함합니다. 이 지표는 스캘핑 , 단타매매 , 스윙 트레이딩 에 최적화된 정확하고 필터링된 트레이딩 신호를 제공하도록 설계되었으며, 추세의 방향뿐만 아니라 강도와 신뢰성을 파악하는 데 도움을 줍니다. 주요 구성 요소 볼린저 밴드 (BB) BB 미들 (중심선): 단순 이동 평균(SMA). BB 상단 / BB 하단: SMA ± (표준 편차 × 승수). 전체 맞춤 설정: 색상, 두께, 라인 스타일을 조정할 수 있습니다. 하이브리드 신호 (Hybrid Signal) MACD 라인(히스토그램 아님)과 BB 미들을 결합하고 그 값을 스케일링하여 동적 신호를 생성합니다. 스마트 색상 시스템: 녹색: ADX와 +DI로 확인
FREE

AlgoMatrix EMA Ribbon Trend Pro (MT5) Professional EMA Ribbon Trend Indicator for MetaTrader 5 Overview – Built for Serious Traders
AlgoMatrix EMA Ribbon Trend Pro is a high-performance, professional-grade EMA Ribbon Trend Indicator for MT5, created for traders who want clean trend detection, accurate entries, and zero repaint signals.
This indicator is designed using TradingView-style trend logic, combined with advanced market filters to eliminate noise, false signals, and choppy marke

The Clean Trading Sessions indicator shows the most significant trading sessions for the Forex market, such as London, New York, Tokyo. The Clean Trading Sessions indicator is a simple and, at the same time, quite functional Forex sessions indicator, developed for the MT5 terminal. It is available to download for free.
How is this Forex market session indicator used? Traders normally use trading sessions to determine the volatile hours throughout the day, since the trading activities vary
FREE
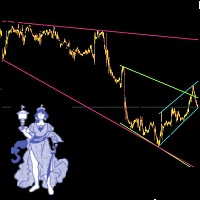
Leave a comment if you would like me to write an EA to trade these trendlines... if enough interest, will write an EA. Automatic Trendlines, updated automatically. To Set up 3 different (or mroe) Trendlines on chart, simply load the indicator as many times and name it differntly.. the example in the picture below is indicator 1 (loaded 1st time): Name: Long, StartBar: 50, BarCount: 500, Color: Pink indicator 2 (loaded 2nd time): Name: Short, StartBar: 20, BarCount: 200, Color: Green indicator 3
FREE
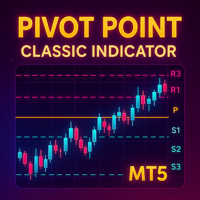
Detailed Description: The Pivot Point Classic Indicator is designed for traders who rely on classic pivot points and midpoints levels for their trading strategies. By automatically calculating and plotting these levels, the indicator provides a clear, visual representation of critical price areas where the market may reverse or break out. Key Features: Automatic Pivot Point Calculations : Automatically calculates pivot points, three support (S1, S2, S3) and resistance (R1, R2, R3) levels bas
FREE
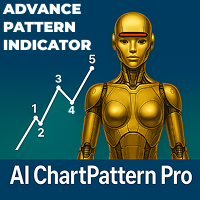
AI ChartPattern Pro AI ChartPattern Pro는 고정밀 차트 패턴 인식 도구로, 트레이더가 복잡한 차트 패턴을 객관적으로 식별하도록 도와줍니다. 편견이나 수작업 없이 신뢰할 수 있는 분석을 제공합니다. 버전 1.0은 두 가지 강력한 패턴을 지원합니다: 울프 파동(Wolfe Wave)과 헤드 앤 숄더(Head and Shoulders) 패턴. 이 지표는 단순히 패턴만 보여주는 것이 아니라, 실제로 매매에 활용할 수 있는 정보를 제공합니다: 진입 가격 손절가 (SL) 1차 목표가 (TP1) 2차 목표가 (TP2) 설정이 매우 간단하며, 사용자 입력이 거의 필요하지 않습니다. 즉시 사용할 수 있도록 설계되어, 설정보다는 실제 거래에 집중할 수 있도록 돕습니다. 주요 기능 울프 파동 및 헤드 앤 숄더 패턴 자동 탐지 진입, 손절, TP1, TP2 위치 시각적으로 표시 수동 개입 없는 객관적인 패턴 감지 최소한의 설정 – 플러그 앤 플레이 초기 출시가 – 새로운 패턴
FREE

The Volume Profile Fixed Range indicator is a powerful tool designed for MetaTrader 5 (MT5) platforms. It visualizes the distribution of trading volume over a fixed historical range of bars, helping traders identify key price levels where significant volume has accumulated. This aids in spotting support/resistance zones, value areas, and potential reversal or breakout points. Below is a detailed description of its features:
Key Features: - Fixed Range Analysis: Analyzes volume profile based on
FREE
FREE
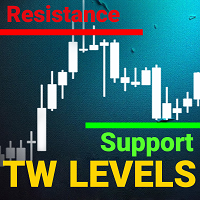
support resistance levels indicator mt5:
이 도구는 차트에서 지원 및 저항선과 피보나치 수준을 식별하고 플롯하는 다중 시간대 지표로, 인간의 눈과 동일한 정확도로 작동합니다. TW 외환 지원 및 저항 수준은 복잡한 알고리즘을 갖추고 있어 차트를 스캔하여 이전 가격 안정화 및 반등 수준을 식별하고 터치 횟수를 기록합니다.
수동으로 지원 및 저항 수준과 피보나치 되돌림을 그리는 데 지치셨습니까?
이 제품의 기능을 확인해 보세요. 놀라울 것입니다.
제품 특징:
1. 소규모 및 대규모 수준: 고급 알고리즘을 사용하여 소규모 및 대규모 수준을 사용자 취향에 맞게 사용자 정의하고 추가 수준을 제거할 수 있습니다.
2. 수준 터치 횟수: TW 지원 저항 수준과 브레이크 mt5, 각 수준이 과거에 몇 번 터치되었는지 계산하여 제공하여 각 수준의 강도를 평가할 수 있습니다.
3. 피보나치 수준: 마지막 파도의 피보나치 수준이 동적으로 그려져, 이러한
정확하고 적시에 시장 항목에 대한 스마트 조수. 가격이 수준에 도달 할 때 표시 경고음 및 경고. 지원 및 저항 수준을 수동으로 설정하거나 알고리즘에 위탁 할 수 있습니다. 가격이 수준에 도달하는 순간 촛불 패턴이 추가로 표시됩니다. 독특한 촛불 패턴은 고전적인 패턴과 고장 및 리바운드 수준의 패턴의 공생입니다. 증권 거래소에서 수익성이 높은 거래를 위해서는 대부분의 경우 주문을하는 것만으로는 충분하지 않으며 상인은 중요한 수준에 접근 할 때 가격이 어떻게 행동하는지 개인적으로보고 분석해야합니다. 나는 모든 상인이 우리가 거래일의 시작 부분에 중요한 목표를 설정 한 다음 가격이 그들에 도달 할 때 순간을 놓친 상황에 걸쳐 온 것 같아요. 그 결과,항목의 순간을 놓치고,우리는 우리의 계획에 따라 전체 가격 움직임을보고 추가 부정적인 감정을 얻을. 그러나 당신은 거기에 없으며 이익이 없습니다. 즐거움과 편안함을 가진 무역! 더 이상 끝에 일 동안 모니터를 응시하지 않습니다. 당신에게 중
FREE

HiperCube AutoTrend Lines 다윈엑스 제로 20% 할인 코드: DWZ2328770MGM_20 이 지표는 쉽게 지지선과 저항선을 식별하고, 차트에 선을 그리고, 시장에서 중요한 지점이 어디인지 알 수 있도록 도와줍니다. 이 도구는 일부 작업을 대신하여 거래를 반자동화하는 가장 좋은 방법입니다. 저항선 또는 지지선은 때때로 식별하기 어려운 중요한 수준이지만, 이제는 더 이상 혼란스럽지 않습니다.
HiperCube Autotrends는 모든 시간대에 맞게 설계되었습니다. 모든 종류의 전략, 스캘핑, 스윙, 일중... 모든 시장, 외환, 상품, 지수, 암호화폐... XAU, EURUSD, BTC, US30 또는 원하는 곳에서 사용할 수 있습니다. Chat gpt와 AI를 사용하여 개발되었습니다. 계정: 원하는 곳에서 실제 또는 데모로 사용하세요. 모든 종류의 계정은 네팅 또는 헤징에 유효합니다.
기능 사용하기 쉬움 유용한 옵션으로 준비됨 저항선과 지지선을 사용자 정의
FREE

이제 메타트레이더에서 사용 가능 범위 및 다음 가능한 움직임 식별 | 추세의 초기 신호와 강도를 확인하세요 | 반전 전 명확한 출구 확보 | 가격이 테스트 할 피보 레벨 파악 비추적, 비지연 지표 - 수동 및 자동 거래에 이상적 - 모든 자산 및 모든 시간 단위에 적합 구매 후, 무료 TrendDECODER_Scanner를 받기 위해 저에게 연락해 주세요. MT4 버전: 여기를 클릭하세요 BladeSCALPER 및 PowerZONES 로 전체 방법을 확인하세요.
어떤 서비스인가요?
트렌드디코더는 추세 모니터링을 간단하고 쉽게 하기 위한 여러 혁신 기술의 집약체입니다.
투영 추세선(투영 추세선) - 다가오는 추세의 속도 기준 실시간 추세선과 투영 추세선 비교 - 시장이 이전과 같은 방향으로 움직이고 있는지, 아니면 둔화되고 있는지? 실시간 추세선 교차 - 추세가 궤도를 이탈하고 있습니다. 그레이박스

SMC 세션 지표는 ICT 개념, 유동성 사냥 및 세션 기반 전략 에 의존하는 스마트 머니 트레이더를 위해 제작된 정밀 도구입니다.기관 수준 트레이더가 사용하는 가장 입증되고 인기 있는 개념을 사용하여 중요한 세션 기반 거래 구역을 원활하게 매핑합니다.이 올인원 세션 지표는 다음을 포함하여 가장 효과적이고 확률이 높은 범위 전략으로 차트를 오버레이합니다.ICT 아시아 범위, 런던 브레이크아웃, 뉴욕 범위, ICT 런던 오픈 킬존, ICT 뉴욕 오픈 킬존, 오프닝 범위 브레이크아웃(ORB) ( 런던, 뉴욕, 도쿄 포함) 및 강력한 자정 오프닝 범위 .또한 시드니, 도쿄, 런던 및 뉴욕 을 포함한 주요 외환 거래 세션을 강조 표시합니다.각 범위는 TimeBox 방법론을 사용하여 최대 정확도로 그려져 주요 FVG(공정 가치 갭), 범위 스윕, 세션 최고/최저 및 잠재적인 마켓 메이커 조작 구역을 식별하는
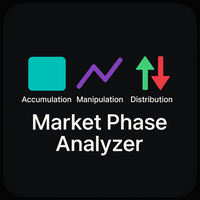
개요
명확한 신호와 간단한 규칙으로 시장의 세 가지 핵심 단계를 식별합니다. 이 지표는 아시아 세션을 기반으로 한 축적(Accumulation) 단계를 실시간으로 감지하고, 조작(Manipulation) 단계에서 유동성 스윕을 식별하며, 분배(Distribution) 단계에서 추세 방향을 확인합니다. 상승 단계에는 녹색 화살표, 하락 단계에는 빨간색 화살표를 표시하며, 아시아 박스의 색상과 테두리를 사용자 정의할 수 있고, 옵션으로 일일 시가 라인을 표시하여 신속한 인트라데이 분석을 지원합니다. 작동 원리
축적 단계에서 지표는 기록된 고점과 저점 사이에 박스를 생성합니다. 조작 단계에서는 가격이 박스 범위를 설정한 핍 수 이상 초과했는지 확인합니다. 분배 단계에서는 ATR 기반 확인 또는 고정 핍 돌파를 통해 단계 변화를 검증합니다. 조건이 충족되면 해당 화살표와 단계 레이블을 차트에 표시합니다. 3단계 거래 로직
축적(Accumulation) – 아시아 세션 시간을 설정하고
FREE

볼륨 & 유동성 헌터 – 스캘핑 은 다중 시간축에서 실시간으로 거래량 급증과 유동성 구역을 추적하도록 설계된 전문 수준의 스캘핑 지표입니다.
이 지표는 '스마트 머니(Smart Money)' 개념과 실시간 거래 조건을 결합하여 정밀한 스캘핑에 이상적인 도구가 됩니다. 반전, 돌파, 공정가치갭(FVG) 중 어떤 방식으로 거래하든 — 이 지표는 진정한 매수 및 매도 압력이 집중된 위치를 파악하는 데 도움을 줍니다. 실시간 볼륨 탐지
틱 볼륨 급등을 추적하고 최근 기록과 비교하여 비정상적인 시장 활동을 강조 표시합니다. 유동성 구역 식별
자동으로 공정가치갭(FVG)과 잠재적 주문 블록(Order Blocks)을 감지합니다. 가격이 반응할 가능성이 높은 구역을 강조 표시합니다. M5부터 H4까지의 다중 시간 분석, 시간 프레임을 자유롭게 조절 및 숨길 수 있음
차트 상에 명확한 막대와 상자를 직접 표시합니다. 방해되지 않으며 사용자 정의 가능. 이 지표는 시장을 지속적으로 스캔하면서
Day and Week Separator MT5로 거래 분석을 간소화하세요. 사용자 지정 가능한 일일 및 주간 분리선을 그리는 직관적인 도구로, 브로커의 타임존 차이를 다루는 트레이더에게 이상적입니다. Forex Factory와 Reddit의 r/Forex와 같은 거래 커뮤니티에서 간단함과 효율성으로 높이 평가받으며, Investopedia와 TradingView 같은 플랫폼에서 논의된 바와 같이 차트 타임프레임을 로컬 또는 시장별 시간과 정렬하는 일반적인 문제를 해결합니다. 트레이더들은 차트 명확성을 향상시키는 능력을 칭찬하며, 세션을 명확히 표시함으로써 세션 기반 분석이 개선되고 거래 계획이 최대 20% 향상되었다고 보고합니다, 특히 타임존 오프셋이 큰 지역(예: 유럽 브로커를 사용하는 아시아 태평양 트레이더)에서 유용합니다. 이점으로는 일일 및 주간 시장 전환의 정확한 시각화, 로컬 또는 전략적 시간에 맞춘 사용자 지정 가능한 시간 오프셋, 모든 거래 설정에 원활하게 통합되는
FREE

Clear Signal AI — No‑Repaint Trend Confirmation + Trend Dashboard Clear Signal AI is a trend confirmation indicator built for fast, confident decisions. It combines confirmed on‑chart signals (designed to avoid repainting behaviour), SAR trend structure, multi‑timeframe alignment (M15/H1/H4) and a live confidence score — with a clean dashboard and optional alerts. Product overview Clear Signal AI is designed for traders who want clarity, structure and consistency. It provides: Confirmed trend ar
FREE
Haven Average Daily Range 는 평균 일일 변동폭(ADR)을 계산하고 표시하는 강력하고 유연한 인디케이터로, 트레이더에게 변동성과 잠재적인 일일 가격 움직임을 평가할 수 있는 필수 도구를 제공합니다. 최신 업데이트를 통해 차트에서 직접 과거 데이터를 분석하는 기능이 추가되어 더욱 강력해졌습니다! 저의 다른 제품 보기 -> 여기 클릭 주요 기능: 과거 ADR 레벨: 지난 날들의 ADR 레벨을 차트에서 직접 시각화하여 심층 분석 및 시각적 백테스팅이 가능합니다. 유연한 표시 제어: ShowHistory 파라미터로 과거 데이터 표시를 완벽하게 제어하세요. 분석이 필요할 때 활성화하고, 깔끔한 차트를 원할 때 비활성화할 수 있습니다. 성능 최적화: DaysToCalculate 를 사용하여 과거 데이터 계산 일수를 정확하게 설정하세요. 이를 통해 긴 타임프레임에서도 터미널의 최대 성능을 보장합니다. 다중 기간 ADR 계산: 여러 기간(5일, 10일, 20일)을 기반으로 한
FREE

If you like this free tool, check out my EA which is currently on a Launch Sale for only $39 ! https://www.mql5.com/zh/market/product/159451?source=Site Short Description: A specialized technical indicator designed for Gold (XAUUSD) trading. It automatically identifies market swings, plots key 0.382 and 0.618 Fibonacci retracement levels, and sen mobile push nothiations not sat 面紙 面 面 面面 筆/內托are detected. 【Key Features】 Dual Monitoring Mode: Simultaneously tracks the 0.382 (Shallow Retracement)
FREE
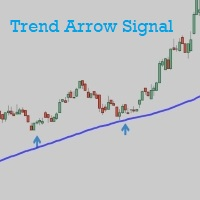
Trend Arrow Signal gives buy/sell signals and alerts with up and down arrow at potential reversal of a pullback or a trend continuation pattern. As the name indicated, this is an indicator which gives signals based on trend => It works best in trend market with the principle is to ride on the trend not trade against the trend. The main trend is determined by EMA 50 and can be changed manually to suit your preference. Trend arrow signal can work on all time frames. It gives signal at close of th
FREE

Ritz Smart Detection BUY & SELL
Visit premium products : https://www.mql5.com/en/market/product/155962 Visit, what can you get? : https://www.mql5.com/en/users/ritzfalih/seller
The Ritz Smart Detection BUY & SELL is a next-generation trading indicator engineered to detect high-probability entry signals by combining ATR-based volatility measurement , trend reversal detection , and smart alerting technology . It delivers real-time BUY/SELL opportunities with adaptive targets and risk levels,
FREE

Desenvolvido por smart2trader.com Smart Super Trend é um indicador avançado de identificação de tendências, desenvolvido para detectar com alta precisão movimentos de alta e baixa do mercado . O indicador Super Trend da Smart utiliza algoritmos adaptativos combinados com filtros de volatilidade , proporcionando sinais mais limpos e alinhados à dinâmica real do preço. Conta ainda com um sistema inteligente de monitoramento que notifica, em tempo real, sempre que ocorre uma mudança de tendência ,
FREE

이것은 고점과 저점을 판단하기 위한 명확한 지표이며 진동 시장에 적합합니다.
프로모션 가격 49$ → 59$
특징 상의와 하의를 잘 판단한다 다시 그리기 없음, 드리프트 없음 빠른 계산, 지연 없음 풍부한 알림 모드 여러 매개 변수 및 색상을 조정할 수 있습니다.
매개변수 "======== 메인 ========" HighLowPeriod1 = 9 HighLowPeriod2 = 60 HighLowPeriod3 = 34 HighLowEMAPeriod = 4 MASignalPeriod = 5 "======== 알림 ========" UseAlertNotify = 참; UseMetaQuotesIDNotify = 참; UseMailNotify = 참; NotifySignalMode = 색상 변경 및 레벨 확인; 하이레벨 = 80; 저수준 = 20; NofityPreMessage = "스마트 피크 바닥";
EA 통화의 경우 0. 높은 버퍼 1.낮은 버퍼 2. 방향 버퍼 1 up, 0,

Daily VWAP Indicator (Volume Weighted Average Price) Special Deal! Leave a review and get the indicator Long & Short Cointegration Analyzer for free — just send me a message!
Description The Daily VWAP (Volume Weighted Average Price) indicator is an essential tool for traders seeking to identify the true average price of an asset throughout the day, adjusted by traded volume. Primarily used by institutional and professional traders, the daily VWAP serves as a reference point to identify the av
FREE

시장 동향에 대한 명확한 통찰력을 제공하도록 설계된 Heiken Ashi 양초는 노이즈를 필터링하고 잘못된 신호를 제거하는 기능으로 유명합니다. 혼란스러운 가격 변동에 작별을 고하고 더 매끄럽고 신뢰할 수 있는 차트 표현을 만나보세요. Quantum Heiken Ashi PRO를 정말 독특하게 만드는 것은 전통적인 촛대 데이터를 읽기 쉬운 색상 막대로 변환하는 혁신적인 공식입니다. 빨간색과 녹색 막대는 각각 약세와 강세 추세를 우아하게 강조하여 잠재적 진입점과 퇴장점을 매우 정확하게 파악할 수 있습니다.
Quantum EA 채널: 여기를 클릭하세요
MT4 버전: 여기를 클릭하세요
이 놀라운 지표는 다음과 같은 몇 가지 주요 이점을 제공합니다. 선명도 향상: Heiken Ashi 바는 가격 변동을 완화하여 시장 추세를 보다 명확하게 나타내므로 유리한 거래 기회를 쉽게 식별할 수 있습니다. 소음 감소: 종종 잘못된 신호로 이어지는 불규칙한 가격 변동에 작별을
ICONIC SMC Indicator — Trade with Institutional Clarity Finally, objective SMC—without the manual grind. Tired of spending hours marking charts only to miss the entry by a few pips? Doubting your read when real money is on the line? The era of subjective, time-consuming SMC is over. The ICONIC SMC Indicator is not “another tool.” It’s an institutional-grade analysis engine that automates the full Smart Money Concepts workflow and turns your chart into a live dashboard of high-probability opport
FREE

KS ABC Pattern Live Signal MSS with FIB
Main Purpose
This is a non-repainting price action tool aimed at traders who follow **ICT (Inner Circle Trader)** or **SMC (Smart Money Concepts)** methodologies. It focuses on identifying high-probability **ABC correction/pullback patterns** after strong momentum impulses, combined with **Market Structure Shift (MSS)** confirmation and **Fibonacci** confluence for entry signals.
It is designed for **manual trading** (not an automated EA/robot), partic
FREE

SynaptixQuant Commodities Dominance – Professional Market Intelligence Professional MT5 commodity strength dashboard with real-time dominance scoring, correlation analysis, and smart entry detection for Gold, Silver, Oil, and Metals traders. Institutional Commodity Intelligence for MetaTrader 5 The SynaptixQuant Commodities Dominance is a professional-grade market intelligence indicator built for traders who demand precision, structure, and clarity when trading commodities. Designed by Synapti

Stochastic MTF Dashboard (스토캐스틱 멀티 타임프레임 대시보드) Stochastic MTF Dashboard 는 효율성을 극대화하기 위해 설계된 시각적 솔루션입니다. 현재 차트를 벗어나지 않고도 최대 6가지의 서로 다른 타임프레임 에서 스토캐스틱 보조지표의 상태를 동시에 모니터링할 수 있습니다. 이 도구의 목표는 분석의 혼란을 제거하고 시장의 강도를 즉각적으로 파악할 수 있도록 돕는 것입니다. 빨간색: 과매수 구간 — 가격 상승 동력 소진 가능성 (매도 고려). 초록색: 과매도 구간 — 가격 회복 가능성 (매수 고려). 회색: 중립 구간 — 가격이 중간 범위 내에서 유지됨. 이 대시보드를 선택해야 하는 이유 다중 타임프레임의 명확성: M5(5분봉)부터 일봉(Daily)까지의 타임프레임을 단일 패널에서 시각화합니다. 몇 초 만에 상위 프레임의 추세를 파악하기에 이상적입니다. 초고속 판독: 복잡한 선들의 교차를 해석할 필요가 없습니다. 색상과 숫자 값이 시장의 정확한
FREE

VM Trend Candles Indicator - Complete Trend Trading Solution Trend Candles Indicator is a professional, intuitive, and easy-to-use Forex trading system designed to transform complex trend analysis into clear, high-probability trading signals. Based on proven trend-following principles and enhanced with intelligent market filtering, the indicator provides accurate BUY/SELL signals together with automatically calculated Stop Loss and Take Profit levels according to market volatility. The system su
Candle Timer Countdown (CTC) – Minimalist & Precise Candle Timer Candle Timer Countdown (CTC) is a lightweight and non-intrusive MetaTrader indicator that displays the remaining time of the current candlestick on your chart. Designed with simplicity and clarity in mind, this tool helps traders stay aware of candle closures without cluttering the chart. Key Features: Real-Time Candle Countdown
Always know how many seconds are left before the current candle closes – works on all timeframes. Minima
FREE

Volume Bar POC 인디케이터 는 틱 거래량을 기반으로 주요 가격 수준(Point of Control, POC)을 정확하게 시각화할 수 있는 혁신적인 도구입니다. 이 인디케이터는 각 캔들 내의 모든 가격 포인트를 분석하여 가장 중요한 가격 수준을 표시하며, 강력한 지지 및 저항 영역으로 활용할 수 있습니다. 데이 트레이딩 및 장기 거래 전략에 이상적입니다. Volume Bar POC 인디케이터는 어떻게 작동합니까? 이 인디케이터는 각 캔들이 형성되는 동안 POC를 계산하기 위해 고급 프로세스를 사용합니다: 캔들이 열릴 때 테이블 생성 : 새 캔들이 열리면 인디케이터는 다음 데이터를 포함하는 내부 테이블을 생성합니다: 가격 : 캔들의 Low와 High 사이의 모든 가격 수준. 거래량 : 각 가격 수준에서 발생한 틱 수(틱 거래량). 테이블은 캔들 범위 내의 모든 가격 포인트를 동적으로 포함합니다. 캔들이 형성되는 동안 테이블 업데이트 : High와 Low 값이 변할 때마다 새로

Advanced Stochastic Scalper MT5 는 인기 있는 Stochastic Oscillator를 기반으로 한 전문가용 지표입니다. Advanced Stochastic Scalper는 동적인 과매수(overbought) 및 과매도(oversold) 수준을 가진 오실레이터인 반면, 표준 Stochastic Oscillator에서는 이러한 수준이 고정되어 변경되지 않습니다. 이를 통해 Advanced Stochastic Scalper는 끊임없이 변화하는 시장에 적응할 수 있습니다. 매수 또는 매도 신호가 나타나면 차트에 화살표가 표시되고 알림이 트리거되어 적절한 타이밍에 포지션을 진입할 수 있으므로 항상 PC 앞에 앉아 있을 필요가 없습니다. Advanced Stochastic Scalper는 통화(암호화폐 포함) 및 바이너리 옵션 거래에 매우 적합합니다. MetaTrader 4 터미널용 Advanced Stochastic Scalper: https://www.mql5

** All Symbols x All Timeframes scan just by pressing scanner button ** *** Contact me to send you instruction and add you in "Market Structure group" for sharing or seeing experiences with other users. Introduction: Market structure is important for both new and professional traders since it can influence the liquidity and price action of a market. It’s also one of the most commonly used techniques to understand trends, identify potential reversal points, and get a feel for current mar

The Volume Delta Indicator is a technical analysis tool that combines volume analysis with price action to identify potential trading opportunities. This indicator analyzes the difference between buying and selling pressure through candle structure analysis. Key Features Volume Delta Calculation : Measures buy/sell volume difference using candle structure analysis EMA Smoothing : Applies exponential moving average to smooth volume data Breakout Detection : Identifies price breakouts with volume
FREE

Mean Reversion Supply Demand Indicator Mean Reversion Supply Demand is the indicator to detect the important supply demand zone in your chart. The concept of supply demand trading relies on the quantity mismatching between buying and selling volumes in the financial market. Typically, supply demand zone serves to predict the turning point. The wave pattern, for any supply demand zone to work as an successful trade, looks like the price must touch the base zone, move away and then return to zone

왜 대부분의 RSI 다이버전스 인디케이터는 지연되거나 리페인트가 발생하는가 RSI 다이버전스 인디케이터를 충분히 사용해 본 트레이더라면, 보통 다음 두 가지 상황 중 하나를 경험했을 것입니다. 신호가 너무 늦게 나타나거나,
이미 표시된 다이버전스 신호가 나중에 사라지는 경우입니다. 이 문제는 인디케이터가 “잘못 만들어서” 발생하는 것이 아닙니다.
다이버전스 자체의 계산 논리에는 피할 수 없는 트레이드오프 가 존재하기 때문입니다. 다이버전스를 최대한 빠르게 표시하려면 리페인트를 어느 정도 허용해야 하고,
리페인트를 완전히 피하려면 일정한 지연은 불가피합니다. 이 인디케이터는 이 두 극단 사이에서 보다 합리적인 균형점을 찾기 위해 설계되었습니다. 다이버전스가 지연될 수밖에 없는 이유 다이버전스는 본질적으로
두 개의 고점 또는 두 개의 저점을 비교하는 개념입니다. 문제는 고점이나 저점이
가격이 되돌림을 보인 이후에야 비로소 확정될 수 있다 는 점입니다. 되돌림이 발생하기 전까지의 고점·저
FREE
YouTube Channel: https://www.youtube.com/@trenddaytrader FREE EA for GOLD , Anticipation can be found here: https://www.mql5.com/en/market/product/123143
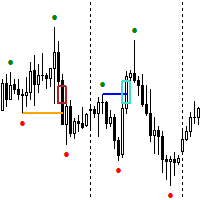
The Expert Advisor for this Indicator can be found here: https://www.mql5.com/en/market/product/115476 The Break of Structure (BoS) and Change of Character indicator with Fair Value Gap (FVG) filter is a specialized tool designed to enhance trading strategies by pinpointing high-probability trading opportunities on price charts. By
FREE

안녕하세요, 친구 여러분. MT5 터미널용 업데이트 버전입니다. 이것은 저의 첫 번째 지표를 기반으로 한 새로운 제품으로, 불필요한 설정을 없애고 골드(금)에 최적화된 개선 버전입니다. 이 지표는 알림 전송을 지원합니다. 사용 권장 사항: 상품 - XAUUSD (주요 상품, 여기에 최적화됨) 상품 - XAUEUR (보조 상품, 최적화되지는 않았지만 결과가 마음에 듭니다) 타임프레임 - H4. 지표를 차트에 추가하고 그대로 두십시오. 매수 신호 - 파란색 화살표. 매도 신호 - 빨간색 화살표. 진입점을 찾는 주요 소스로 사용할 수 있습니다. 손절매(Stop Loss): 노란색 점 - 이 점들을 따르는 것을 강력히 권장합니다. 사용 시나리오: 다음 캔들의 방향과 종가를 예측하는 것을 목표로 합니다. 따라서 신호를 받으면, 신호가 나타난 캔들의 종가에 맞춰 거래를 종료해야 합니다. 이익 실현(Take Profit): TP는 임의적이지만, 없는 것보다는 낫습니다

An ICT fair value gap is a trading concept that identifies market imbalances based on a three-candle sequence. The middle candle has a large body while the adjacent candles have upper and lower wicks that do not overlap with the middle candle. This formation suggests that there is an imbalance where buying and selling powers are not equal. Settings Minimum size of FVG (pips) -> FVGs less than the indicated pips will be not be drawn Show touched FVGs Normal FVG color -> color of FVG that hasn't
FREE
MetaTrader 마켓은 거래로봇과 기술지표를 판매하기에 최적의 장소입니다.
오직 어플리케이션만 개발하면 됩니다. 수백만 명의 MetaTrader 사용자에게 제품을 제공하기 위해 마켓에 제품을 게시하는 방법에 대해 설명해 드리겠습니다.
트레이딩 기회를 놓치고 있어요:
- 무료 트레이딩 앱
- 복사용 8,000 이상의 시그널
- 금융 시장 개척을 위한 경제 뉴스
등록
로그인
계정이 없으시면, 가입하십시오
MQL5.com 웹사이트에 로그인을 하기 위해 쿠키를 허용하십시오.
브라우저에서 필요한 설정을 활성화하시지 않으면, 로그인할 수 없습니다.