YouTubeにあるマーケットチュートリアルビデオをご覧ください
ロボットや指標を購入する
仮想ホスティングで
EAを実行
EAを実行
ロボットや指標を購入前にテストする
マーケットで収入を得る
販売のためにプロダクトをプレゼンテーションする方法
MetaTrader 5のためのテクニカル指標 - 7

Introducing the MACD Enhanced – an advanced MACD (Moving Average Convergence Divergence) indicator that provides traders with extended capabilities for trend and momentum analysis in financial markets. The indicator uses the difference between the fast and slow exponential moving averages to determine momentum, direction, and strength of the trend, creating clear visual signals for potential entry and exit points. Attention! To achieve the best results, it is recommended to adapt the indicator
FREE

移動平均線付き出来高は、移動平均線を使ったシンプルで分かりやすい出来高インジケーターです。
使い方は?
サポート/レジスタンス・レベルやトレンド・チャネルのボラティリティ・ブレイクアウトからエントリーする際のシグナルのフィルタリングに適しています。また、出来高によってポジションを決済するシグナルにもなります。
入力パラメータ
Volumes - リアルまたはティックの出来高。 MA_period - 移動平均期間。
移動平均線付き出来高は、移動平均線を使ったシンプルで分かりやすい出来高インジケーターです。
使い方は?
サポート/レジスタンス・レベルやトレンド・チャネルのボラティリティ・ブレイクアウトからエントリーする際のシグナルのフィルタリングに適しています。また、出来高によってポジションを決済するシグナルにもなります。
入力パラメータ
Volumes - リアルまたはティックの出来高。 MA_period - 移動平均期間。
FREE

Price Volume Trend (PVT) Oscillator Description: The PVT Oscillator is a volume indicator that serves as an alternative to the standard On-Balance Volume (OBV). While ordinary volume indicators can be noisy and hard to read, this tool converts volume flow into a clear Histogram Oscillator, similar to a MACD, but for Volume. It is designed to detect first Trend Reversals and Divergences by analyzing the difference between a Fast and Slow PVT moving average. Why is this better than standard OBV?
FREE

Change in State Delivery (CiSD). Overview: The Change in State delivery (CiSD) is a microstructure indicator that identifies critical pivotal points where the market (Price delivery Algorithm) shifts its directional focus from seeking liquidity on one side of the market to the other. Specifically, it signals a transition from buyside-driven liquidity to sellside-driven liquidity. CiSD marks the precise opening price that signals fundamental change in market structure and delivery direction.
C
FREE

TickFlow はティックデータを解析し、チャート上で重要なゾーンを視覚的に強調するツールです。現在および過去のティックを集計し、買い/売りの比率を表示し、サポート/レジスタンスレベルやクラスター領域の把握に役立ちます。 MetaTrader 4 用バージョンです。 動作概要(簡潔) TickFlow はティックデータを収集し、価格ステップとローソク足(キャンドル)ごとに集計します。
蓄積されたデータに基づいて、アップ/ダウンのティックカウンター、買い/売り比率、履歴レベル、クラスターといった可視化を構築します。
ユーザーは設定で感度や分析期間を調整できます。本ツールはトレードの判断を行うものではなく、分析用のデータを提供します。 特長 ローソク足ごとのティック活動表示(tick counters) 買い/売りの割合(パーセンテージ表示) ティック出来高に基づく履歴のサポート/レジスタンスレベル構築 価格領域のクラスター分析(cluster analysis) スキャルピング、デイトレード、中期取引など用途に応じた柔軟な感度設定 チャートの煩雑化を抑えるためのティック履歴の表示
Engulfing Zone Sniper MT5 — Multi-Timeframe Signal & Zone Indicator The Engulfing Zone Sniper MT5 is a technical analysis tool designed to highlight engulfing candlestick patterns in combination with adaptive support/resistance zones. It provides visual markers and optional alerts to assist traders in identifying market structure reactions across multiple timeframes. Key Features Multi-Timeframe Detection – Option to scan higher timeframe engulfing setups with lower timeframe confirmation. Su

Are You Tired Of Getting Hunted By Spikes And Whipsaws?
Don't become a victim of the market's erratic moves.. Do Something About It!
Instantly make smarter decisions with Impulse Pro's precise balance of filters and accurate statistics.
Timing Is Everything In Trading
To learn more, please visit www.mql5.com/en/blogs/post/718212 Anticipate the next big move before it unfolds in 3 Simple Steps!
Advantages You Get
Early impulse detection algorithm.
Flexible combination to different trading s

L'indicatore "Heikin Ashi" è stato progettato per migliorare l'analisi dei grafici finanziari con un sistema di candele Heikin Ashi. Le candele Heikin Ashi sono un metodo avanzato per visualizzare il prezzo, che aiuta a filtrare il rumore del mercato, rendendo più chiara l'interpretazione dei trend e migliorando la qualità delle decisioni di trading. Questo indicatore consente di visualizzare le candele Heikin Ashi al posto delle candele giapponesi tradizionali, rendendo l'analisi grafica più pu
FREE
FREE

Ekom Spike Detector Pro
Take your trading to the next level with the Ekom Boom and Crash Spike Detector Indicator Pro, designed for serious traders who demand more. This advanced version provides: Key Features: Accurate Spike Detection: Identify high-probability spike patterns in real-time using price action Clear Visual Signals: Displays clear buy and sell arrows on the chart for easy decision-making Alert options : MT5 Alert/Notification to receive alerts on your mobile when signal

The Advanced Trend Scalper MT5 indicator is designed to help both novices and professional traders. The indicator analyses the market and gives you buy and sell signals. It does not use any other indicators, it works only with the market actions. The signal appears right after the candle close and it does not repaint. The efficient algorithm provides a high degree of reliability of such signals. Advanced Trend Scalpe r for the MetaTrader 4 terminal : https://www.mql5.com/en/market/product/
AIチャートパターン・プロ AI ChartPattern Pro は、高精度で設計されたインジケーターで、トレーダーが主観的な判断や人の介入なしに、高度なチャートパターンを客観的に識別できるようにサポートします。
バージョン1.0では、強力な2つのパターン( ウルフウェーブ と ヘッド・アンド・ショルダーズ )を含んでいます。 このインジケーターは、パターンを描くだけでなく、すぐに使えるエントリーシグナルも提供します: エントリープライス ストップロス(SL) 第1ターゲット(TP1) 第2ターゲット(TP2) 設定は非常にシンプルです。複雑なパラメーターを調整する必要はありません。インストールすれば、すぐに使い始めることができます。 主な特徴 ウルフウェーブとヘッド・アンド・ショルダーズを自動で検出 エントリー、SL、TP1、TP2を明確に表示 完全に客観的な検出(人の判断や介入なし) 最小限のユーザー設定、すぐに使用可能 初期ユーザー向けに特別価格で提供。今後、新しいパターンが追加されるたびに価格は上昇予定 今後の予定 将来的には、ユーザーの提案や市場のニーズに基づき、より多くの
FREE

Stop calculating lot sizes manually. Stop guessing your Risk/Reward ratio. The Risk Reward Tool brings the intuitive, visual trading style of TradingView directly to your MetaTrader 5 charts. It is designed for traders who value speed, precision, and visual clarity. Whether you trade Forex, Indices (DAX, US30), or Commodities (Gold, Oil), this tool handles the math for you. Simply click "Long" or "Short," drag the lines to your levels, and the tool instantly tells you exactly how many lots to t

高度な Gartley パターン認識インジケーターへようこそ このインジケーターは、価格構造の HH と LL、およびフィボナッチ レベルに基づいてガートリー パターンを検出し、特定の Fib レベルが満たされると、インジケーターはチャート上にパターンを表示します。 MT4 バージョン : WH Advanced Gartley Pattern MT4 **このインジケーターは、すべてのパターン認識を含む コンボ Ultimate Harmonic Patterns MT5 の一部です。**
特徴 : 高精度でガートレーパターンを検出するための高度 な アルゴリズム。 非常に 高速 でリソースが 少ない (マシンへの要求が少ない)。 遅延 も再 描画 もありません。 カスタム Fib レベル 調整 (好みの設定に基づいてフィボナッチ レベルを変更できます)。 弱気パターン と 強気 パターンを同時に表示します (弱気または強気設定の複数のパターンを表示する機能付き)。 取引レベルの ラインを表示します (調整可能なストップとターゲット 1 およびターゲット 2 付き)。 任意の
FREE

Technical Analysis Dashboard Pro (TADashboard Pro) – 統一テクニカル分析システム TADashboard Pro は、複数のテクニカル指標と時間枠(タイムフレーム)を単一のビジュアルインターフェースに統合した、高度なテクニカル分析パネルです。 正確性 と 効率性 を求めるトレーダー向けに設計されており、本システムは 8つの異なる時間枠 にわたる 7つのオシレーター と 4つの移動平均線 を同時に分析し、意思決定を簡素化する正規化されたスコアを生成します。 主な特徴 (主なとくちょう): マルチタイムフレーム分析 (Multi-Timeframe Analysis): 統合されたビジュアルセレクターにより、M1、M5、M15、M30、H1、H4、D1、W1の各期間を簡単に監視できます。 高度なスコアリングシステム (Advanced Scoring System): オシレーター、移動平均線、および総合評価の独立したスコア( $-100$ から$+100$まで)。 搭載インジケーター (Included Indicators): RSI
FREE
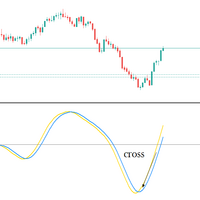
Big promotion on the Robos, Get yours now Robos Indicator The ROBOS indicator is a multi timeframe oscillator that targets the overbought and oversold regions of a price chart, a signal is indicated by the two lines crossing, compatible with all tradable instruments
Latest Release
The latest release is the version 4.0
#What's new in version 4.0 ?
Features
Extreme oversold and overbought levels
ROBOS version 4.0 comes with cool new feature , the ability to target only extrem

AI Adaptive Market Holographic System Indicator Based on Microstructure and Field Theory Abstract: This paper aims to explore the construction principles and implementation mechanism of a novel financial market analysis tool—the Micro gravity regression AIselfregulation system. This system fuses Market Microstructure theory, classical mechanics (elasticity and gravity models), information entropy theory, and adaptive AI algorithms. By aggregating Tick-level data in real-time, physically modeling
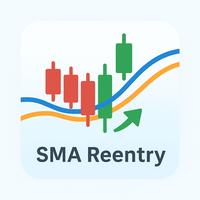
SMA Reentryとは SMA Reentry は、2本の単純移動平均線(SMA)—高速と低速—を利用し、トレンドに沿った再エントリーポイントをシグナルするプロフェッショナル向けインジケーターです。低速SMAで定義されたトレンドの中で、価格が高速SMAを再び上抜け・下抜けしたタイミングを明確に表示します。プルバック(pullback)、ブレイクアウト(breakout)、トレンド回帰シグナルを求めるトレーダーに最適なツールです。 動作原理 高速SMAと低速SMAのクロスにより主要なトレンドを特定 価格が高速SMAを再び上抜け・下抜けした際、矢印でプルバックや再エントリーシグナルを表示し、トレンド継続を確認 期間、ラインや矢印の色、矢印の価格からの距離など、各種入力をカスタマイズ可能 チャート上に2本のSMAを直接表示し、視覚的分析をサポート おすすめユーザー トレンドフォロー戦略を利用したい方、またはプルバック後の最適なエントリーポイントを探す方 ブレイクアウトや再エントリー戦略を利用する方 調整後にトレンド回帰する重要ポイントを見つけたい方 裁量トレーダー、システムトレーダーどち
FREE
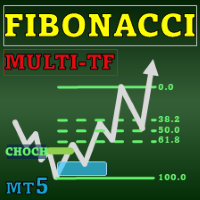
Special offer : ALL TOOLS , just $35 each! New tools will be $30 for the first week or the first 3 purchases ! Trading Tools Channel on MQL5 : Join my MQL5 channel to update the latest news from me Fibonacci Confluence Toolkit Multi-Timeframe は、プロのトレーダー向けに設計された高度な技術的分析ツールで、主要な市場シグナルとパターンを組み合わせて潜在的な価格反転ゾーンを特定するのに役立ちます。タイムフレームセレクターのダッシュボードを通じたマルチタイムフレーム表示機能により、このツールキットは市場のダイナミクスを包括的かつ洞察に満ちた視点で提供し、正確かつタイムリーなトレーディング判断を可能にします。 MT4バージョンの詳細は: Fibonacci Confluence Toolkit MT4 Multi Timefr

自動アンカードVWAPでトレーディングの洞察を解き放つ: 自動アンカードVWAP は、トレーディングの世界でのあなたのガイドとなります。これらの指標は、重要な市場の転換ポイントを特定し、VWAPラインを使用してチャート上に示します。これは、アンカードVWAP戦略を採用するトレーダーにとってのゲームチェンジャーです。 どのように動作するのか? 高値の特定: 現在のキャンドルの最高価格が前のキャンドルの最高価格よりも低い場合、 そして、前の高値がそれより前の高値よりも高い場合、 私たちはピークを特定しました。 この重要なポイントは、これらの三本のローソク足の中央に位置しています。 安値の認識: 現在のキャンドルの最低価格が前のキャンドルの最低価格よりも高い場合、 そして、前の低値がそれより前の低値よりも低い場合、 私たちは底を発見しました。 この底の焦点は、その中央部にあります。 アンカードVWAPのプロット: 各トップとボトムには、対応するVWAPラインがあります。ただし、制約があります:指標の計算要求により、チャート上に同時に表示できるラインは8本だけです。 追加のラインが現れると、古

Auto Optimized RSI は、正確な売買シグナルを提供するために設計された、使いやすいスマートな矢印インジケーターです。過去のデータを使ったトレードシミュレーションに基づき、各通貨ペアや時間足に最適なRSIの買い/売りレベルを自動で見つけ出します。 このインジケーターは、独立したトレードシステムとしても、既存の戦略の一部としても使用できます。特に短期トレーダーにとって便利なツールです。 従来のRSI(70/30など)の固定レベルとは異なり、 Auto Optimized RSI はリアルな価格の動きとバックテスト結果に基づき、ダイナミックにレベルを調整します。勝率、ドローダウン、平均利益/損失といった重要な統計をモニターし、現在の市場に適応して、本当に機能するシグナルを提供します。 RSIが最適化されたレベルをクロスすると、チャート上に買い・売りの矢印が表示され、成功率の高いエントリーポイントを見つけるのに役立ちます。 ご購入後にご連絡いただければ、追加のツールや特別なトレードのヒントを無料でお渡しいたします! 皆様のトレードが成功しますように!

It is a MetaTrader 5 integrated drawing tool inspired on the "Pointofix" software. You can paint, make annotations and drawings on the chart in real time. It works in multiple timeframes, that is, the drawings can be visualized in different timeframes. The drawings are also saved in files and can be restored even on MetaTrader restarting.
Simple and Pratical
Chart Pen is designed as simple, beautiful and innovative way to create and manage all your chart analysis. There is no existing drawing
FREE

マトリックスアローインジケーターマルチタイムフレームパネルMT5 は無料のアドオンであり、マトリックスアローインジケーターMT5の優れた資産です。これは、5つのユーザーがカスタマイズした時間枠と合計16の変更可能なシンボル/機器の現在のマトリックスアローインジケーターMT5信号を示しています。ユーザーは、マトリックスアローインジケーターMT5で構成される10の標準インジケーターのいずれかを有効/無効にするオプションがあります。マトリックスアローインジケーターMT5のように、10の標準インジケーター属性もすべて調整可能です。マトリックスアローインジケーターマルチタイムフレームパネルMT5には、16個の変更可能なシンボルボタンのいずれかをクリックすることで、現在のチャートを変更するオプションもあります。これにより、異なるシンボル間ではるかに高速に作業でき、取引の機会を逃すことはありません。
この無料の マトリックスアローインジケーターマルチタイムフレームパネルMT5 アドオンを使用する場合は、ここでマトリックスアローインジケーターMT5を別途購入する必要があります: https://w
FREE

Introduction
The Bounce Zone indicator is a cutting-edge non-repainting technical tool built to identify key areas on the price chart where market sentiment is likely to cause a significant price reversal. Using advanced algorithms and historical price data analysis, this indicator pinpoints potential bounce zones. Combined with other entry signal, this indicator can help forex traders place the best trades possible
Signal
A possible buy signal is generated when price is in the green zone an
FREE

トレンド,トレンド分析,トレンドフォロー,シグナル,アラート,トレードパネル,ダッシュボード,マーケットコンテキスト,スキャルピング,デイトレード,短期取引,スイングトレード,再描画なし,遅延なし,リスク管理,リスクリワード,サポート,レジスタンス,需給ゾーン,買い圧力,売り圧力,FX,暗号資産
QuantumTrade Panel は、MetaTrader 5 用に開発された高度なインジケーターで、トレンド方向、均衡ゾーン、売買圧力、累積リスク、トレード予測などの重要な情報を、1つの視覚的パネルでリアルタイムに提供します。
本インジケーターは分析および意思決定支援ツールとしてのみ機能し、自動売買は行いません。現在の市場状況を明確かつ客観的に把握することを目的としています。
内部タイムフレームのローソク足の動きに基づいて主要トレンドを表示し、デイトレードに有効な方向性を示します。また、出来高加重の価格均衡である Zero Gamma と、買い・売りの圧力ゾーンを算出します。
Delta Risk は、終値、値幅、ボラティリティ(ATR)、ティックボリュームを用いた行動シ
FREE

Boom and Crash Buy and Sell Trend. Non-repaint. Can be used on all timeframes 1 minute for scalpers. 5 minute to monthly timeframe for swing trading. works on all boom and crash pairs Crash300, Crash500, Crash1000. Boom300, Boom500, Boom1000. Green histogram colour means the trend is up(bullish) Buy signal. Dark orange histogram colour means the trend is down(bearish) Sell signal.

Are you ready to dominate the volatile world of synthetic indices trading? The Golden Boom and Crash Spike Indicator is the revolutionary MT5 indicator designed exclusively for high-stakes traders targeting explosive spikes in Boom 300 and Crash 300 . Optimized for the M1 (one-minute) timeframe , this advanced tool leverages proprietary AI-driven spike detection and precise price action analysis to generate non-repainting buy/sell arrows with unparalleled accuracy. Whether you're s

FOR CRASH 500 ONLY!! MT5
*This is a smooth heiken ashi setup meant to be used on CRASH 500 in combination with other indicators. *You are welcome to test it on other markets aswell. *I will be posting other indicators aswell to help with trading the crash 500 market. *You can use this to help smooth out price if you do struggle with reading the charts as is. * Just note heiken ashi doesnt represent real price action only smoothes it out for ease of read.
FREE
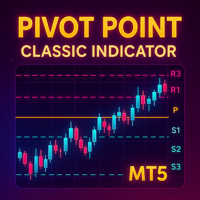
Detailed Description: The Pivot Point Classic Indicator is designed for traders who rely on classic pivot points and midpoints levels for their trading strategies. By automatically calculating and plotting these levels, the indicator provides a clear, visual representation of critical price areas where the market may reverse or break out. Key Features: Automatic Pivot Point Calculations : Automatically calculates pivot points, three support (S1, S2, S3) and resistance (R1, R2, R3) levels bas
FREE
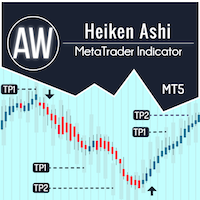
AW Heiken Ashi — トレンドとTPレベルをスマートに表示するインジケーターです。従来のHeiken Ashiをベースにトレーダー向けに改良された高度なインジケーターで、柔軟性と明瞭性が向上しています。標準インジケーターとは異なり、 AW Heiken Ashiは トレンド分析、利益目標の決定、偽シグナルのフィルタリングをサポートし、より確信を持った取引判断を可能にします。 セットアップガイドと手順 - こちら / MT4バージョン - こちら AW 平均足の利点: あらゆる資産と時間枠で機能します。 トレーダーのスタイルに非常に適応性があり、 エントリーレベルとエグジットレベルの動的な計算、 ユーザーフレンドリーなインターフェース+端末への負荷が最小限 本格的な取引戦略として使用するのに適しています。 可能性: 1) 高度なトレンドの視覚化: 現在のトレンドの方向に応じて色付きのHeiken Ashiキャンドルを作成します。これは、市場の状況を便利かつ視覚的に解釈するものです。 2) 柔軟な TakeProfit レベル (TP1 および TP2): 視覚的な目標はチャー

Bar Countdown With Symbol Info is a sleek, non-intrusive Heads-Up Display (HUD) designed to keep essential market data in front of your eyes without cluttering the chart. It combines a smart candle timer with a comprehensive symbol information strip.
Key Features: Smart Candle Countdown: Follow-Price Mode: The timer attaches dynamically to the Bid price line, moving up and down with the market so your eyes never leave the action. Dynamic Coloring: The background changes color in real-time
FREE

Modified oscillator MACD. A classic indicator that combines a trend indicator with an oscillator to detect entry points. Has a multi-timeframe panel and 3 types of notifications
Benefits:
Works on all instruments and timeseries Trend indicator with oscillator for inputs Multi-period panel on all timeframes Pluggable arrows when signals appear Three types of notifications: push, email, alert
MT4 version -> HERE / Our news -> HERE
How the indicator works:
AW Classic MACD - Indicator o
FREE
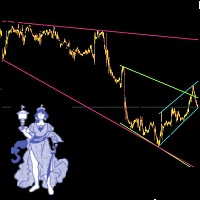
Leave a comment if you would like me to write an EA to trade these trendlines... if enough interest, will write an EA. Automatic Trendlines, updated automatically. To Set up 3 different (or mroe) Trendlines on chart, simply load the indicator as many times and name it differntly.. the example in the picture below is indicator 1 (loaded 1st time): Name: Long, StartBar: 50, BarCount: 500, Color: Pink indicator 2 (loaded 2nd time): Name: Short, StartBar: 20, BarCount: 200, Color: Green indicator 3
FREE

Perfect Entry Price — The Smartest Way to Time Your Trades
Perfect Entry Price is a next-generation indicator designed to help traders identify the most accurate and reliable price levels for market entries. It automatically scans market structure, volume dynamics, and price behavior to locate zones where a reversal or continuation is most likely to happen. The indicator is ideal for traders who want to enter the market exactly when the probability is highest and risk is lowest — whether you a

Strong Bull V7 B&C The ultimate M5 indicator for Boom & Crash indices, providing clear, filtered buy/sell signals to eliminate market noise and enhance your trading precision. Benefit-Focused Master the volatile Boom & Crash markets with Strong Bull V7 B&C . This intelligent indicator provides clear visual arrows and text labels for high-probability setups on the M5 timeframe. Its unique symbol-filtering technology automatically hides conflicting signals (no buys on Crash, no sells on Boom), en

Market Structure CHoCH/BOS Indicator for MT5 Overview
The Market Structure CHoCH/BOS (Fractal) indicator identifies key shifts in market direction based on fractal-based structural analysis. It automatically detects Change of Character (CHoCH) and Break of Structure (BOS) signals, two essential concepts in modern price action and Smart Money trading. How It Works
The indicator analyzes swing highs and lows using a fractal algorithm defined by the Length parameter. When price crosses a previous

ゴールドターゲットは最良のトレンド指標です。 このインジケーターの独自のアルゴリズムは、テクニカル分析と数学的分析の要素を考慮して資産価格の動きを分析し、最も収益性の高いエントリーポイントを決定し、矢印の形でシグナルと価格レベル(買いエントリー/売りエントリー)を発行します。 注文を開きます。 このインジケーターには、ストップロスの価格レベルとテイクプロフィットの 5 つの価格レベルもすぐに表示されます。
注意: このインジケーターは非常に使いやすいです。 ワンクリックでチャートにインジケーターをインストールし、そのシグナルと価格レベルに基づいて取引します。チャート上では、インジケーターが設置されている時間枠に関わらず、4つの時間枠(M30 H1 H4 D1)からトレンド状況が表示されます。
インジケーターの利点:
1. インジケーターは高精度の信号を生成します。 2. インジケーター信号は再描画されません。 価格が各ラインを超えた場合に音声通知(アラート&メッセージ)を搭載しています。 3. どのブローカーの MetaTrader 5 取引プラットフォームでも取引できます

ほとんどの「即時RSIダイバージェンス」シグナルは間違っています RSIダイバージェンスのインジケーターを使用したことがある方は、恐らくこうした経験をしたことがあるでしょう。
リアルタイムでダイバージェンスが表示され、一瞬は正しいように見えますが、
数本のローソク足が経過すると消えてしまいます。
後でチャートを確認すると、過去のシグナルが最初に見たものと一致しなくなっています。 これはユーザーの操作ミスではありません。
論理的な問題です。 確認されていない高値や安値に基づくダイバージェンスは、本質的に不安定です。 過去の履歴を書き換えないRSIダイバージェンスインジケーターを探している場合は、
この説明をぜひ最後までお読みください。 ———————————————————— インジケーター概要 このインジケーターは、RSIダイバージェンスを特定するために設計されており、即時の推測ではなく、確認済みの市場構造に基づいています。 価格とRSIの間の強気・弱気のダイバージェンスを自動的に検出し、RSIウィンドウ内に明確に表示します。 主な特徴: RSIダイバージェンス構造の自動検出 RSIウ
FREE

ADX インジケーターは、トレンドとその強さを判断するために使用されます。価格の方向は +DI と -DI の値で示され、ADX 値はトレンドの強さを示します。+DI が -DI より上であれば、市場は上昇傾向にあり、反対であれば下降傾向にあります。ADX が 20 より下であれば、明確な方向性はありません。インジケーターがこのレベルを突破するとすぐに、中程度の強さのトレンドが始まります。40 を超える値は、強いトレンド (下降トレンドまたは上昇トレンド) を示します。
平均方向性指数 (ADX) インジケーターの複数通貨および複数時間枠の変更。パラメータで任意の通貨と時間枠を指定できます。また、インジケーターは、トレンドの強さのレベルが交差したとき、および +DI と -DI のラインが交差したときに通知を送信できます。ピリオドの付いたセルをクリックすると、このシンボルと期間が開きます。これが MTF スキャナーです。
通貨強度メーター (CSM) と同様に、ダッシュボードは、指定された通貨を含むペア、またはその通貨を基本通貨とするペアを自動的に選択できます。インジケーターは、

This indicator is designed to detect high probability reversal patterns: Double Tops/Bottoms with fake breakouts . Double top and bottom patterns are chart patterns that occur when the trading instrument moves in a similar pattern to the letter "W" (double bottom) or "M" (double top). The patterns usually occur at the end of a trend and are used to signal trend reversals very early. What this indicator detects: This indicator detects a special form of Double Tops and Bottoms, so called Double To

初心者やエキスパートトレーダーに最適なソリューション!
このインジケータは、独自の機能と秘密の数式を組み込んだ、ユニークで高品質かつ手頃な価格のトレーディングツールです。たった1枚のチャートで28の通貨ペアのアラートを表示します。新しいトレンドやスキャルピングチャンスの引き金となるポイントを正確に把握することができるので、あなたのトレードがどのように改善されるか想像してみてください!
新しい基本的なアルゴリズムに基づいて構築されているため、潜在的な取引の特定と確認がより簡単になります。これは、通貨の強さや弱さが加速しているかどうかをグラフィカルに表示し、その加速のスピードを測定するためです。加速すると物事は明らかに速く進みますが、これはFX市場でも同じです。つまり、反対方向に加速している通貨をペアにすれば、利益を生む可能性のある取引を特定することができるのです。
通貨の勢いを示す縦の線と矢印は、あなたの取引の指針となるでしょう。 ダイナミックマーケットフィボナッチ23レベルはアラートトリガーとして使用され、市場の動きに適応します。もしインパルスが黄色のトリガーラインに当たった場

ストキャスティクス オシレーターのマルチ通貨およびマルチタイムフレームの変更。パラメータで任意の通貨とタイムフレームを指定できます。パネルには、シグナルとメイン (ストキャスティクス クロスオーバー) のラインの現在の値と交差点が表示されます。また、インジケーターは、買われすぎレベルと売られすぎレベルを横切るときに通知を送信できます。ピリオド付きのセルをクリックすると、このシンボルとピリオドが開きます。これが MTF スキャナーです。
通貨強度メーター (CSM) と同様に、ダッシュボードは、指定された通貨を含むペア、またはその通貨を基本通貨とするペアを自動的に選択できます。インジケーターは、「ペアのセット」で指定されたすべてのペアで通貨を検索します。他のペアは無視されます。これらのペアに基づいて、この通貨の合計ストキャスティクスが計算されます。そして、その通貨がどれだけ強いか弱いかを確認できます。
ダッシュボードをチャートから非表示にするキーは、デフォルトでは「D」です.
パラメータ %K Period — K ラインの期間。 %D Period — D ラインの期間。 Sl

Simplify your trading experience with Trend Signals Professional indicator. Easy trend recognition. Precise market enter and exit signals. Bollinger Bands trend confirmation support. ATR-based trend confirmation support. (By default this option is OFF to keep interface clean. You can turn it ON in indicator settings.) Easy to spot flat market conditions with ATR-based trend confirmation lines. Highly customizable settings. Fast and responsive. Note: Do not confuse ATR-based trend confirmation
FREE
正確で、時機を得た市場の記入項目のためのスマートな助手。 価格がレベルに達すると、インジケータのビープ音とアラートが鳴ります。 サポートレベルと抵抗レベルを手動で設定するか、アルゴリズムに委ねることができます。 価格がレベルに達する瞬間に、キャンドルパターンが追加的にマークされています。 独特な蝋燭パターンは故障および反動のレベルの古典的なパターンそしてパターンの共生である。 証券取引所での収益性の高い取引の場合、ほとんどの場合、注文は十分ではなく、トレーダーは重要なレベルに近づいたときに価格がどのように動作するかを個人的に見て分析する必要があります。 私はすべてのトレーダーが取引日の初めに重要な目標を設定し、価格がそれらに達した瞬間を逃した状況に遭遇したと思います。 その結果、エントリの瞬間が見逃され、私たちは私たちの計画に完全に従って価格の動きを見て追加の否定的な感情を得ます。 しかし、あなたはそこにいません、そして利益はありません。 喜びと快適さとの貿易! これ以上の終わりに日のためのモニターを見つめていません。 あなたにとって重要であり、あなたのビジネス、他の仕事について行く、
FREE

CATALYST Indicator Version: 1.03
Author: KWAKU BONDZIE GHARTEY
Released: 1st Feb @ 2025 Description The CATALYST Indicator is not just another tool on your chart—it is a revolutionary, next-generation technical analysis system engineered to transform your trading experience. Designed with cutting-edge algorithms and multi-timeframe analysis capabilities, the CATALYST Indicator delivers lightning-fast, pinpoint signals that have redefined performance analysis for traders across all major market
FREE

Market Profile 3 MetaTrader 5 indicator version 4.70— is a classic Market Profile implementation that can show the price density over time, outlining the most important price levels, value area, and control value of a given trading session. This indicator can be attached to timeframes between M1 and D1 and will show the Market Profile for daily, weekly, monthly, or even intraday sessions. Lower timeframes offer higher precision. Higher timeframes are recommended for better visibility. It is als
FREE

OBV MACD
Calculating MACD based on OBV data Features
3 outputs: MACD & Signal & Histogram 4 Colored Histogram Smoothing factor show/hide option for MACD & Signal lines Description
Among the few indicators developed for working with volume data, OBV (On Balance Volume) is the simplest yet most informative one. Its logic is straightforward: when the closing price is above the previous close, today's volume is added to the previous OBV; conversely, when the closing price is below the previous close
FREE

フェニックス・オート・フィボナッチ・モニター (MT5)
MetaTrader 5向けプロフェッショナルなフィボナッチ分析ツール。主要な市場変動を自動検知し、リアルタイムの視覚的ダッシュボードを通じて高度なフィボナッチ・リトレースメント分析を提供します。
概要
フェニックス・オート・フィボナッチ・モニターは、高時間足ピボットとATR検証を用いて主要な市場スイングを自動識別し、インテリジェントなフィボナッチ・リトレースメントレベルをチャート上に直接プロットします。システムは0.0%、23.6%、38.2%、50.0%、61.8%、100.0%の各レベルを継続的に追跡し、新たなスイング形成時に動的に適応します。
各フィボナッチレベルは5つの主要次元で分析されます:正確な価格、強度分類(検証済みタッチ数に基づく「強い/中程度/弱い」)、距離分類(現在の価格に対する「近い/中程度/遠い」)、前回接触からのバー数、役割ステータス(アクティブ、破られた、未テスト)。役割ロジックは価格構造の進化に伴い、レベルが尊重されたか、破られたか、再奪還されたかを自動検知します。
本指標は、全フィボナ
FREE

MonsterDash Harmonics Indicator is a harmonic pattern dashboard. It recognizes all major patterns. MonsterDash is a dashboard that displays all detected patterns for all symbols and (almost) all timeframes in sortable and scrollable format. Users can add their own user defined patterns . MonsterDash can open and update charts with the pattern found.
Settings MonsterDash's default settings are good enough most of the time. Feel free to fine tune them to your needs. The color settings are for tho

いくつかの方法で改良されたスナイパーMACDインジケーター。 追加のフィルタがあります 最大の結果を得るために数回平滑化される 市場および現在の価格条件に関する情報をより正確に表示するために、ボリュームインジケータも追加されます 短期的な期間に設定されているので、m1からm30までの期間に指標を使用することをお勧めします eur.usd - eur.jpyのような非常に揮発性の高い通貨ペアで取引することをお勧めします あなたの注意と落札していただきありがとうございます。 ----------------------------------------------------------------------------------------------------------------------------- いくつかの方法で改良されたスナイパーMACDインジケーター。 追加のフィルタがあります 最大の結果を得るために数回平滑化される 市場および現在の価格条件に関する情報をより正確に表示するために、ボリュームインジケータも追加されます 短期的な期間に設定されているので、m1から
FREE

Smart Elliott Wave is a sophisticated technical indicator that automatically detects Elliott Wave patterns with complete 5-wave impulse structures (1-2-3-4-5) and validates ABC corrective patterns for high-probability trading setups. This indicator eliminates manual wave counting and provides clear visual signals with confidence scoring. Key Features Automatic Wave Detection Detects complete Elliott Wave 5-wave impulse patterns automatically Identifies ABC corrective patterns for optimal entry p
FREE
** All Symbols x All Time frames scan just by pressing scanner button ** After 18 years of experience in the markets and programming, Winner indicator is ready. I would like to share with you! *** Contact me to send you " Trend Finder indicator " free, instruction and add you in "M1 Signal Scanner group" for sharing or seeing experiences with other users. Introduction: M1 Signal Scanner is the indicator designed scalping M1 time frame to detect Small trend switching in the direction

バージョン1.3の詳細については、「What's New」をご覧ください。
//+---------------------------------------------------------------------------------------------------------------+ このインジケーターは、市場の重要なスイングポイントを特定するために、価格動向とボリュームの動きを分析するツールとして設計されています。主に日中取引で効果を発揮しますが、他の取引時間でも自由に試すことができます。 概要 このインジケーターは、価格の高値や安値パターンを特定し、大きな価格変動の前兆となる重要なポイントを見つけることを目指しています。 機能 ベアリッシュキャンドルパターン 高値が設定可能な範囲内の一定数(デフォルトでは前5本、後3本)のキャンドルより高い時に特定されます。 特定するためには、さらにユーザーが調整可能な数の減少ボリュームバーが事前に存在する必要があります。 ブルリッシュキャンドルパターン 安値が設定可能な範囲内の一定数(デフォルトでは前5本、後3本)のキャ
FREE

DRX Smart Risk | プロフェッショナル・トレードプランナー 推測はやめましょう。正確な計画を始めましょう。 リスクリワード比率(R:R)やロットサイズの手動計算は時間がかかり、ミスの元です。 DRX Smart Risk は、TradingViewのようなプロフェッショナルなチャートプラットフォームの直感的なワークフローを、MetaTrader 5にもたらします。 問題点: MT5の標準ラインは扱いにくく、時間足を変更すると消えてしまい、R:Rを頭の中で計算しなければなりません。 解決策: DRX Smart Risk はハイエンドな視覚ツールです。チャート上にインタラクティブなリスク/リワードボックスを描画し、 すべて をリアルタイムで計算します。ラインをドラッグするだけで、リスク金額と潜在的な利益が正確にわかります。 主な機能: 「スマートドラッグ」テクノロジー: ストレスのない操作感。独自の「アンカーロジック」により、TPボックスとSLボックスが同期して動きます。 ワンクリック・スイッチ: エントリーライン上のスマートボタンで、**LONG(買い) から SH
FREE

This indicator allows to display Renko charts in the indicator window. Renko charts show only price movements that are bigger than the specified box size. It helps to eliminate noise and allows to focus on main trends.
Time is not a factor here. Only price movements are taken into account. That's why Renko chart is not synchronized with the main chart it is attached to. Indicator works in two modes: CLOSE - only close prices are taken into account while building the chart HIGH_LOW - only high/l
FREE

- What does this do?
This indicator draws the standard EMAs used in Steve Mauro's BTMM (Beat the Market Maker) method:
• The 5 EMA (Mustard)
• The 13 EMA (Ketchup)
• The 50 EMA (Water)
• The 200 EMA (Mayo)
• The 800 EMA (Blueberry)
- What improvement does this indicator offer?
The original version provided by Steve Mauro was for MetaTrader4. This is for MetaTrader5.
The original version provided by Steve Mauro misplaced the EMA-crossover arrows. This indicator handle

Smart SR Levels Support and Resistance - Professional Strength-Based Support & Resistance Indicator MT5
Key Features: • Automatic detection of significant Support and Resistance levels • Line thickness based on level strength (number of touches + volume factor) • Custom colours for Support and Resistance • Multi-timeframe support • Clean background lines (no overlap with candles) • Labels showing S/R type and strength value
Perfect for price action traders, supply-demand zones, and institutio
FREE
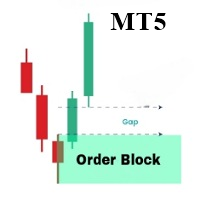
OrderBlock Analyzer は、MetaTrader 5 (MT5) 用にカスタマイズされたインジケーターで、価格チャート上のオーダーブロック(Order Blocks)を検出し、ハイライトします。このインジケーターは、市場の主要な構造を特定するのに役立ち、反転や継続の可能性のある領域を示します。OrderBlock Analyzer は、マーケットの動きに基づいて、自動的にオーダーブロックを描画し、上昇と下降のブロックを異なる色で区別します。 主な機能: 上昇および下降オーダーブロックの検出とマーキング。 グラフ上でリアルタイムにオーダーブロックを更新し、トレーディングのチャンスを迅速に特定します。 オーダーブロックの色、ボーダーライン、ラインスタイルのカスタマイズが可能です。 ボーダーラインの色と厚さの柔軟な設定。 このインジケーターは、トレンドや反転に基づいたトレーディング戦略を使用するすべてのタイプのトレーダーに最適です。
KT Trend Reversal Probability は、改良された RSI ベースのアルゴリズムを使用して、トレンド反転の確率をリアルタイムで計算します。この確率は明確なパーセンテージで表示され、現在のトレンドが弱まっているのか、それとも新たなトレンドが形成されつつあるのかを判断する助けになります。 エントリータイミングの計画や、エグジットの最適化など、どの場面でもこのインジケーターは、データに基づいた優位性をあなたのトレーディングに提供します。
特徴
振動系に直接、明確な反転確率(%)を表示し、トレーダーが事前にトレンドの変化を予測するのに役立ちます。 高速と低速の RSI シグナルを組み合わせた独自のオシレーターを採用し、最小限のラグで反転の可能性を検出します。 直感的なカラーフィルター(グラデーション)を使って反転の強弱を視覚的に表現し、一目で状況を把握できます。 反転の確率が重要な水準に達したとき、または新しいトレンドが始まる兆候が現れたときにアラートを送信し、大きな市場変化を見逃さないようサポートします。 オシレーターの期間や確率のしきい値など、すべてを自由にカス
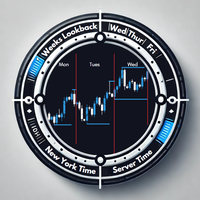
Overview The Daily Session Separator indicator is a powerful tool designed to enhance your trading experience by clearly marking daily trading sessions on your chart. It helps traders visualize daily boundaries, session highs and lows, and essential day-specific data to make informed decisions. With its seamless integration into any chart and dynamic adaptability, this indicator is a must-have for traders who rely on precision and clarity. Key Features Daily Session Separators Automatically adds
FREE
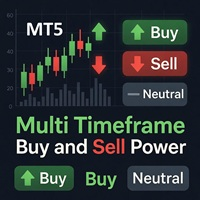
Multi Timeframe Buy and Sell Power
The Multi Timeframe Buy and Sell Power indicator for MetaTrader 5 is a versatile tool designed to provide traders with a clear visual representation of market pressure across nine standard timeframes, from M1 to MN1. By aggregating buy and sell strength percentages derived from recent price action and tick volume, it helps identify potential trends, reversals, and neutral conditions in real-time. The indicator displays this information in a compact dashboard
FREE

Azimuthは、完全な市場サイクル分析を一つのプロフェッショナルスイートで求める構造重視のトレーダーのために作られました。
ほとんどのZigZagインジケーターが主要なスイングのみを表示する中、Azimuthは4つのネストされたスイングレベル(L1/L2/L3/L4)を同時に表示します — 早期サイクルエントリー、後期サイクル警告、完全な構造的コンテキストを提供。スイングアンカーVWAP(任意の日次リセットではなく)、MTF ZigZagスイング、自動ABCパターン検出と組み合わせることで、チャートホッピングなしで機関レベルの構造分析が可能です。
主要機能
4レベルZigZagシステム - レベル1-4同時レンダリング(マイナーからマクロスイング) - カスタマイズ可能な期間(デフォルト:9/36/144/576 — フィボナッチ整列) - 即座のパターン認識のためのカラーコード可視化
スイングアンカーVWAP - 主要なスイング高値/安値にアンカーされたAVWAP L3 - デイリーVWAP参照ライン(機関ベンチマーク) - 方向性ロジック(上昇トレンドでサポート、下降
FREE
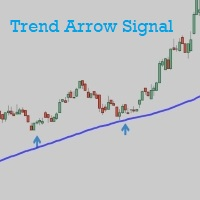
Trend Arrow Signal gives buy/sell signals and alerts with up and down arrow at potential reversal of a pullback or a trend continuation pattern. As the name indicated, this is an indicator which gives signals based on trend => It works best in trend market with the principle is to ride on the trend not trade against the trend. The main trend is determined by EMA 50 and can be changed manually to suit your preference. Trend arrow signal can work on all time frames. It gives signal at close of th
FREE
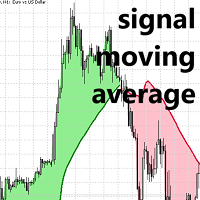
MT5向けシグナル移動平均 Lux Algo
移動平均クロスオーバーシステムにおけるシグナルラインの使用に特化した、独自の移動平均インジケーターをご紹介します。この高度なツールは、レンジ相場では価格から乖離し、トレンド相場では標準移動平均線を忠実に反映することで、他のツールとは一線を画しています。この特性により、トレーダーは市場の変動による不要なノイズや過剰な取引を回避できます。
移動平均線は、レンジ相場では価格から乖離し、トレンド相場では通常の移動平均線の値に達します。
移動平均クロスオーバー戦略では、多くの場合「シグナル」ラインが用いられます。シグナルラインとは、全体的なトレンドを判断するために使用される低速移動平均線です。このシグナルラインは、高速移動平均線と組み合わせることで、通常価格とシグナルラインのクロスによって生じる可能性のある急激な変動を抑制します。
提案されたインジケーターは、より多くのレンジ相場で価格から乖離することで価格のクロスを回避し、価格とシグナルラインのクロス数を効果的に削減します。
価格とシグナルラインの間の領域の色は、シグナルラインに対する価
FREE

Weis Wave Scouter Basic は、MetaTrader 5 用に設計された当社の有名なインジケーターの基本バージョンであり、Wyckoff 手法と VSA(ボリュームスプレッド分析)の概念を手軽かつ効率的に探求したいトレーダー向けに設計されています。ボリュームウェーブの読み取りに基づいており、市場の動きを明確に特定でき、リチャード・ワイコフが教えた「労力と結果」「需給」の原則に焦点を当てています。 Weis Wave Scouter Basic を使用すると、標準カラー(Classic)テーマの直感的なヒストグラムで上昇波と下降波を視覚化でき、トレンドや反転を簡単に解釈できます。Brick Size や Volume Scale Factor などの基本的な調整が可能で、ティックボリュームまたは実際のボリュームを選択できるため、FX、株式、暗号資産などさまざまな市場で柔軟に使用できます。初心者やシンプルなツールを求めるトレーダーに最適な Weis Wave Scouter Basic は、Wyckoff と VSA の技術を取引に活かすための理想的な出発点です。 We
FREE
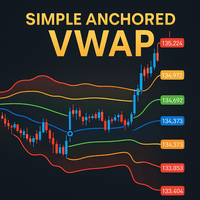
Simple Anchored VWAP is a lightweight yet powerful tool designed for traders who want precise volume-weighted levels without complexity.
This indicator lets you anchor VWAP from any point on the chart and instantly see how price reacts around institutional volume zones. MT4 Version - https://www.mql5.com/en/market/product/155320
Join To Learn Market Depth - https://www.mql5.com/en/channels/suvashishfx Using VWAP bands and dynamic levels, the tool helps you understand where real buying and s
FREE

After 18 years of experience in the markets and programming, Winner indicator is ready. I would like to share with you! *** Contact me to send you instruction and add you in group for sharing or seeing experiences with other users. Largest Market Cap belongs to Gold, Bitcoin and US30, So they have many traders and great for use in scalping. Gold and Bitcoin Assistant will earn profit on M5 time frames in Gold, Bitcoin and US30. Easy strategy comes from long years experiences, It is a piece of c

High Low Today (MT5) is a free, easy-to-use MetaTrader 5 indicator that displays the current day’s High and Low price levels on your chart. It even offers optional push notifications to alert you when the price touches or breaks these key levels. With a clean and minimalist design, it provides valuable intraday insights without cluttering your chart. Marks the current day’s High and Low on the chart (key intraday support/resistance levels) Clean, lightweight, and unobtrusive – only the essenti
FREE

98%の精度を誇るトレードシグナル 正確なエントリー、明確なエグジット | マルチタイムフレーム | 全市場対応
3つの簡単なステップで仕組みを確認 1️⃣ エントリー(買い/売りルール) シグナル発動:2本の線(X)がカラーゾーン(赤:買い、青:売り)の外側を横切る。
確認:価格ローソク足がクロスゾーンにタッチ(クロスゾーン中、またはクロスゾーンから1~5本以内)
代替エントリー(ノータッチ):
売りシグナル(青ゾーン):価格がクロスゾーンを上抜ける(ノータッチ)。
買いシグナル(赤ゾーン):価格がクロスゾーンを下抜ける(ノータッチ)。
2️⃣ エグジット(利益確定) 決済シグナル:黄色の線が現在のゾーンの外側をカーブ → エグジット。
3️⃣ リスク管理 ロットサイズ:口座残高1,000ドルあたり0.01ロット。
取引の分散:主要通貨ペア(例:USDJPY、EURGBP、GOLD)に分散投資。
このインジケーターがトレーダーに人気の理由 98% の精度 – 流動性と移動平均線クロスに基づく信頼性の高いシグナル。 あらゆる通貨ペア、コモディティ、時間足(1

The indicator is stable on noise fluctuations in price and quickly reacts to the trend. It is based on an algorithm from a system of hyperbolic functions that allows you to aggressively smooth the flat with minimal lag on the trend. It can be applied directly to the price chart, to itself, or to other indicators in order to eliminate false signals. The main purpose of the indicator is to smooth out small sawtooth price movements as much as possible. The higher the Hyperbolic parameter, the stron
MetaTraderマーケットは、他に類のない自動売買ロボットやテクニカル指標の販売場所です。
MQL5.community ユーザーメモを読んで、取引シグナルのコピー、フリーランサーによるカスタムアプリの開発、支払いシステムを経由した自動支払い、MQL5Cloud Networkなど、当社がトレーダーに対して提供するユニークなサービスについて詳しくご覧ください。
取引の機会を逃しています。
- 無料取引アプリ
- 8千を超えるシグナルをコピー
- 金融ニュースで金融マーケットを探索
新規登録
ログイン