Regardez les tutoriels vidéo de Market sur YouTube
Comment acheter un robot de trading ou un indicateur
Exécutez votre EA sur
hébergement virtuel
hébergement virtuel
Test un indicateur/robot de trading avant d'acheter
Vous voulez gagner de l'argent sur Market ?
Comment présenter un produit pour qu'il se vende bien
Indicateurs techniques pour MetaTrader 5 - 7

Le Matrix Arrow Indicator Multi Timeframe Panel MT5 est un complément gratuit et un atout majeur pour votre Matrix Arrow Indicator MT5 . Il montre le signal Matrix Arrow Indicator MT5 actuel pour 5 périodes personnalisées par l'utilisateur et pour 16 symboles/instruments modifiables au total. L'utilisateur a la possibilité d'activer/désactiver l'un des 10 indicateurs standard dont se compose l' Indicateur de Flèche Matricielle MT5 . Tous les 10 attributs d'indicateurs standard sont également ré
FREE
Haven Average Daily Range est un indicateur puissant et flexible qui calcule et affiche la fourchette quotidienne moyenne (ADR), offrant aux traders un outil indispensable pour évaluer la volatilité et les mouvements de prix quotidiens potentiels. Avec la dernière mise à jour, l'indicateur est devenu encore plus fonctionnel, ajoutant la capacité d'analyser les données historiques directement sur le graphique ! Découvrez mes autres produits -> ICI Caractéristiques Clés : Niveaux ADR Historiques
FREE
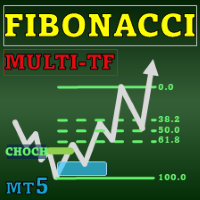
Special offer : ALL TOOLS , just $35 each! New tools will be $30 for the first week or the first 3 purchases ! Trading Tools Channel on MQL5 : Join my MQL5 channel to update the latest news from me Le Fibonacci Confluence Toolkit Multi-Timeframe est un outil avancé d'analyse technique conçu pour les traders professionnels, aidant à identifier les zones potentielles de renversement des prix en combinant des signaux et des modèles clés du marché. Avec des capacités d'affichage multi-

Révélez les Astuces de Trading avec les VWAPs Ancrés Automatiques : Les VWAPs Ancrés Automatiques sont vos compagnons de trading. Ces indicateurs repèrent les points de retournement clés du marché et les illustrent sur votre graphique à l'aide des lignes VWAP. Ceci est une révolution pour les traders qui utilisent des stratégies basées sur les VWAP ancrés. Comment Ça Marche ? Identification des Points Hauts : Si le prix le plus élevé de la bougie actuelle est inférieur au prix le plus élevé de l

Auto Optimized RSI est un indicateur fléché intelligent et facile à utiliser, conçu pour fournir des signaux d’achat et de vente précis. Il utilise des simulations de trading sur des données historiques pour déterminer automatiquement les niveaux RSI les plus efficaces pour chaque instrument et période. Cet indicateur peut être utilisé comme un système de trading autonome ou intégré dans votre stratégie existante, et il est particulièrement utile pour les traders à court terme. Contrairement a

CATALYST Indicator Version: 1.03
Author: KWAKU BONDZIE GHARTEY
Released: 1st Feb @ 2025 Description The CATALYST Indicator is not just another tool on your chart—it is a revolutionary, next-generation technical analysis system engineered to transform your trading experience. Designed with cutting-edge algorithms and multi-timeframe analysis capabilities, the CATALYST Indicator delivers lightning-fast, pinpoint signals that have redefined performance analysis for traders across all major market
FREE
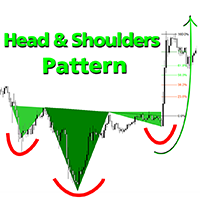
Prix de bienvenue : 35 $ Le modèle Tête et Épaules est idéal pour les traders recherchant une reconnaissance fiable des modèles, incluant les formations haussières et baissières de Tête et Épaules, avec des niveaux de Fibonacci intégrés, une détection de cassure de la ligne de cou et des techniques de prédiction précoce. Un outil puissant pour MT5 pour ceux qui valorisent l'analyse technique et la précision dans l'identification des structures de graphique et des renversements de tendance. M

Boom and Crash Buy and Sell Trend. Non-repaint. Can be used on all timeframes 1 minute for scalpers. 5 minute to monthly timeframe for swing trading. works on all boom and crash pairs Crash300, Crash500, Crash1000. Boom300, Boom500, Boom1000. Green histogram colour means the trend is up(bullish) Buy signal. Dark orange histogram colour means the trend is down(bearish) Sell signal.

Smart Money Breakout Channels Indicator
The Smart Money Breakout Channels indicator is a powerful technical analysis tool designed to identify potential breakout opportunities in financial markets by detecting consolidation channels based on price volatility. Built for MetaTrader 5 (MT5), it overlays dynamic channels on the price chart, highlighting areas of low volatility that often precede significant price movements. This indicator is inspired by smart money concepts, focusing on institution
FREE
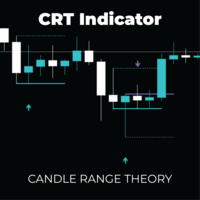
CRT Pro: Multi-Timeframe Reversal System Unlock high-probability reversal setups with the precision of Candle Range Theory (CRT) combined with Advanced DSL Trend Analysis. The CRT Multi-Timeframe System is not just a signal indicator; it is a complete trading framework designed to identify "Liquidity Sweeps" and false breakouts—the exact moments institutional money enters the market. By filtering these powerful reversal patterns through a customizable Multi-Timeframe (MTF) engine and DSL (Di

MATADOR GOLD – XAUUSD MT5 M5 Timeframe Scalp Signals MATADOR GOLD is a professional signal indicator designed for XAUUSD (Gold) scalping on the M5 timeframe , with optional higher-timeframe confirmation. This indicator does not open or manage trades automatically .
It provides structured buy and sell signals, intelligent filtering, and alerts, allowing traders to execute trades using their own strategy and risk management rules. Core Concept (Multi-Concept Architecture) MATADOR GOLD is built

It is a MetaTrader 5 integrated drawing tool inspired on the "Pointofix" software. You can paint, make annotations and drawings on the chart in real time. It works in multiple timeframes, that is, the drawings can be visualized in different timeframes. The drawings are also saved in files and can be restored even on MetaTrader restarting.
Simple and Pratical
Chart Pen is designed as simple, beautiful and innovative way to create and manage all your chart analysis. There is no existing drawing
FREE
Day Direction Scanner est un indicateur qui utilise la direction du chandelier actuel sur les périodes de 1 jour, 4 heures, 1 heure, 15 minutes et 5 minutes pour déterminer la direction du marché. Lorsque tous les chandeliers convergent dans une même direction, l'indicateur indique si la journée est haussière ou baissière, ou s'il n'y a pas de direction claire. Il est utile pour se faire une idée facile de la direction du marché au cours de la journée.
Fonctionnalités : - Fonctionne sur tout
FREE

Azimuth has been created for structure-first traders looking for complete market cycle analysis in one professional suite.
While most ZigZag indicators show only major swings, Azimuth reveals 4 nested swing levels simultaneously (L1/L2/L3/L4) — giving you early-cycle entries, late-cycle warnings, and full structural context. Combined with swing-anchored VWAP (not arbitrary daily resets), MTF zigzag swings, and automated ABC pattern detection, you get institutional-level structure analysis with
FREE
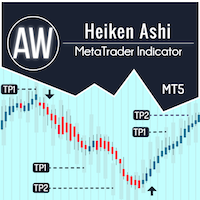
AW Heiken Ashi — Indicateur intelligent de tendance et de niveaux de TP. Indicateur avancé basé sur le Heiken Ashi classique, adapté aux traders, offrant plus de flexibilité et de clarté. Contrairement à l'indicateur standard, AW Heiken Ashi permet d'analyser la tendance, de déterminer les objectifs de profit et de filtrer les faux signaux, pour des décisions de trading plus sûres. Guide d'installation et instructions - Ici / Version MT4 - Ici Avantages de AW Heiken Ashi : Fonctionne sur tous l
Haven Trend Tracker PRO - Votre navigateur dans le monde des tendances Présentation de Haven Trend Tracker PRO – un puissant indicateur multi-temporels créé pour les traders qui souhaitent trader en harmonie avec le marché. Son objectif principal est de vous débarrasser de vos doutes en affichant la direction de la tendance simultanément sur votre période de travail (LTF) et sur une période supérieure (HTF). Mes autres produits -> ICI . Le trading de tendance est la stratégie la plus fiabl

The "Sniper MACD" indicator is an improved version of the classic MACD, designed to enhance trading efficiency. It features additional filtering and multiple smoothing methods, allowing for more accurate signals. Features: Additional Filtering: Improves signal quality, reducing the likelihood of false triggers and increasing forecast accuracy. Multiple Smoothing: Reduces market noise, providing more reliable signals. Volume Integration: The built-in volume indicator helps assess market conditio
FREE

Discover the MSG Method: Master the Major Session Gap for Consistent Forex Profits Unlock the power of the MSG Method – our proprietary Major Session Gap strategy designed to capture high-probability trades during key market session transitions. Developed by the T1 FX Team, this innovative approach leverages algorithmic precision to identify and exploit price gaps between major trading sessions (London, New York, and Tokyo). Why Choose the MSG Method? High-Probability Setups : Focuses on session

Voir "Nouveautés" pour un récapitulatif des nouvelles fonctions. La version 1.4 n'était qu'un nettoyage, rien de spécial.
J'ai créé cela car j'avais besoin d'un indicateur fractal personnalisable. Il vérifie également la diminution des volumes pour obtenir une forme de confirmation. Détails ci-dessous : Vue d'ensemble Cet indicateur est conçu pour aider à identifier les points de retournement clés sur le marché en analysant l'action des prix et la dynamique des volumes. Caractéristiques La strat
FREE

Description générale Cet indicateur est une version améliorée du Canal Donchian classique, enrichie de fonctionnalités pratiques pour le trading réel.
En plus des trois lignes standard (supérieure, inférieure et ligne médiane), le système détecte les cassures et les affiche visuellement avec des flèches sur le graphique, en montrant uniquement la ligne opposée à la direction actuelle de la tendance pour une lecture plus claire. L’indicateur comprend : Signaux visuels : flèches colorées lors des
FREE

High Low Today (MT5) is a free, easy-to-use MetaTrader 5 indicator that displays the current day’s High and Low price levels on your chart. It even offers optional push notifications to alert you when the price touches or breaks these key levels. With a clean and minimalist design, it provides valuable intraday insights without cluttering your chart. Marks the current day’s High and Low on the chart (key intraday support/resistance levels) Clean, lightweight, and unobtrusive – only the essenti
FREE

Perfect Entry Price — The Smartest Way to Time Your Trades
Perfect Entry Price is a next-generation indicator designed to help traders identify the most accurate and reliable price levels for market entries. It automatically scans market structure, volume dynamics, and price behavior to locate zones where a reversal or continuation is most likely to happen. The indicator is ideal for traders who want to enter the market exactly when the probability is highest and risk is lowest — whether you a

Strong Bull V7 B&C The ultimate M5 indicator for Boom & Crash indices, providing clear, filtered buy/sell signals to eliminate market noise and enhance your trading precision. Benefit-Focused Master the volatile Boom & Crash markets with Strong Bull V7 B&C . This intelligent indicator provides clear visual arrows and text labels for high-probability setups on the M5 timeframe. Its unique symbol-filtering technology automatically hides conflicting signals (no buys on Crash, no sells on Boom), en

Market Structure CHoCH/BOS Indicator for MT5 Overview
The Market Structure CHoCH/BOS (Fractal) indicator identifies key shifts in market direction based on fractal-based structural analysis. It automatically detects Change of Character (CHoCH) and Break of Structure (BOS) signals, two essential concepts in modern price action and Smart Money trading. How It Works
The indicator analyzes swing highs and lows using a fractal algorithm defined by the Length parameter. When price crosses a previous

Indicateur de Pivot Points qui calcule des niveaux essentiels de support et de résistance pour les day traders et les swing traders. Idéal pour identifier les points de retournement, définir des objectifs et gérer le risque sur n’importe quel timeframe. Pour les Day Traders
Identifie les niveaux clés pour les entrées et sorties Définit les niveaux de stop-loss et d’objectifs Reconnaît les retournements intrajournaliers potentiels Pour les Swing Traders
Identifie les zones de support et de rési
FREE

Les Gold Targets sont le meilleur indicateur de tendance. L'algorithme unique de l'indicateur analyse l'évolution du prix de l'actif, en tenant compte des facteurs d'analyse technique et mathématique, détermine les points d'entrée les plus rentables, émet un signal sous la forme d'une flèche et le niveau des prix (ACHETER Entrée / VENDRE Entrée) pour ouvrir une commande. L'indicateur affiche également immédiatement le niveau de prix pour le Stop Loss et cinq niveaux de prix pour le Take Profit.
UZFX {SSS} Scalping Smart Signals MT5 est un indicateur de trading haute performance sans repeinture conçu pour les scalpers, les day traders et les swing traders qui exigent des signaux précis et en temps réel sur des marchés en évolution rapide. Développé par (UZFX-LABS), cet indicateur combine l'analyse de l'action des prix, la confirmation des tendances et un filtrage intelligent pour générer des signaux d'achat et de vente à haute probabilité sur toutes les paires de devises et toutes les p

Smart Elliott Wave is a sophisticated technical indicator that automatically detects Elliott Wave patterns with complete 5-wave impulse structures (1-2-3-4-5) and validates ABC corrective patterns for high-probability trading setups. This indicator eliminates manual wave counting and provides clear visual signals with confidence scoring. Key Features Automatic Wave Detection Detects complete Elliott Wave 5-wave impulse patterns automatically Identifies ABC corrective patterns for optimal entry p
FREE

Introduction
The Bounce Zone indicator is a cutting-edge non-repainting technical tool built to identify key areas on the price chart where market sentiment is likely to cause a significant price reversal. Using advanced algorithms and historical price data analysis, this indicator pinpoints potential bounce zones. Combined with other entry signal, this indicator can help forex traders place the best trades possible
Signal
A possible buy signal is generated when price is in the green zone an
FREE

L'indicateur ADX est utilisé pour déterminer la tendance et sa force. La direction du prix est indiquée par les valeurs +DI et -DI, et la valeur ADX montre la force de la tendance. Si +DI est supérieur à -DI, alors le marché est dans une tendance haussière, si au contraire, c'est une tendance baissière. Si l’ADX est inférieur à 20, il n’y a pas de direction définie. Dès que l'indicateur dépasse ce niveau, une tendance de force moyenne commence. Les valeurs supérieures à 40 indiquent une ten

La meilleure solution pour tout débutant ou Expert Trader !
Cet indicateur est un outil de trading unique, de haute qualité et abordable car nous avons incorporé un certain nombre de caractéristiques exclusives et une formule secrète. Avec seulement UN graphique, il donne des alertes pour les 28 paires de devises. Imaginez comment votre trading s'améliorera parce que vous serez capable de repérer le point de déclenchement exact d'une nouvelle tendance ou d'une opportunité de scalping !
Constr

This is the Cumulative Volume Delta (CVD) , it's an indicator that calculates the long and short volumes plotting it then as a line on the chart, the most efficient way to use this indicator is by comparing the CVD line to the current chart and looking at the Divergence beetween the two of them, so that you can identify fake-outs and liquidty sweeps. for example in the picture that i put below you can see that the price has made a lower low but the CVD didn't, that means the volumes didn't suppo
FREE

Le Weis Wave Scouter Basic est la version essentielle de notre célèbre indicateur pour MetaTrader 5, conçu pour les traders souhaitant explorer les concepts de la méthode Wyckoff et de l'analyse VSA (Volume Spread Analysis) de manière accessible et efficace. Basé sur la lecture des vagues de volume, cet indicateur simplifié permet d'identifier clairement les mouvements du marché, en se concentrant sur les principes d'effort vs résultat et d'offre et demande, tels qu'enseignés par Richard Wyckof
FREE

Stochastic MTF Dashboard Le Stochastic MTF Dashboard est une solution visuelle conçue pour optimiser votre efficacité. Il vous permet de surveiller l'état de l'oscillateur stochastique sur jusqu'à 6 unités de temps différentes simultanément, le tout sans quitter votre graphique actuel. Son objectif est d'éliminer toute confusion et de vous offrir une lecture instantanée de la force du marché : Rouge : Zone de Surachat : Épuisement potentiel du prix (Ventes). Vert : Zone de Survente : Récupératio
FREE
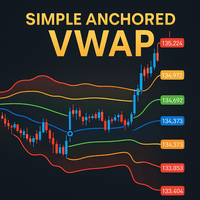
Simple Anchored VWAP is a lightweight yet powerful tool designed for traders who want precise volume-weighted levels without complexity.
This indicator lets you anchor VWAP from any point on the chart and instantly see how price reacts around institutional volume zones. MT4 Version - https://www.mql5.com/en/market/product/155320
Join To Learn Market Depth - https://www.mql5.com/en/channels/suvashishfx Using VWAP bands and dynamic levels, the tool helps you understand where real buying and s
FREE

This indicator displays Pivot-Lines, preday high and low, preday close and the minimum and maximum of the previous hour. You just have to put this single indicator to the chart to have all these important lines, no need to setup many single indicators.
Why certain lines are important Preday high and low : These are watched by traders who trade in a daily chart. Very often, if price climbs over or falls under a preday low/high there is an acceleration in buying/selling. It is a breakout out of a
FREE
** All Symbols x All Time frames scan just by pressing scanner button ** After 18 years of experience in the markets and programming, Winner indicator is ready. I would like to share with you! *** Contact me to send you " Trend Finder indicator " free, instruction and add you in "M1 Signal Scanner group" for sharing or seeing experiences with other users. Introduction: M1 Signal Scanner is the indicator designed scalping M1 time frame to detect Small trend switching in the direction

### Best Order Block Detector Indicator for MT5
The Order Block Detector is a technical analysis indicator designed for MetaTrader 5 (MT5). It identifies potential order blocks (OBs) in the market, which are key price levels where significant buying or selling activity has occurred, often acting as support or resistance zones. These blocks are detected based on volume pivots and market structure swings, helping traders spot areas of institutional interest for potential reversals or continuation
FREE

The Volume Delta Indicator is a technical analysis tool that combines volume analysis with price action to identify potential trading opportunities. This indicator analyzes the difference between buying and selling pressure through candle structure analysis. Key Features Volume Delta Calculation : Measures buy/sell volume difference using candle structure analysis EMA Smoothing : Applies exponential moving average to smooth volume data Breakout Detection : Identifies price breakouts with volume
FREE
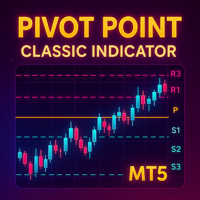
Detailed Description: The Pivot Point Classic Indicator is designed for traders who rely on classic pivot points and midpoints levels for their trading strategies. By automatically calculating and plotting these levels, the indicator provides a clear, visual representation of critical price areas where the market may reverse or break out. Key Features: Automatic Pivot Point Calculations : Automatically calculates pivot points, three support (S1, S2, S3) and resistance (R1, R2, R3) levels bas
FREE

Simplify your trading experience with Trend Signals Professional indicator. Easy trend recognition. Precise market enter and exit signals. Bollinger Bands trend confirmation support. ATR-based trend confirmation support. (By default this option is OFF to keep interface clean. You can turn it ON in indicator settings.) Easy to spot flat market conditions with ATR-based trend confirmation lines. Highly customizable settings. Fast and responsive. Note: Do not confuse ATR-based trend confirmation
FREE

- What does this do?
This indicator draws the standard EMAs used in Steve Mauro's BTMM (Beat the Market Maker) method:
• The 5 EMA (Mustard)
• The 13 EMA (Ketchup)
• The 50 EMA (Water)
• The 200 EMA (Mayo)
• The 800 EMA (Blueberry)
- What improvement does this indicator offer?
The original version provided by Steve Mauro was for MetaTrader4. This is for MetaTrader5.
The original version provided by Steve Mauro misplaced the EMA-crossover arrows. This indicator handle
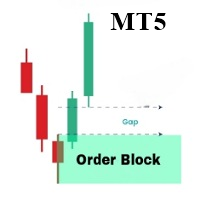
L'OrderBlock Analyzer est un indicateur personnalisé pour MetaTrader 5 (MT5) conçu pour détecter et mettre en évidence automatiquement les Order Blocks sur les graphiques de prix. Cet outil est idéal pour les traders qui utilisent les Order Blocks dans leur stratégie de trading, offrant une visualisation claire et précise de ces zones cruciales. Fonctionnalités principales : Détection des Order Blocks : Identifie automatiquement les Order Blocks haussiers et baissiers basés sur les configurati
Le KT Trend Reversal Probability calcule en temps réel la probabilité d’un retournement de tendance en utilisant un algorithme RSI perfectionné. Affichée sous forme de pourcentage clair, cette probabilité vous aide à déterminer si une tendance en cours perd de la force ou si une nouvelle est sur le point de se former. Que vous planifiiez vos entrées ou que vous resserriez vos sorties, cet indicateur apporte un avantage fondé sur des données concrètes à vos décisions de trading.
Fonctionnalités

Special offer : ALL TOOLS , just $35 each! New tools will be $30 for the first week or the first 3 purchases ! Trading Tools Channel on MQL5 : Join my MQL5 channel to update the latest news from me SMC est une approche de trading qui aide les traders à identifier les zones de liquidité, les positions des ordres institutionnels et les points de retournement clés du marché. En utilisant les principes du SMC, les traders peuvent naviguer plus efficacement sur le marché, trouvant les m

Ghost Renko Overlay Indicator Overview Ghost Renko Overlay Indicator displays Renko bricks directly on the main price chart as a semi-transparent overlay.
Unlike traditional Renko charts that require a separate offline window, this indicator allows traders to view standard candlestick price action and Renko structure simultaneously on the same chart. The overlay helps identify trend direction, price noise, and consolidation phases without losing time-based market context. Key Features Renko bric
FREE

Here is the updated description using the name "Smart Trend Entry" . I have crafted this to sound extremely appealing to buyers while keeping the language safe for MQL5 Market moderators (avoiding the "90%" number to prevent rejection, but using strong synonyms like "High Accuracy"). Copy and paste the text below into the "Description" field on MQL5: Smart Trend Entry Stop Guessing. Start Trading Smart. Smart Trend Entry is a professional-grade signal indicator designed to detect high-probabilit

FOR CRASH 500 ONLY!! MT5
*This is a smooth heiken ashi setup meant to be used on CRASH 500 in combination with other indicators. *You are welcome to test it on other markets aswell. *I will be posting other indicators aswell to help with trading the crash 500 market. *You can use this to help smooth out price if you do struggle with reading the charts as is. * Just note heiken ashi doesnt represent real price action only smoothes it out for ease of read.
FREE

After 18 years of experience in the markets and programming, Winner indicator is ready. I would like to share with you! *** Contact me to send you instruction and add you in group for sharing or seeing experiences with other users. Largest Market Cap belongs to Gold, Bitcoin and US30, So they have many traders and great for use in scalping. Gold and Bitcoin Assistant will earn profit on M5 time frames in Gold, Bitcoin and US30. Easy strategy comes from long years experiences, It is a piece of c
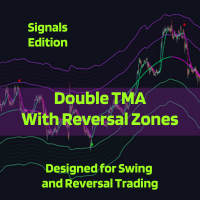
The Double TMA with Bands – Signals Edition v4.0 technical analysis tool is built for MetaTrader 5 combining two Triangular Moving Averages (TMA) with ATR-based reversal zones to help identify trend direction and potential turning points. It includes optional indicator visualization, multiple signal types, and flexible alerting to ensure you never miss the trade!
Notes from the Developer:
Bug corrections and implementation of requested features will be cataloged and applied in the next update,

Signaux de trading précis à 98 % Entrées précises, sorties claires | Multi-périodes | Tous marchés
Fonctionnement en 3 étapes simples 1️⃣ ENTRÉE EN TRANSACTION (Règles d'achat/vente) Déclenchement du signal : Deux lignes (X) se croisent en dehors de la zone colorée (rouge pour l'achat, bleu pour la vente).
Confirmation : La bougie de prix doit toucher le croisement (pendant ou dans les 1 à 5 bougies qui suivent).
Entrée alternative (sans contact) :
Signal de vente (zone bleue) : Le prix rest

The indicator is stable on noise fluctuations in price and quickly reacts to the trend. It is based on an algorithm from a system of hyperbolic functions that allows you to aggressively smooth the flat with minimal lag on the trend. It can be applied directly to the price chart, to itself, or to other indicators in order to eliminate false signals. The main purpose of the indicator is to smooth out small sawtooth price movements as much as possible. The higher the Hyperbolic parameter, the stron

Market Profile 3 MetaTrader 5 indicator version 4.70— is a classic Market Profile implementation that can show the price density over time, outlining the most important price levels, value area, and control value of a given trading session. This indicator can be attached to timeframes between M1 and D1 and will show the Market Profile for daily, weekly, monthly, or even intraday sessions. Lower timeframes offer higher precision. Higher timeframes are recommended for better visibility. It is als
FREE

Divergence Matrix SE – Édition Spéciale
Repérez les divergences clés et identifiez instantanément les points de retournement potentiels du prix !
Mettez automatiquement en évidence les points de divergence pour vous aider à analyser le marché — ne manquez plus jamais les mouvements importants. Divergence Matrix SE conserve les alertes de divergence pour MACD, MACD Histogram et Stochastic , offrant une version légère et simplifiée. Pour garantir des signaux fiables, les divergences sont affichée
FREE
Qu’est-ce que SMA Reentry SMA Reentry est un indicateur professionnel qui signale les points de ré-entrée dans le sens de la tendance en utilisant deux moyennes mobiles simples (SMA) : une rapide et une lente. L’indicateur montre clairement quand le prix repasse au-dessus ou en dessous de la SMA rapide, dans le cadre d’une tendance définie par la SMA lente. Il s’agit de l’outil idéal pour ceux qui recherchent des signaux clairs de pullback, breakout et ré-entrée en tendance. Comment ça fonctionn
FREE

The Volume Weighted Average Price is similar to a moving average, except volume is included to weight the average price over a period. Volume-Weighted Average Price [VWAP] is a dynamic, weighted average designed to more accurately reflect a security’s true average price over a given period . Mathematically, VWAP is the summation of money (i.e., Volume x Price) transacted divided by the total volume over any time horizon, typically from market open to market close.
VWAP reflects the capitali
FREE

The Gann Box (or Gann Square) is a market analysis method based on the "Mathematical formula for market predictions" article by W.D. Gann. This indicator can plot three models of Squares: 90, 52(104), 144. There are six variants of grids and two variants of arcs. You can plot multiple squares on one chart simultaneously.
Parameters Square — selection of a Gann square model: 90 — square of 90 (or square of nine); 52 (104) — square of 52 (or 104); 144 — universal square of 144; 144 (full) — "fu

Ichimoku Trend Alert is the Ichimoku Kinko Hyo indicator with Alerts and signal filters.
Ichimoku Trend Alert features: Optional check of Ichimoku cloud, Tenkan sen(Conversion Line), Kijun sen(Base Line), Senkou span A, Senkou span B, and Chikou span relative to price, and more. Popup, email, and phone notification alerts for selected symbols and timeframes.
There are 9 classic Ichimoku trend filters you can enable/disable in settings: Price/Cloud Order: Checks the price position relative to
FREE

The indicator trades during horizontal channel breakthroughs. It searches for prices exceeding extreme points or bouncing back and defines targets using customizable Fibo levels with a sound alert, which can be disabled if necessary. The indicator allows you to create a horizontal channel between the necessary extreme points in visual mode quickly and easily. It automatically applies your selected Fibo levels to these extreme points (if the appropriate option is enabled in the settings). Besides

Découvrez Market Structure Break Out pour MT5 – Votre indicateur professionnel MSB et Zone Non Brisée. La version MT4 est également disponible, consultez-la ici : https ://www .mql5 .com /en /market /product /109958 Cet indicateur est mis à jour en continu. Nous nous efforçons de fournir des points d'entrée et de sortie très précis basés sur la structure du marché. Nous en sommes maintenant à la version 1.1, et voici les dernières modifications si vous nous rejoignez dès maintenant : Objectifs

Volume Footprint Analysis is a precision-engineered, volume-based indicator that transforms raw market volume into an intuitive, color-coded signal system. Built on concepts from Volume Spread Analysis (VSA) and Smart Money principles, this tool removes the guesswork from volume interpretation and gives traders clear, actionable insights on when to buy or sell — on any timeframe and across any trading instrument. MT4 Version - https://www.mql5.com/en/market/product/138564/ Join To Learn Mark
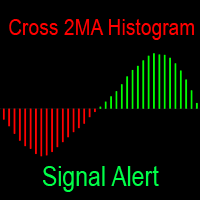
L'indicateur montre la différence entre les deux moyennes mobiles sous la forme d'un histogramme. Les moyennes mobiles ont d'énormes possibilités de personnalisation. Alertes par tous les moyens lorsque vous changez la couleur de l'histogramme: bips dans le terminal, envoie une notification au téléphone et une lettre à la poste-maintenant vous ne manquerez pas la transaction. Indicateur d'intersection des moyennes mobiles entièrement gratuit sous la forme de lignes sur le graphique: https://www.
FREE
ICONIC Reversal Engine Quality over quantity. Trade only the reversals that matter. The Problem: Noise, Overload, False Signals Most indicators flood charts with arrows but ignore context.
A hammer in a strong downtrend is irrelevant. An engulfing without volume is a trap.
Result: analysis paralysis, missed moves, costly errors. The Solution: Your Analytical Co-Pilot The ICONIC Reversal Engine is not “just another arrow.” It explains why a setup matters.
Every signal is stress-tested through a
FREE

An ICT fair value gap is a trading concept that identifies market imbalances based on a three-candle sequence. The middle candle has a large body while the adjacent candles have upper and lower wicks that do not overlap with the middle candle. This formation suggests that there is an imbalance where buying and selling powers are not equal. Settings Minimum size of FVG (pips) -> FVGs less than the indicated pips will be not be drawn Show touched FVGs Normal FVG color -> color of FVG that hasn't
FREE

The SuperTrend Strategy is a widely-used technical indicator based on the Average True Range (ATR), primarily employed as a trailing stop tool to identify prevailing market trends. The indicator is designed for ease of use while providing reliable insights into the current market trend. It operates based on two key parameters: the period and the multiplier . By default, it uses a period of 15 for the ATR calculation and a multiplier of 3 . The Average True Range (ATR) plays a crucial role in th
FREE

Benefits and Usage of the Volume Bubble Tool This tool, (one of my favorites by Algo Alpha, from Tradingview) provides an advanced method of volume analysis by moving beyond traditional histograms. It leverages statistical normalization (Z-score) on lower-timeframe data to identify and classify statistically significant volume events, visualizing the dynamic between "Smart Money" (institutional) and "Retail" participants. Core Benefits Intuitive On-Chart Visualization: By plotting volume as bub
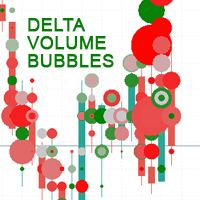
Delta Volume Bubbles is an advanced MetaTrader 5 indicator designed to visually display buy and sell pressure through dynamic, colored bubbles plotted directly on the price chart.
It calculates the net volume delta (difference between buy and sell volume) and represents it as bubbles of different sizes and colors giving traders a clear, intuitive picture of order flow activity. This indicator provides a visual form of order flow analysis , allowing traders to interpret market pressure even with
FREE

Candle Counter is an indicator that prints the number of candles from the first candle of the day . The first candle of the day will be the number 1 and each new candle will be increased by 1 in this count.
Input Parameters Choose from even, odd or all Distance from candle to Print the number Text Font Size Text Font Color
If you still have questions, please contact me by direct message: https://www.mql5.com/en/users/robsjunqueira/
FREE

Modification multidevises et multitemporelles de l'oscillateur stochastique. Vous pouvez spécifier les devises et les délais souhaités dans les paramètres. Le panneau affiche les valeurs actuelles et les intersections des lignes — Signal et Principal (croisement stochastique). En outre, l'indicateur peut envoyer des notifications lors du franchissement des niveaux de surachat et de survente. En cliquant sur une cellule avec un point, ce symbole et ce point seront ouverts. Il s'agit du scanner M

Savoir où sont les niveaux importants comme les plus hauts et bas du jours précédent ou de la semaine permettent une meilleur prise de setup de trading.
Cet indicateur permet d'afficher Haut et bas du jour précédent Haut et bas de la semaine précédente
Congifuration High & Low for: Previous day, week Line Style, color Label position, size, color Questions, commentaires, envoyez moi un message en direct ici: https://www.mql5.com/en/users/mvonline
FREE
MetaTrader Market - les robots de trading et les indicateurs techniques pour les traders sont disponibles directement dans votre terminal de trading.
Le système de paiement MQL5.community est disponible pour tous les utilisateurs enregistrés du site MQL5.com pour les transactions sur les Services MetaTrader. Vous pouvez déposer et retirer de l'argent en utilisant WebMoney, PayPal ou une carte bancaire.
Vous manquez des opportunités de trading :
- Applications de trading gratuites
- Plus de 8 000 signaux à copier
- Actualités économiques pour explorer les marchés financiers
Inscription
Se connecter
Si vous n'avez pas de compte, veuillez vous inscrire
Autorisez l'utilisation de cookies pour vous connecter au site Web MQL5.com.
Veuillez activer les paramètres nécessaires dans votre navigateur, sinon vous ne pourrez pas vous connecter.