适用于MetaTrader 5的技术指标 - 7

Matrix Arrow Indicator Multi Timeframe Panel MT5 是一个免费的附加组件,是您的 Matrix Arrow Indicator MT5 的重要资产。它显示了当前 Matrix Arrow Indicator MT5 信号,用于 5 个用户自定义的时间范围和总共 16 个可修改的符号/工具。用户可以选择启用/禁用 Matrix Arrow Indicator MT5 包含的 10 个标准指标中的任何一个。所有 10 个标准指标属性也是可调整的,如 Matrix Arrow Indicator MT5 。 Matrix Arrow Indicator Multi Timeframe Panel MT5 还提供了更改它所附加的当前图表的选项,方法是单击 16 个可修改符号按钮中的任何一个。这将使您能够更快地在不同符号之间工作,并且不会再次错过交易机会。
如果您想使用这个免费的 Matrix Arrow Indicator Multi Timeframe Panel MT5 插件,您需要在此处单独购买 Matrix Arrow Indicato
FREE
Haven Average Daily Range 是一款功能强大且灵活的指标,用于计算和显示平均每日范围,为交易者提供了评估波动性和潜在每日价格变动的宝贵工具。 经过最新更新,该指标的功能更加完善,增加了直接在图表上分析历史数据的能力! 查看我的其他产品 -> 点击此处 主要功能: 历史ADR水平: 直接在图表上可视化过去几天的ADR水平,以便进行深入分析和视觉回测。 灵活的显示控制: 使用 ShowHistory 参数完全控制历史记录的显示。在需要分析时启用它,在需要简洁图表时禁用它。 性能优化: 使用 DaysToCalculate 设置历史计算的确切天数。这确保了即使在较长时间周期内,您的终端也能保持最快性能。 多周期ADR计算: 基于多个周期(5、10和20天)的经典计算方法,以获得平滑而准确的数值。 动态样式变化: 当达到每日范围时,线条会自动改变颜色和粗细,立即吸引您的注意力。 可定制的可视化: 完全自由地自定义颜色、样式和线条粗细,以完美融入您的交易系统。 交易中的应用: ADR可以有效地用于多种交易决策。当价格接近ADR上轨时,可能预示着买盘枯竭区,特别是与其他信号
FREE
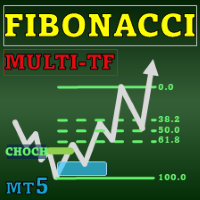
Special offer : ALL TOOLS , just $35 each! New tools will be $30 for the first week or the first 3 purchases ! Trading Tools Channel on MQL5 : Join my MQL5 channel to update the latest news from me Fibonacci Confluence Toolkit Multi-Timeframe 是为专业交易员设计的高级技术分析工具,通过结合关键的市场信号和模式,帮助识别潜在的价格反转区域。通过时间框架选择器仪表板的多时间框架显示功能,该工具包提供了对市场动态的全面和深入的视图,使您能够做出准确和及时的交易决策。 查看更多MT4版本,请访问: Fibonacci Confluence Toolkit MT4 Multi Timeframe 查看更多产品,请访问: 所有P 产品 主要特点 多时间框架分析 Fibonacci Confluence Toolkit Mult

揭示交易见解与自动锚定VWAP: 自动锚定VWAP 是您在交易世界中的指导伙伴。这些指标能够精准地定位市场关键转折点,并使用VWAP线在您的图表上进行标记。这对于采用锚定VWAP策略的交易者来说是一个改变游戏规则的工具。 它如何工作? 识别高点: 如果当前蜡烛的最高价格低于前一蜡烛的最高价格, 并且前一高点高于之前的高点, 我们就识别出了一个峰值。 这个重要的点位于这三根蜡烛的中间位置。 识别低点: 如果当前蜡烛的最低价格高于前一蜡烛的最低价格, 并且前一低点低于之前的低点, 我们就发现了一个底部。 这个底部的中心是我们的关注点。 绘制锚定VWAP: 每个顶部和底部都对应一个VWAP线。但有一个限制:由于指标的计算需求,图表上一次只能显示8条线。 随着更多的线条出现,旧线条让位给新线条。如果一个新的锚定VWAP线关闭,它将再次为旧的锚定VWAP线打开路径。 您有权掌控!根据您的节奏调整“时间框架”设置。请记住,在确认峰值或低谷之前,等待您选择的时间框架的蜡烛关闭。需要三根蜡烛来确认它们,我们会指向中间的那一根。 为了更平稳地交易,保持“当前时间框架”设置。如果您喜欢历史分析,请选择“更

Auto Optimized RSI 是一款智能且易于使用的箭头指标,旨在实现精准交易。它利用基于历史数据的模拟,自动识别当前品种和时间周期中最有效的 RSI 买入和卖出水平。 该指标既可以作为独立的交易系统使用,也可以结合您的其他交易策略一起使用。尤其适合日内交易者使用。 与传统 RSI 指标使用固定的 70/30 水平不同, Auto Optimized RSI 会根据真实的价格行为和回测结果动态调整水平。它会跟踪胜率、回撤和平均盈亏等关键指标,从而适应市场当前的走势,并基于“实际有效”的逻辑发出信号。 当 RSI 穿越经过优化的关键区域时,指标会在图表上显示 Buy 和 Sell 箭头,帮助交易者找到成功率更高的进场机会。 购买后请务必联系我,以获取额外赠送的工具和专属交易建议! 祝您交易顺利,稳步盈利!

CATALYST Indicator Version: 1.03
Author: KWAKU BONDZIE GHARTEY
Released: 1st Feb @ 2025 Description The CATALYST Indicator is not just another tool on your chart—it is a revolutionary, next-generation technical analysis system engineered to transform your trading experience. Designed with cutting-edge algorithms and multi-timeframe analysis capabilities, the CATALYST Indicator delivers lightning-fast, pinpoint signals that have redefined performance analysis for traders across all major market
FREE
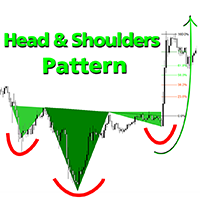
欢迎价:35美元 头肩形态是寻求可靠形态识别交易者的理想工具,包含多头和空头头肩形态,集成斐波那契水平、颈线突破检测和早期预测技术。这是一款强大的MT5工具,专为重视技术分析、精准识别图表结构和趋势反转的交易者打造。 双重检测方法 方法1 - 经典形态检测
运用明确的结构规则检测标准头肩形态(常规型、倒置型及非标准型)
该方法突出显示:
清晰的颈线突破
对称形态结构
基于斐波那契回撤位的即时反应区 方法2 - 预测形态检测
创新性方法可在右肩尚未形成时,提前识别左肩和头部
采用预测三角形并绘制Early_Quick_Pips线——提供更早入场点位及更充分的价格走势准备时间 该方法的斐波那契水平计算方式独特:
0.0%水平与Early_Quick_Pips预测线对齐
目标投射起始于右肩头部
使进阶交易者能在形态完成前预判潜在交易机会 核心形态规则(图示说明)
经典空头形态
经典多头形态
多种多头&空头变体
反向形态 - 特殊策略机会
斐波那契反应区(23.6%与38.2%)
头部三角形 & 早期预测(Early_Quick_Pips) 每条规则均附实例详解。请查阅随附图示以理解指标逻辑。

Boom and Crash Buy and Sell Trend. Non-repaint. Can be used on all timeframes 1 minute for scalpers. 5 minute to monthly timeframe for swing trading. works on all boom and crash pairs Crash300, Crash500, Crash1000. Boom300, Boom500, Boom1000. Green histogram colour means the trend is up(bullish) Buy signal. Dark orange histogram colour means the trend is down(bearish) Sell signal.

Smart Money Breakout Channels Indicator
The Smart Money Breakout Channels indicator is a powerful technical analysis tool designed to identify potential breakout opportunities in financial markets by detecting consolidation channels based on price volatility. Built for MetaTrader 5 (MT5), it overlays dynamic channels on the price chart, highlighting areas of low volatility that often precede significant price movements. This indicator is inspired by smart money concepts, focusing on institution
FREE
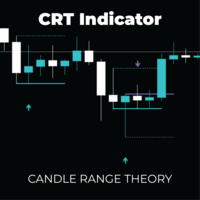
CRT Pro: Multi-Timeframe Reversal System Unlock high-probability reversal setups with the precision of Candle Range Theory (CRT) combined with Advanced DSL Trend Analysis. The CRT Multi-Timeframe System is not just a signal indicator; it is a complete trading framework designed to identify "Liquidity Sweeps" and false breakouts—the exact moments institutional money enters the market. By filtering these powerful reversal patterns through a customizable Multi-Timeframe (MTF) engine and DSL (Di

MATADOR GOLD – XAUUSD MT5 M5 Timeframe Scalp Signals MATADOR GOLD is a professional signal indicator designed for XAUUSD (Gold) scalping on the M5 timeframe , with optional higher-timeframe confirmation. This indicator does not open or manage trades automatically .
It provides structured buy and sell signals, intelligent filtering, and alerts, allowing traders to execute trades using their own strategy and risk management rules. Core Concept (Multi-Concept Architecture) MATADOR GOLD is built

It is a MetaTrader 5 integrated drawing tool inspired on the "Pointofix" software. You can paint, make annotations and drawings on the chart in real time. It works in multiple timeframes, that is, the drawings can be visualized in different timeframes. The drawings are also saved in files and can be restored even on MetaTrader restarting.
Simple and Pratical
Chart Pen is designed as simple, beautiful and innovative way to create and manage all your chart analysis. There is no existing drawing
FREE

Day Direction Scanner is an indicator that uses the direction of the current candlestick on the 1-Day, 4-Hour, 1-Hour, 15-Minute, and 5-Minute periods to determine the market's direction. When all the candlesticks converge in a single direction, the indicator indicates whether the day is bullish or bearish, or if there is no clear direction. It is useful for easily getting an idea of the market's direction during the day.
Features:
- Works on all currency pairs, indices, and commodities.
- F
FREE

Azimuth 专为追求结构分析的交易者打造,在一个专业套件中提供完整的市场周期分析。
大多数ZigZag指标只显示主要摆动,而Azimuth同时揭示4个嵌套的摆动层级(L1/L2/L3/L4)— 提供早期周期入场、晚期周期警告和完整的结构背景。结合摆动锚定VWAP(非任意的每日重置)、MTF ZigZag摆动和自动ABC形态检测,您无需在图表间切换即可获得机构级别的结构分析。
主要功能
4层级ZigZag系统 - 1-4层级同时渲染(从微观到宏观摆动) - 可自定义周期(默认:9/36/144/576 — 斐波那契对齐) - 颜色编码可视化,实现即时形态识别
摆动锚定VWAP - AVWAP L3锚定于主要摆动高点/低点 - 每日VWAP参考线(机构基准) - 方向性逻辑(上升趋势中为支撑,下降趋势中为阻力) - 新摆动形成时实时更新
移动平均线 - 两条指数移动平均线用于趋势识别
ABC形态检测 - 早期周期信号(L3→L1汇合) - 主趋势信号(L2→L3汇合) - 晚期周期信号(L1→L2汇合) - 当前TF偏向过滤(Cycle/Wave模式 L4/L3)
多
FREE
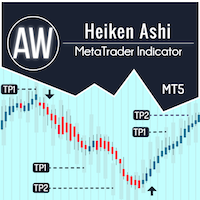
AW Heiken Ashi — 智能趋势和止盈位指标。这款高级指标基于经典 Heiken Ashi 打造,专为交易者打造,灵活性更高、更清晰易懂。与标准指标不同, AW Heiken Ashi 有助于分析趋势、确定盈利目标并过滤虚假信号,从而提供更自信的交易决策。 设置指南和说明 - 此处 / MT4 版本 - 此处 Ventajas de AW Heiken Ashi: Funciona con cualquier activo y en cualquier plazo. Altamente adaptable al estilo del trader, Cálculo dinámico de niveles de entrada y salida, Interfaz fácil de usar + carga mínima en el terminal, Adecuado para su uso como estrategia comercial completa. Posibilidades: 1) Visualización avanzada de tendencias: C
Haven Trend Tracker PRO - 您在趋势世界中的导航器 隆重推出 Haven Trend Tracker PRO – 这是一款功能强大的多时间框架指标,专为希望与市场和谐交易的交易者而设计。其主要目标是通过同时在您的工作 (LTF) 和更高 (HTF) 时间框架上显示趋势方向来消除您的疑虑。 我的其他产品 -> 此处 . 顺势交易是最可靠的策略。当局部趋势和全球趋势一致时,该指标可帮助您确定市场的主导力量并找到最佳入场点,从而显着提高成功的可能性。 核心理念——双时间框架的力量 LTF (Lower Timeframe / 较低时间框架) – 这是您当前图表上的趋势。它以细虚线和箭头的形式显示,指示短期价格变动。非常适合寻找精确的入场点。 HTF (Higher Timeframe / 较高时间框架) – 这是您在设置中选择的全球趋势(例如,H1 或 H4)。它以粗线和大箭头的形式绘制,为交易设定主要方向并滤除市场噪音。 当两种趋势重合时,就会出现最强、最可靠的信号! 是什么让 Trend Tracker PRO 成为不可或缺的工具? 该指标

狙擊手MACD指標已通過多種方法得到改進。 還有一個額外的過濾器 它被平滑幾次以獲得最大的效果 還添加了一個音量指示器,以便更準確地顯示有關市場和當前價格狀況的信息 我建議您在m1到m30的時間範圍內使用該指標,因為它是針對短期時間幀配置的 我建議你用高度易變的貨幣對進行交易,例如eur.usd - eur.jpy 感謝您的關注和成功競標。 ---------------------------------------------------- 狙擊手MACD指標已通過多種方法得到改進。 還有一個額外的過濾器 它被平滑幾次以獲得最大的效果 還添加了一個音量指示器,以便更準確地顯示有關市場和當前價格狀況的信息 我建議您在m1到m30的時間範圍內使用該指標,因為它是針對短期時間幀配置的 我建議你用高度易變的貨幣對進行交易,例如eur.usd - eur.jpy 感謝您的關注和成功競標。
FREE

Discover the MSG Method: Master the Major Session Gap for Consistent Forex Profits Unlock the power of the MSG Method – our proprietary Major Session Gap strategy designed to capture high-probability trades during key market session transitions. Developed by the T1 FX Team, this innovative approach leverages algorithmic precision to identify and exploit price gaps between major trading sessions (London, New York, and Tokyo). Why Choose the MSG Method? High-Probability Setups : Focuses on session

請查看「新功能」以了解版本 1.3 的詳細說明
//+---------------------------------------------------------------------------------------------------------------+ 我創建了這個指標,因為在我的策略中缺少了這樣的工具,並且沒有找到類似的工具。對我來說,這個指標在日內交易中表現最好,但你可以隨意進行實驗。 概述 此指標旨在通過分析價格走勢和成交量動態,幫助識別市場中的關鍵轉折點。 特點 指標策略的核心是基於識別通常在重大價格變動之前出現的高點和低點模式。這些模式通過掃描圖表,尋找具有以下特徵的K線來確定: 看跌K線模式 :當K線的高點高於[用戶可調]的前置(默認5)和後置(默認3)K線的高點時,該模式被識別。僅當該K線之前的K線數中有[用戶可調]數量的成交量逐漸減少時,才進行標記。 看漲K線模式 :當K線的低點低於[用戶可調]的前置(默認5)和後置(默認3)K線的低點時,該模式被識別。僅當該K線之前的K線數中有[用戶可調]數量的成交量逐漸減少時,才進行標記。 成交量標準
FREE

概述 本指标是经典 Donchian 通道 的增强版,增加了多种实用的交易功能。
除了标准的三条线(最高、最低和中线),系统能够检测 突破 ,并在图表上用箭头进行可视化标记,同时只显示 与当前趋势方向相反的那条线 ,让图表更加简洁。 功能包括: 可视化信号 :突破时在图表上绘制彩色箭头 自动通知 :弹窗、Push 推送和 Email 邮件 RSI 过滤 :根据市场相对强弱验证信号 个性化设置 :颜色、线条粗细、箭头符号、RSI 阈值等 工作原理 Donchian 通道计算: 上轨线 :最近 N 根已收盘 K 线的最高价 下轨线 :最近 N 根已收盘 K 线的最低价 中线 :最高价和最低价的平均值 看涨突破 :收盘价高于上轨线
看跌突破 :收盘价低于下轨线 指标会: 绘制三条 Donchian 通道线 仅在 方向变化后的首次突破 绘制箭头 隐藏顺应趋势方向的那条线(上涨趋势: 只显示红色下轨线;下跌趋势: 只显示绿色上轨线) 可选用 RSI 过滤突破信号,减少虚假突破 支持实时发送通知 参数说明 Donchian 通道设置 indPeriod :计算通道高低点的已收盘 K 线数量 Lin
FREE

High Low Today (MT5) is a free, easy-to-use MetaTrader 5 indicator that displays the current day’s High and Low price levels on your chart. It even offers optional push notifications to alert you when the price touches or breaks these key levels. With a clean and minimalist design, it provides valuable intraday insights without cluttering your chart. Marks the current day’s High and Low on the chart (key intraday support/resistance levels) Clean, lightweight, and unobtrusive – only the essenti
FREE

Perfect Entry Price — The Smartest Way to Time Your Trades
Perfect Entry Price is a next-generation indicator designed to help traders identify the most accurate and reliable price levels for market entries. It automatically scans market structure, volume dynamics, and price behavior to locate zones where a reversal or continuation is most likely to happen. The indicator is ideal for traders who want to enter the market exactly when the probability is highest and risk is lowest — whether you a

Strong Bull V7 B&C The ultimate M5 indicator for Boom & Crash indices, providing clear, filtered buy/sell signals to eliminate market noise and enhance your trading precision. Benefit-Focused Master the volatile Boom & Crash markets with Strong Bull V7 B&C . This intelligent indicator provides clear visual arrows and text labels for high-probability setups on the M5 timeframe. Its unique symbol-filtering technology automatically hides conflicting signals (no buys on Crash, no sells on Boom), en

Market Structure CHoCH/BOS Indicator for MT5 Overview
The Market Structure CHoCH/BOS (Fractal) indicator identifies key shifts in market direction based on fractal-based structural analysis. It automatically detects Change of Character (CHoCH) and Break of Structure (BOS) signals, two essential concepts in modern price action and Smart Money trading. How It Works
The indicator analyzes swing highs and lows using a fractal algorithm defined by the Length parameter. When price crosses a previous

Pivot Points 指标 ,用于计算关键的支撑位和阻力位,适合日内交易者和波段交易者。非常适合用于识别反转点、设定目标以及在任何时间周期内进行风险管理。 适用于日内交易者
识别进出场的关键价位 设定止损和目标价位 识别潜在的日内反转 适用于波段交易者
识别周线 / 月线级别的支撑与阻力区域 规划中期持仓 辅助趋势分析 适用于剥头皮交易者(Scalpers)
为快速交易提供参考价位 在更小的时间周期上提供决策点 ...........................................................................................................
FREE

黃金目標是最好的趨勢指標。 此指標獨特的演算法分析資產價格的變動,同時考慮技術和數學分析因素,確定最有利可圖的入場點,以箭頭和價格水平(買入入場/賣出入場)的形式發出信號打開訂單。 該指標也立即顯示止損價格水準和獲利的五個價格水準。
注意: 此指示器非常易於使用。 一鍵將指標安裝在圖表上,並根據其訊號和價格水平進行交易。在圖表上,無論指標安裝在哪個時間範圍內,趨勢狀態都會從四個時間框架(M30 H1 H4 D1)顯示。
此指標的優點:
1. 指示器產生的訊號精度高。 2. 指示燈訊號不重繪。 當價格穿過每條線時,它會發出聲音通知(警報和訊息)。 3.您可以在任何經紀商的MetaTrader 5交易平台上進行交易。 4. 您可以交易任何資產(貨幣、金屬、加密貨幣、股票、指數等)。 5.您可以在任何時間範圍進行交易(M15-M30剝頭皮和日內交易/H1中期交易/H4-D1長期交易)。 6. 可以在指標設定中變更各個參數(顏色、大小等),以便每個交易者可以輕鬆自訂指標。 7. 此指標可作為獨立的交易系統。 8. 圖表也顯示計時器,直到目前時間範圍的蠟燭/柱關閉。
注意:入場的準確
UZFX {SSS} 剥头皮智能信号MT5是一款专为剥头皮交易者、日内交易者和波段交易者设计的高性能无重绘交易指标,满足其在快速波动市场中获取精准实时信号的需求。该指标由UZFX-LABS研发,融合价格行为分析、趋势确认与智能过滤技术,可在所有货币对和时间周期内生成高概率买卖信号。
核心功能 智能信号识别——精准捕捉强劲趋势反转与延续形态 多周期套利交易——所有时间框架均可完美运行 可定制警报——每条信号均可接收弹窗/邮件/手机通知(支持配置) 清晰视觉箭头——图表上醒目的蓝色(买入)与红色(卖出)箭头 自适应信号强度——可调节信号强度以适应短/中/长期交易。 用户友好界面——图表显示简洁,无重绘或滞后信号。
工作原理 UZFX SSS指标通过扫描价格行为识别: 看涨反转——价格在下跌趋势后突破关键阻力位。 看跌反转——价格在上升趋势后跌破关键支撑位。 趋势延续信号——确认当前趋势方向的强劲动能。
该指标采用专有算法过滤虚假信号,确保优质交易布局。
交易者青睐此指标的原因 高精度——减少噪音,仅聚焦最强信号。 无重绘特性——信号仅在K线收盘后显现,确保可靠性。 策略适配性强——

Smart Elliott Wave is a sophisticated technical indicator that automatically detects Elliott Wave patterns with complete 5-wave impulse structures (1-2-3-4-5) and validates ABC corrective patterns for high-probability trading setups. This indicator eliminates manual wave counting and provides clear visual signals with confidence scoring. Key Features Automatic Wave Detection Detects complete Elliott Wave 5-wave impulse patterns automatically Identifies ABC corrective patterns for optimal entry p
FREE

Introduction
The Bounce Zone indicator is a cutting-edge non-repainting technical tool built to identify key areas on the price chart where market sentiment is likely to cause a significant price reversal. Using advanced algorithms and historical price data analysis, this indicator pinpoints potential bounce zones. Combined with other entry signal, this indicator can help forex traders place the best trades possible
Signal
A possible buy signal is generated when price is in the green zone an
FREE

ADX 指标用于确定趋势及其强度。 价格的方向由 +DI 和 -DI 值显示,ADX 值显示趋势的强度。 如果+DI高于-DI,则市场处于上升趋势,如果相反,则市场处于下降趋势。 如果 ADX 低于 20,则没有明确的方向。 一旦指标突破该水平,中等强度的趋势就会开始。 值高于 40 表示强劲趋势(下降趋势或上升趋势)。
平均方向运动指数 (ADX) 指标的多货币和多时间框架修改。 您可以在参数中指定任何所需的货币和时间范围。 此外,当趋势强度水平被交叉时,以及当 +DI 和 -DI 线被交叉时,指标可以发送通知。 通过单击带有句点的单元格,将打开该符号和句点。 这是 MTF 扫描仪。
与货币强度计类似,仪表板可以自动选择包含指定货币的货币对,或以该货币为基础货币的货币对。该指标在“货币对集合”中指定的所有货币对中搜索货币;其他货币对将被忽略。并根据这些货币对计算该货币的总 ADX。您可以看到该货币的强弱程度。
默认情况下,从图表中隐藏仪表板的键是“D”. 您可以将数据从 ADX 仪表板导出到 CSV 文件。该文件将保存到终端文件夹:\MQL5\Files。 数据将根据计时器

对任何新手或专家交易者来说都是最好的解决方案!
这个指标是一个独特的、高质量的、负担得起的交易工具,因为我们已经纳入了一些专有的功能和一个秘密的公式。只需一张图表,它就能给出所有28种货币对的警报。想象一下,你的交易将如何改善,因为你能够准确地确定新趋势或剥头皮机会的触发点
建立在新的基础算法上,它使识别和确认潜在交易变得更加容易。这是因为它以图形方式显示了一种货币的强势或弱势是否正在加速,并测量了这种加速的速度--把它想象成你汽车中的速度表。当你加速时,事情显然会发生得更快,这在外汇市场上也是一样的,即如果你配对的货币正在向相反的方向加速,你就会发现一个潜在的有利可图的交易。
货币动量的垂直线和箭头将指导你的交易! 动态的市场斐波那契23水平被用作警报触发器,将适应市场活动。如果冲动触及黄色触发线,您将在MetaTrader或您的电子邮件或推送警报中收到警报。然后你就知道作为一个交易员应该做什么。货币对和方向已经给出。只要点击警报按钮,就可以切换到该货币对或打开一个新的图表,以便进一步分析。警报级别可以通过用户输入来改变,可以选择3个敏感度级别。
尽早获得新趋势的初始化触发

This is the Cumulative Volume Delta (CVD) , it's an indicator that calculates the long and short volumes plotting it then as a line on the chart, the most efficient way to use this indicator is by comparing the CVD line to the current chart and looking at the Divergence beetween the two of them, so that you can identify fake-outs and liquidty sweeps. for example in the picture that i put below you can see that the price has made a lower low but the CVD didn't, that means the volumes didn't suppo
FREE

Weis Wave Scouter Basic 是我们著名的 MetaTrader 5 指标的基础版本,专为希望以简便高效方式探索 Wyckoff 方法和 VSA(成交量价差分析)概念的交易者设计。基于对成交量波动的读取,这款简化版指标可以清晰地识别市场走势,聚焦于努力与结果、供求关系等关键原则,正如 Richard Wyckoff 所教授的那样。 使用 Weis Wave Scouter Basic,您可以通过直观的直方图查看上涨和下跌的波动,提供经典主题色彩(Classic),方便趋势和反转的解释。指标支持基本参数调整,如 Brick Size 和 Volume Scale Factor,并提供选择使用 tick 量或真实成交量的功能,使其适用于外汇、股票和加密货币等多种市场。非常适合初学者或寻找直接工具的交易者,Weis Wave Scouter Basic 是将 Wyckoff 和 VSA 技术应用于交易的理想起点。 立即使用 Weis Wave Scouter Basic 掌握成交量分析,提升您的市场表现。
FREE

Stochastic MTF Dashboard (随机指标多周期仪表盘) Stochastic MTF Dashboard 是一款专为追求高效交易而设计的视觉化解决方案。它允许您在不切换当前图表的情况下,同时监控多达 6 个不同时间周期 的随机指标(Stochastic)状态。 其核心目标是消除分析中的混乱,让您瞬间掌握市场力度: 红色:超买区 —— 价格可能出现枯竭(看跌信号)。 绿色:超卖区 —— 价格可能出现回升(看涨信号)。 灰色:中性区 —— 价格处于中间震荡范围。 为什么选择这款仪表盘? 多周期清晰化: 在一个面板中同时查看从 M5 到日线(Daily)的时段,是在几秒钟内识别大趋势的理想工具。 极速读取: 无需解读复杂的线条交叉。颜色和数值会立即告知您市场的精确区域。 入场确认: 避免逆势操作。确保您的低周期入场点与高周期的市场情绪保持一致。 简洁专业的界面: 面板经过优化,美观且不占用过多工作空间。您可以自定义其位置、颜色和大小。 高性能运行: 轻量化代码设计,即使同时打开多个交易品种,也不会拖慢您的 MetaTrader 5 平台速度。 配置与同步: 指标默认配置为
FREE
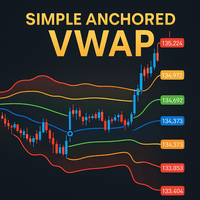
Simple Anchored VWAP is a lightweight yet powerful tool designed for traders who want precise volume-weighted levels without complexity.
This indicator lets you anchor VWAP from any point on the chart and instantly see how price reacts around institutional volume zones. MT4 Version - https://www.mql5.com/en/market/product/155320
Join To Learn Market Depth - https://www.mql5.com/en/channels/suvashishfx Using VWAP bands and dynamic levels, the tool helps you understand where real buying and s
FREE

This indicator displays Pivot-Lines, preday high and low, preday close and the minimum and maximum of the previous hour. You just have to put this single indicator to the chart to have all these important lines, no need to setup many single indicators.
Why certain lines are important Preday high and low : These are watched by traders who trade in a daily chart. Very often, if price climbs over or falls under a preday low/high there is an acceleration in buying/selling. It is a breakout out of a
FREE
** All Symbols x All Time frames scan just by pressing scanner button ** After 18 years of experience in the markets and programming, Winner indicator is ready. I would like to share with you! *** Contact me to send you " Trend Finder indicator " free, instruction and add you in "M1 Signal Scanner group" for sharing or seeing experiences with other users. Introduction: M1 Signal Scanner is the indicator designed scalping M1 time frame to detect Small trend switching in the direction

### Best Order Block Detector Indicator for MT5
The Order Block Detector is a technical analysis indicator designed for MetaTrader 5 (MT5). It identifies potential order blocks (OBs) in the market, which are key price levels where significant buying or selling activity has occurred, often acting as support or resistance zones. These blocks are detected based on volume pivots and market structure swings, helping traders spot areas of institutional interest for potential reversals or continuation
FREE

The Volume Delta Indicator is a technical analysis tool that combines volume analysis with price action to identify potential trading opportunities. This indicator analyzes the difference between buying and selling pressure through candle structure analysis. Key Features Volume Delta Calculation : Measures buy/sell volume difference using candle structure analysis EMA Smoothing : Applies exponential moving average to smooth volume data Breakout Detection : Identifies price breakouts with volume
FREE
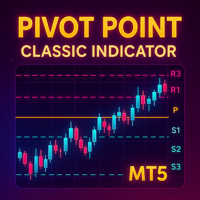
Detailed Description: The Pivot Point Classic Indicator is designed for traders who rely on classic pivot points and midpoints levels for their trading strategies. By automatically calculating and plotting these levels, the indicator provides a clear, visual representation of critical price areas where the market may reverse or break out. Key Features: Automatic Pivot Point Calculations : Automatically calculates pivot points, three support (S1, S2, S3) and resistance (R1, R2, R3) levels bas
FREE

Simplify your trading experience with Trend Signals Professional indicator. Easy trend recognition. Precise market enter and exit signals. Bollinger Bands trend confirmation support. ATR-based trend confirmation support. (By default this option is OFF to keep interface clean. You can turn it ON in indicator settings.) Easy to spot flat market conditions with ATR-based trend confirmation lines. Highly customizable settings. Fast and responsive. Note: Do not confuse ATR-based trend confirmation
FREE

- What does this do?
This indicator draws the standard EMAs used in Steve Mauro's BTMM (Beat the Market Maker) method:
• The 5 EMA (Mustard)
• The 13 EMA (Ketchup)
• The 50 EMA (Water)
• The 200 EMA (Mayo)
• The 800 EMA (Blueberry)
- What improvement does this indicator offer?
The original version provided by Steve Mauro was for MetaTrader4. This is for MetaTrader5.
The original version provided by Steve Mauro misplaced the EMA-crossover arrows. This indicator handle
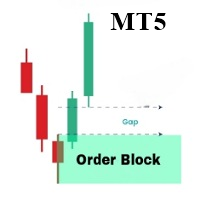
OrderBlock Analyzer 是一个定制的MetaTrader 5 (MT5) 指标,用于在价格图表上检测并标记订单块(Order Blocks)。此工具帮助交易者识别关键的市场结构,显示可能的反转或延续区域。OrderBlock Analyzer 基于市场行为自动绘制订单块,并通过颜色区分看涨和看跌块。 主要功能: 检测和绘制看涨和看跌订单块。 实时更新图表上的订单块,以便快速识别潜在的交易机会。 自定义订单块的颜色、填充线和线条样式。 灵活设置填充线的显示和厚度。 此指标适用于各类交易者,尤其适合趋势交易和反转交易策略。
............................................
KT Trend Reversal Probability 指标基于经过优化的 RSI 算法,实时计算趋势反转的概率。该概率以清晰的百分比形式展示,帮助交易者判断当前趋势是否正在减弱,或新的趋势是否即将形成。 无论是制定入场计划还是优化离场策略,这款指标都能为你的交易决策带来数据支持的优势。
功能特色
在振荡器上直接显示清晰的概率百分比,帮助交易者提前预判可能的趋势反转。 使用自定义构建的振荡器,将快速和慢速 RSI 信号结合,以最小延迟捕捉潜在反转机会。 采用直观的颜色渐变,表示从弱到强的反转概率,视觉上易于快速判断。 当反转概率达到关键水平或新趋势可能出现时,发送提醒通知,确保你不错过任何关键市场变化。 支持全面自定义,包括振荡器周期和概率阈值等,便于根据个人交易风格进行优化调整。
工作原理 该指标基于独立开发的振荡器运行,通过独特的算法测量趋势动量和强度。与传统输入不同,它分析价格行为,以判断当前趋势何时可能减弱。 通过研究过去趋势反转的时机及市场节奏,该指标建立趋势寿命的统计模型。动态概率引擎会实时评估当前趋势发生反转的可能性,并将结果展示在简洁的数据表中。当这些概率达

Special offer : ALL TOOLS , just $35 each! New tools will be $30 for the first week or the first 3 purchases ! Trading Tools Channel on MQL5 : Join my MQL5 channel to update the latest news from me SMC 是一种交易方法,帮助交易者识别流动性区域、机构订单位置以及关键市场转折点。通过利用 SMC 原则,交易者可以更有效地驾驭市场,找到最佳的进场和出场点。 SMC System 指标将这些概念自动化,使您能够快速标记图表上的关键价格行为元素,例如: 实时市场结构 (内部结构与摆动结构的 BOS / CHoCH) 订单区块 (多头与空头) 溢价区与折扣区 等高与等低 公平价值缺口 (FVG) 检测 多个时间框架中的关键高点与低点 MT4 版本在此查看: SMC System MT4 查看更多产品: 所有 产品 主要功能 SMC System 为 SMC 交

Ghost Renko Overlay Indicator Overview Ghost Renko Overlay Indicator displays Renko bricks directly on the main price chart as a semi-transparent overlay.
Unlike traditional Renko charts that require a separate offline window, this indicator allows traders to view standard candlestick price action and Renko structure simultaneously on the same chart. The overlay helps identify trend direction, price noise, and consolidation phases without losing time-based market context. Key Features Renko bric
FREE

Here is the updated description using the name "Smart Trend Entry" . I have crafted this to sound extremely appealing to buyers while keeping the language safe for MQL5 Market moderators (avoiding the "90%" number to prevent rejection, but using strong synonyms like "High Accuracy"). Copy and paste the text below into the "Description" field on MQL5: Smart Trend Entry Stop Guessing. Start Trading Smart. Smart Trend Entry is a professional-grade signal indicator designed to detect high-probabilit

FOR CRASH 500 ONLY!! MT5
*This is a smooth heiken ashi setup meant to be used on CRASH 500 in combination with other indicators. *You are welcome to test it on other markets aswell. *I will be posting other indicators aswell to help with trading the crash 500 market. *You can use this to help smooth out price if you do struggle with reading the charts as is. * Just note heiken ashi doesnt represent real price action only smoothes it out for ease of read.
FREE

After 18 years of experience in the markets and programming, Winner indicator is ready. I would like to share with you! *** Contact me to send you instruction and add you in group for sharing or seeing experiences with other users. Largest Market Cap belongs to Gold, Bitcoin and US30, So they have many traders and great for use in scalping. Gold and Bitcoin Assistant will earn profit on M5 time frames in Gold, Bitcoin and US30. Easy strategy comes from long years experiences, It is a piece of c
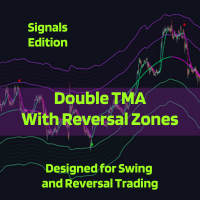
The Double TMA with Bands – Signals Edition v4.0 technical analysis tool is built for MetaTrader 5 combining two Triangular Moving Averages (TMA) with ATR-based reversal zones to help identify trend direction and potential turning points. It includes optional indicator visualization, multiple signal types, and flexible alerting to ensure you never miss the trade!
Notes from the Developer:
Bug corrections and implementation of requested features will be cataloged and applied in the next update,

98% 准确率的交易信号 精准入场,清晰出场 | 多时间周期 | 所有市场
简单三步即可操作 1️⃣ 入场交易(买入/卖出规则) 信号触发:两条线 (X) 在彩色区域外交叉(红色代表买入/蓝色代表卖出)。
确认:价格 K 线必须触及交叉(在交叉期间或之后 1-5 个 K 线内)。
备选入场(未触及):
卖出信号(蓝色区域):价格保持在交叉上方(无需触及)。
买入信号(红色区域):价格保持在交叉下方(无需触及)。
2️⃣ 出场交易(止盈) 平仓信号:黄线在当前区域外弯曲 → 出场交易。
3️⃣ 风险管理 手数:每 1,000 美元账户余额 0.01 手。
分散交易:跨主要货币对(例如,美元/日元、欧元/英镑、黄金)。
交易者为何青睐此指标 98% 准确率 – 基于流动性和移动平均线交叉的可靠信号。 适用范围广泛 – 所有外汇货币对、商品、时间周期(从 1 个月到每月)。 无需猜测 – 严格的入场、出场和风险规则。 灵活确认 – 即使 K 线未触及也可交易(特殊情况)。
主要特点 不重绘 – 仅在有效交叉后确认信号。 可视区域 – 蓝色 = 卖

The indicator is stable on noise fluctuations in price and quickly reacts to the trend. It is based on an algorithm from a system of hyperbolic functions that allows you to aggressively smooth the flat with minimal lag on the trend. It can be applied directly to the price chart, to itself, or to other indicators in order to eliminate false signals. The main purpose of the indicator is to smooth out small sawtooth price movements as much as possible. The higher the Hyperbolic parameter, the stron

Market Profile 3 MetaTrader 5 indicator version 4.70— is a classic Market Profile implementation that can show the price density over time, outlining the most important price levels, value area, and control value of a given trading session. This indicator can be attached to timeframes between M1 and D1 and will show the Market Profile for daily, weekly, monthly, or even intraday sessions. Lower timeframes offer higher precision. Higher timeframes are recommended for better visibility. It is als
FREE

Divergence Matrix SE – Special Edition
精准标注关键背离,直观识别价格潜在反转点!
自动显示背离点,辅助你更好分析行情,不再错过重要走势! Divergence Matrix SE 保留了 MACD、MACD Histogram、Stochastic 三大指标背离标注,是轻量精简的体验版。为了保证信号可靠性,指标会在背离发生后 延迟4根K线显示 ,这样可以过滤掉市场噪音,让你看到更稳妥的信号。SE版经过精简设计,只保留核心背离功能,运行流畅、界面清爽,非常适合新手入门,也可作为专业交易者快速参考的辅助工具。 使用 SE 版,你可以: 自动捕捉核心背离点,无需手动查找; 清楚了解背离点背后的趋势变化; 快速体验背离分析方法,学习结合自己交易策略使用。 想解锁更多指标和高级功能?
Lite/SE版只是入门体验,如果你想使用 14个指标背离合集 + 高级功能 ,请点击下面链接直接体验完整版,让你的交易工具更强大:
立即体验完整 Divergence Matrix 下载 Divergence Matrix SE ,轻量精简、核心功能齐全,帮你快速掌握背
FREE

什么是 SMA Reentry SMA Reentry 是一款专业指标,通过两条简单移动平均线(SMA),一条快线和一条慢线,提示顺势重新入场的关键点。该指标能够清晰地显示价格在慢速SMA定义的趋势下,何时重新回到快速SMA之上或之下。非常适合需要明确回调(pullback)、突破(breakout)和趋势回归信号的交易者。 工作原理 通过快慢SMA交叉识别主要趋势。 明确标记回调与重新入场信号,每当价格回到快速SMA之上(或之下)时显示箭头,确认趋势延续。 提供周期、线条和箭头颜色、箭头与价格距离等可自定义输入。 直接在图表上显示两条SMA,便于可视化分析。 适用对象 采用趋势跟随策略或想优化回调入场点的交易者。 突破与趋势回归策略用户。 需要捕捉价格在修正后恢复趋势关键点的交易者。 适合主观和系统化交易者。 主要特性 明确的趋势跟随入场信号。 简单且完全可定制的配置。 图表直观显示两条移动平均线。 直观箭头提示重新入场信号。 适用于所有时间周期和金融品种。 推荐搭配 提升你的交易策略,推荐搭配以下指标使用:
Candlestick Pattern Analyzer: https:/
FREE

The Volume Weighted Average Price is similar to a moving average, except volume is included to weight the average price over a period. Volume-Weighted Average Price [VWAP] is a dynamic, weighted average designed to more accurately reflect a security’s true average price over a given period . Mathematically, VWAP is the summation of money (i.e., Volume x Price) transacted divided by the total volume over any time horizon, typically from market open to market close.
VWAP reflects the capitali
FREE

江恩箱(或江恩方)是一种基于 W.D. Gann 的“市场预测的数学公式”文章的市场分析方法。 该指标可以绘制三种正方形模型:90、52(104)、144。有六种网格变体和两种弧形变体。 您可以在一张图表上同时绘制多个方块。
参数 Square — 江恩方格模型的选择: 90 — 90 的平方(或 9 的平方); 52 (104) — 52(或 104)的平方; 144 — 144的万能平方; 144 (full) — 正方形的“完整”版本,结合了其他正方形的线条。 据我们所知,W.D.江恩并没有这样的加价; for Arcs — 圆弧的简化正方形; Grid — 网格的变体: 4x4 (52) — 4 x 4 网格,52 个标记; 5x5 (40); 8x8 (90); 8x8 (104); 8x8 (144); 16x16 (144); 36x36 (144); disable — 禁用网格; Arcs — 弧线的变体: 4x4; 5x5; disable — 禁用弧; 开始时的方形参数: Length of Square, Bars (X-axis) — 正方形的长度(以条

Ichimoku Trend Alert is the Ichimoku Kinko Hyo indicator with Alerts and signal filters.
Ichimoku Trend Alert features: Optional check of Ichimoku cloud, Tenkan sen(Conversion Line), Kijun sen(Base Line), Senkou span A, Senkou span B, and Chikou span relative to price, and more. Popup, email, and phone notification alerts for selected symbols and timeframes.
There are 9 classic Ichimoku trend filters you can enable/disable in settings: Price/Cloud Order: Checks the price position relative to
FREE

The indicator trades during horizontal channel breakthroughs. It searches for prices exceeding extreme points or bouncing back and defines targets using customizable Fibo levels with a sound alert, which can be disabled if necessary. The indicator allows you to create a horizontal channel between the necessary extreme points in visual mode quickly and easily. It automatically applies your selected Fibo levels to these extreme points (if the appropriate option is enabled in the settings). Besides

推出 Market Structure Break Out for MT5 — 您的专业 MSB 和 Unbroken Zone 指标。 MT4 版本也已上线,请查看: https ://www .mql5 .com /en /market /product /109958 该指标正在持续更新。 我们努力提供基于市场结构的高精度进场和出场点。目前我们处于1.1版本,如果您现在加入我们,以下是最新的更改: 买入和卖出目标: 明确了解买入和卖出位置的最佳获利水平。 最后的MSB方向: 显示最新的市场结构突破方向,以帮助更好地决策。 增强的视觉模式: 使用新的美观模式自定义您的图表,包括亮色、暗色或个性化主题。 实时回测开关: 使用新的屏幕按钮轻松开启或关闭实时回测。 领取您的免费EA:
获取免费的 Market Structure Breakout EA ,它可以根据突破箭头自动开仓,使用固定手数,并可自定义止损和止盈水平。 如何领取:
点击此处下载 EA 。请注意,此 EA 仅在您已购买 Market Structure Break Out 指标 后才能

Volume Footprint Analysis is a precision-engineered, volume-based indicator that transforms raw market volume into an intuitive, color-coded signal system. Built on concepts from Volume Spread Analysis (VSA) and Smart Money principles, this tool removes the guesswork from volume interpretation and gives traders clear, actionable insights on when to buy or sell — on any timeframe and across any trading instrument. MT4 Version - https://www.mql5.com/en/market/product/138564/ Join To Learn Mark
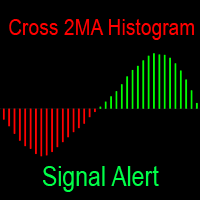
该指标以直方图的形式显示两个移动平均线之间的差异。 移动平均线有巨大的自定义选项。 当直方图的颜色发生变化时,它会以各种方式通知您:它在终端中发出蜂鸣声,向手机发送通知并向邮件发送电子邮件—现在您绝对不会错过任何交易。 一个完全免费的移动平均线交叉指标,以图表上的线条形式显示: https://www.mql5.com/zh/market/product/148478 你的反馈对我很重要。 反馈使发展变得更好,并帮助我们共同前进。 您有任何问题或想分享您的意见吗? 写评论或发送消息-我总是保持联系! 这个工具成为您可靠的助手,接管日常监控市场。 您可以将此任务委托给指标,而不是不断查看图表以预测相交时刻。 它不仅使用清晰的直方图列可视化趋势强度的动态,而且还充当看门狗,在最关键的时刻立即用强大的警报唤醒您。 这使您可以毫不拖延地采取行动,情绪和大惊小怪,严格遵循您的交易策略。 设置的灵活性为具有任何经验和分析方法的交易者提供了机会。 您可以通过将移动平均线周期与任何时间段和交易资产进行匹配来试验移动平均线周期,从分钟图表上的倒卖到长期投资。 该指标将同样有效地用于过滤信号和准确确定进入
FREE
ICONIC Reversal Engine 重质不重量。 只交易真正有意义的反转。 问题:噪音、过载、假信号 多数指标用一堆箭头把图表塞满,却忽略 语境 。
强势下跌中的锤子形态毫无意义;没有成交量配合的吞没只是陷阱。
结果:分析瘫痪、错过行情、代价高昂的错误。 解决方案:你的分析副驾驶 ICONIC Reversal Engine 不是“又一个箭头”。它会告诉你 为何 这个形态重要。
每个信号都经过 五阶段共振模型 的压力测试,并给出 0–100 分 的质量评分,让你一眼看出优劣,而不是只有“买/卖”。 核心能力 智能置信评分(0–100): 衡量共振强度。 >75 = A++ 顶级形态 。 五大共振支柱: 形态强度 —— 识别高价值的 1/2/3 根 K 线反转形态。 市场结构 —— 验证是否位于关键摆动高/低点。 趋势语境 —— 检查价格在关键 EMA 处的反应。 动能 —— 以 RSI 背离 / MACD 变化 进行确认。 成交量与波动 —— 关注市场参与度与 布林带 语境。 交互式 GUI 仪表盘: 简洁的图上“驾驶舱”,提供方向与精确价位( Entry、TP、SL )。可
FREE

An ICT fair value gap is a trading concept that identifies market imbalances based on a three-candle sequence. The middle candle has a large body while the adjacent candles have upper and lower wicks that do not overlap with the middle candle. This formation suggests that there is an imbalance where buying and selling powers are not equal. Settings Minimum size of FVG (pips) -> FVGs less than the indicated pips will be not be drawn Show touched FVGs Normal FVG color -> color of FVG that hasn't
FREE

The SuperTrend Strategy is a widely-used technical indicator based on the Average True Range (ATR), primarily employed as a trailing stop tool to identify prevailing market trends. The indicator is designed for ease of use while providing reliable insights into the current market trend. It operates based on two key parameters: the period and the multiplier . By default, it uses a period of 15 for the ATR calculation and a multiplier of 3 . The Average True Range (ATR) plays a crucial role in th
FREE

Benefits and Usage of the Volume Bubble Tool This tool, (one of my favorites by Algo Alpha, from Tradingview) provides an advanced method of volume analysis by moving beyond traditional histograms. It leverages statistical normalization (Z-score) on lower-timeframe data to identify and classify statistically significant volume events, visualizing the dynamic between "Smart Money" (institutional) and "Retail" participants. Core Benefits Intuitive On-Chart Visualization: By plotting volume as bub
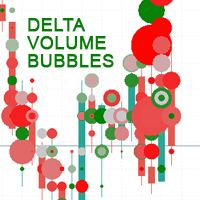
Delta Volume Bubbles is an advanced MetaTrader 5 indicator designed to visually display buy and sell pressure through dynamic, colored bubbles plotted directly on the price chart.
It calculates the net volume delta (difference between buy and sell volume) and represents it as bubbles of different sizes and colors giving traders a clear, intuitive picture of order flow activity. This indicator provides a visual form of order flow analysis , allowing traders to interpret market pressure even with
FREE

蜡烛计数器是一个指标,用于打印当天第一根蜡烛的蜡烛数量。 当天的第一根蜡烛将是数字 1,在此计数中,每根新蜡烛都会增加 1。
输入参数 从偶数、奇数或全部中选择 从蜡烛到打印数字的距离 文本字体大小 文字字体颜色
如果您仍有疑问,请通过直接消息与我联系: https://www.mql5.com/zh/users/robsjunqueira/ ----------------------------------------- 如果可能,请留下您的评论和评论,以帮助向社区传播信息。 还可以了解我们的其他指标和专家顾问。 我有几种有用的指标和专家顾问。 如果您有任何建议,请随时提出建议,这样我才能改进产品,使持续改进永无止境。
FREE

随机振荡器的多货币和多时间框架修改。 您可以在参数中指定任何所需的货币和时间范围。 该面板显示当前值和线的交点 - 信号线和主线(随机交叉)。 此外,该指标还可以在跨越超买和超卖水平时发送通知。 通过单击带有句点的单元格,将打开该符号和句点。 这是 MTF 扫描仪。 与货币强度计类似,仪表板可以自动选择包含指定货币的货币对,或以该货币为基础货币的货币对。该指标在“货币对集合”中指定的所有货币对中搜索货币;其他货币对将被忽略。并根据这些货币对计算该货币的总随机指标。您可以看到该货币的强弱程度。
默认情况下,从图表中隐藏仪表板的键是“D”.
参数 %K Period — K 线的周期。 %D Period — D 线的周期。 Slowing — 放慢; Method — 平均法; Price field — 价格类型。 Line of indicator — 线索引。 Clear the chart at startup — 启动时清除图表 Set of Pairs — 符号集: — Market Watch — 来自 MT 的“市场观察”的货币对。 — Specified ma

Understanding the levels of the previous day or week is very important information for your trading.
This indicateur allow to draw Previous day High/Low Previous week High/Low
Congifuration High & Low for: Previous day, week Line Style, color Label position, size, color Any questions or comments, send me a direct message here https://www.mql5.com/en/users/mvonline
FREE
您知道为什么MetaTrader市场是出售交易策略和技术指标的最佳场所吗?不需要广告或软件保护,没有支付的麻烦。一切都在MetaTrader市场提供。
您错过了交易机会:
- 免费交易应用程序
- 8,000+信号可供复制
- 探索金融市场的经济新闻
注册
登录