Technische Indikatoren für den MetaTrader 5 - 30

Alligator Window Indicator : Verbessern Sie Ihre Analysen in MetaTrader mit dem Alligator Window. Dieser Indikator platziert den klassischen Alligator von Bill Williams in einem separaten Fenster und ermöglicht so eine klarere und übersichtlichere Darstellung. Das Alligator-Fenster ist ideal für Händler, die Präzision und Effizienz bei ihren Operationen suchen. Es bietet klare Einblicke und macht es einfach, Trends zu erkennen, ohne den Hauptchart zu verschmutzen. Testen Sie es jetzt und bringen
FREE
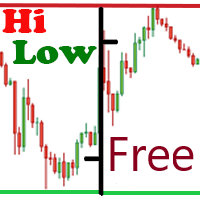
Die kostenlose Version des Hi Low Last Day Indikators . Der Indikator Hi Low Levels Last Day zeigt das Hoch und Tief des letzten Handelstages . Sie haben die Möglichkeit , die Farbe der Linien zu ändern . Testen Sie die vollständige Version des Hi Low Last Day Indikators , in der zusätzliche Indikator Funktionen zur Verfügung stehen : Anzeige des Minimums und des Maximums des vorletzten Tages Anzeige des Minimums und des Maximums der vorangegangenen Woche Tonsignal beim Überschreiten von max . u
FREE

VM SuperAshi Trend Präzisions-Trend Sniper mit geglättetem Heiken Ashi, Supertrend und EMA Trend
Optimiert für M1-M5 Scalping
Überblick VM SuperAshi Trend ist ein Indikator, der einen standardisierten Supertrend mit geglätteten Heiken-Ashi-Kerzen kombiniert, um klare, bestätigte und nicht nachmalende Kauf-/Verkaufssignale direkt auf dem Chart zu liefern. Er zeichnet automatisch Kauf-/Verkaufspfeile, zeigt Fast-, Slow- und Trend-EMA-Linien an und bietet Popup-, E-Mail- und Push-Benachrichtigunge

Gina Dual TPO - Kurzer MQL5-Indikator TPO + Volumenprofil auf dem Chart überlagert - schnell, skalierbar und einsteigerfreundlich. Gebaut für Händler, die Marktstruktur von POC und Value Area lesen. Was es ist Ein MQL5-Indikator, der zwei Marktprofile - Time-at-Price (TPO) und Volume-at-Price (VPO) - direkt auf Ihrem Chart überlagert. Er ist schnell (pixelbasiertes Zeichnen), skalierbar und anfängerfreundlich. Für wen ist es geeignet Intraday- und Swing-Trader, die die Marktstruktur über POC (P
FREE

Diese Supertrend-Strategie ermöglicht es Ihnen, bei einem Supertrend-Trendwechsel eine Long- oder Shortposition einzugehen. Sowohl die ATR-Periode als auch der ATR-Multiplikator sind einstellbar. Wenn Sie das Kontrollkästchen "ATR-Berechnungsmethode ändern" aktivieren, wird die Berechnung auf der Grundlage des SMA durchgeführt und Sie erhalten leicht abweichende Ergebnisse, die je nach Asset besser funktionieren können. Achten Sie darauf, dass Sie Slippage und Kommission in die Eigenschaften ein
FREE

Haben Sie Schwierigkeiten zu erkennen, wo die verschiedenen Forex-Sessions beginnen und enden? Oder erfordert Ihre Strategie, dass Sie nur in einer bestimmten Sitzung handeln? Dann ist dies genau das Richtige für Sie.
Der Sitzungsindikator schattiert die von Ihnen gewünschte Sitzung in einer bestimmten Farbe, so dass Sie sie leicht identifizieren können. Zu den angezeigten Sitzungen gehören: Londoner Sitzung, New Yorker Sitzung, Asiatische Sitzung, Überschneidung Asien - London und Überschneid
FREE
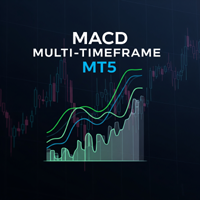
Der Multi-Frame MACD-Indikator ist ein robuster MetaTrader 5 (MT5) Indikator, der den Moving Average Convergence Divergence (MACD) nutzt, um Trends über mehrere Zeitrahmen hinweg zu analysieren. Dieser Indikator synchronisiert MACD-basierte Trendsignale aus bis zu neun Zeitrahmen (M1, M5, M15, M30, H1, H4, D1, W1, MN1) und präsentiert sie mit klaren visuellen Hinweisen, einschließlich einer farbigen MACD-Linie, Signalpfeilen und einem anpassbaren Dashboard. Perfekt für Händler, die Erkenntnisse
FREE

LongTerm — Indikator zur mittel- und langfristigen Trendrichtungsanalyse LongTerm ist ein Indikator zur Richtungsanalyse , der entwickelt wurde, um die Stärke und Qualität des mittel- bis langfristigen Trends zu interpretieren, mit einem klaren Fokus auf die Long-orientierte Analyse . Er ist kein Einstiegssignal und kein Timing-Indikator , sondern ein Analysewerkzeug, das dem Trader hilft zu verstehen, wann der Markt günstige oder ungünstige Bedingungen für einen Long-Trend bietet , indem es das
FREE
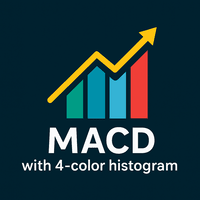
MACD mit 4-Farben-Histogramm Übersicht Der MACD mit 4-Farben-Histogramm ist ein modernes Upgrade des klassischen MACD-Indikators, der im Hinblick auf Klarheit, Präzision und visuelle Kraft neu gestaltet wurde.
Er bietet einen sofortigen Einblick in die Marktdynamik , Signalstärke und Trendumkehr mithilfe von vier verschiedenen Farbzonen, die Handelsentscheidungen schneller und sicherer machen. Farblogik Farbe Zustand Deutung Grün MACD > 0, Signal < MACD Bullisches Momentum verstärkt
FREE

Dieser Indikator ist ein sehr einfacher Indikator, der Candlesticks auf einem Chart zeichnet. Es ist jedoch möglich, nicht nur auf dem Hauptchart, sondern auch auf mehreren Untercharts zu zeichnen. Darüber hinaus ist es möglich, verschiedene Symbole und Zeitrahmen aus dem Hauptchart zu zeichnen. Merkmale. 1. beliebige Symbole 2. beliebige Zeitrahmen 3. zwei Kerzentypen (normal und Heikin Ashi) 4. viele Kerzenfarben (Schnittpunkt mit ma_1) 5. Pivot-Linie (ver1.2) Im Falle einer positiven Kerze, F
FREE

Session Finder - Verfolgen Sie Devisenmarkt-Sessions mit Präzision
Bleiben Sie dem Markt einen Schritt voraus mit Session Finder , einem schlanken Design im HUB-Stil für MetaTrader 5. Er bietet Echtzeiteinblicke in die wichtigsten Handelssitzungen der Welt - Sydney, Tokio, London und New York - so dass Sie immer wissen, welche Märkte geöffnet oder geschlossen sind oder sich bald ändern werden. Hauptmerkmale: Live-Sitzungsstatus: Sehen Sie auf einen Blick, ob eine Sitzung gerade geöffnet oder ge

Entfesseln Sie das Potenzial Ihres Tradings mit dem AlphaWave-Indikator! Der AlphaWave-Indikator wurde speziell entwickelt, um Ihrem Trading eine ruhige Hand zu verleihen. Durch die Glättung des Charts ermöglicht er eine präzise Lesbarkeit der Trendrichtung. Nie war es einfacher, klare Handelsentscheidungen zu treffen. Entscheiden Sie sich für Klarheit. Entfernen Sie den übermäßigen Indikatoren-Dschungel aus Ihrem Chart und nutzen Sie stattdessen die präzise Welle des AlphaWave-Indikators, um I

Touch VWAP ist ein Indikator, der es Ihnen ermöglicht, einen volumengewichteten Durchschnittspreis (VWAP) zu berechnen, indem Sie einfach die Taste "w" auf Ihrer Tastatur drücken und dann auf die Kerze klicken, die Sie berechnen möchten. Wenn Sie unter der Kerze klicken, wird der VWAP auf der Grundlage des Tiefstpreises mit dem Volumen berechnet, Wenn Sie auf den Kerzenkörper klicken, wird der VWAP auf der Grundlage des Durchschnittspreises und des Volumens berechnet, und wenn Sie auf die Kerze
FREE

Ein nützliches und praktisches Werkzeug für Händler bei der Analyse und Entscheidungsfindung.
Eigentümlichkeit
Das Hauptmerkmal dieses Indikators ist sein schneller Algorithmus . Der Geschwindigkeitsgewinn bei der Berechnung des Polynoms und seines Wertes der Standardabweichung im Vergleich zu klassischen Algorithmen erreicht mehrere tausend Mal. Außerdem enthält dieser Indikator einen Strategietester mit einer übersichtlichen Visualisierung der Transaktionen, einem Equity-Chart und der gleichz
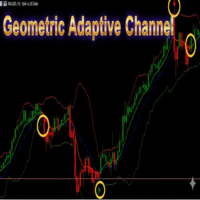
Geometrischer adaptiver Kanal MT5 von Grok(xAI)
*Ein adaptiver Kanal der nächsten Generation, der auf multiplikativer Geometrie und Spektralanalyse unter Verwendung der Diskreten Fourier-Transformation (DFT) basiert. HINWEIS: Der MA Gaussiana Indikator ist auch in den Screenshots zu sehen. ---
### Was ist es und wie funktioniert es? **Geometric Dynamic Channel MT5** ist ein **innovativer Channel-Indikator**, der **keine gleitenden Durchschnitte, RSI, MACD oder ATR** verwendet. Stattdessen wend
FREE

Wichtige Marktsitzungsinformationen auf einen Blick Hören Sie auf, mit mehreren Tools zu jonglieren und auf Zeitzonenumrechner zu schielen. Der SessionInfoDisplay-Indikator ist Ihr neuer, unentbehrlicher Trading-Pilot, der Ihnen Echtzeit-Marktinformationen direkt auf Ihrem Chart anzeigt. Was er leistet: Ihr unverzichtbares Trading-Dashboard Dieser intelligente Indikator liefert drei wichtige Informationen auf einen Blick: 1. Erkennung von Sitzungen in Echtzeit - Erkennt automatisch , welche wich
FREE

Dieser Indikator berechnet den Trend über zwei verschiedene gleitende Durchschnitte und zeichnet Zickzack-Trendlinien. Sie können die Einstellungen für schnelle und langsame gleitende Durchschnitte zur Anpassung ändern. Eingaben:
Schneller MA-Zeitraum: 64 Schnelle MA-Verschiebung: 0 Schnelle MA-Methode: Geglättet Fast MA Anwenden auf: Median Preis Langsamer MA-Zeitraum: 32 Langsame MA-Verschiebung: 0 Langsame MA-Methode: Geglättet Slow MA Anwenden auf: Median Preis ZigZag-Farbe: Rot Zickzack-Typ
FREE

Ratio X Trend Watcher - Fortgeschrittener Trendlinien-Ausbruchsindikator
Der Ratio X Trend Watcher ist ein professioneller Indikator, der das Kursgeschehen analysiert, Trendlinien auf dem aktuellen Chart-Zeitrahmen zeichnet und aussagekräftige Ausbrüche erkennt. Dieses Tool wurde für Händler entwickelt, die sich auf Unterstützungs- und Widerstandsniveaus verlassen. Es bietet klare visuelle Hinweise und optionale automatisierte Aktionen, um Ihre Handelsentscheidungen zu verbessern. Es wurde von
FREE
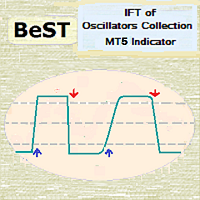
BeST_IFT of Oscillators Collection ist ein zusammengesetzter MT4/5-Indikator , der auf der IFT (Inverse Fisher Transformation ) basiert, die auf RSI- , CCI- , Stochastik- und DeMarker-Oszillatoren angewandt wird, um die besten Einstiegs- und Ausstiegspunkte bei der Verwendung dieser Oszillatoren in unserem Handel zu finden. Die IFT wurde erstmals von John Ehlers verwendet, um die Triggerpunkte bei der Verwendung eines beliebigen Oszillators klar zu definieren (TASC - Mai 2004 ). Alle Kauf- und

Der Indikator zeigt die Divergenz für jeden beliebigen benutzerdefinierten Indikator an. Sie müssen nur den Namen des Indikators angeben; standardmäßig wird DeMarker verwendet. Zusätzlich können Sie die Werte des ausgewählten Indikators glätten und Levels festlegen, bei deren Überschreitung ein Alarm ausgelöst wird. Der benutzerdefinierte Indikator muss kompiliert werden (eine Datei mit der Erweiterung ex5) und sich unter MQL5/Indicators des Client-Terminals oder in einem der Unterverzeichnisse
FREE
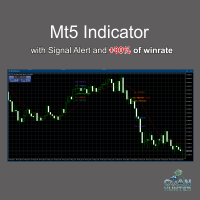
KOSTENLOSE VERSION FÜR GOLD (XAUUSD) UND BTCUSD Vergessen Sie nicht, diesen Indikator zu bewerten, nachdem Sie ihn benutzt haben.
Eigenschaften: Klare Buy/Sell-Marken mit Richtungspfeilen. Automatische Take Profit (TP) & Stop Loss (SL) Markierungen für ein besseres Risikomanagement. Leicht lesbare Chartsignale (keine unübersichtlichen Linien). Funktioniert mit jedem Zeitrahmen und jedem Vermögenswert ( Forex, Gold, Indizes, Krypto, Aktien). Kompatibel mit MetaTrader 5 (MT5 Desktop & Mobile Sy
FREE
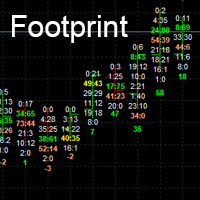
Footprint-Charts können Ihren Darstellungen eine Tiefe verleihen, die mit Standard-Charts nicht erreicht werden kann.
Footprint-Charts sind eine leistungsstarke Methode, um die Höhen und Tiefen des Marktes zu visualisieren und Ihnen zu helfen, bessere Handelsentscheidungen zu treffen. Orderflow Footprint in MT5. Zeigt die Anzahl der Marktaufträge bei jedem Tick.
Eingaben
Punkteskala *1 bis *10000
Anzahl der anzuzeigenden Kerzen. Schriftgröße Max Bid Farbe (Top Seller) Max Ask Farbe (Top Buyer)
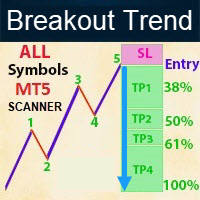
Kontaktieren Sie mich für Anleitungen und alle Fragen! - Lebenslanges kostenloses Update - Nicht nachgemalt - Ich verkaufe meine Produkte nur im Elif Kaya Profil, alle anderen Webseiten sind gestohlene alte Versionen, also keine neuen Updates oder Support. Einführung Breakout Trend Scanner Indikator arbeitet auf der Grundlage der Elliott-Welle in der technischen Analyse beschreibt Preisbewegungen auf dem Finanzmarkt, die mit Veränderungen in der Stimmung und Psychologie der Händler verbunden si

RS Zone ist ein Indikator, der verwendet wird, um die Unterstützungs- und Widerstandsniveaus jedes Vermögenswerts darzustellen. und jede Zeitperiode, wie wir sie festlegen Das Prinzip zur Berechnung der Unterstützungs- und Widerstandsniveaus basiert auf der Preisspanne (Range SR), um zu sehen, ob es Punkte gibt, an denen der Preis wiederholt auf diesem Preisniveau umkehrt oder nicht. Der Gesamttopf wird gleich der von uns festgelegten Gesamt-SR sein . Beispiel: Wenn Range SR gleich 120 ist, such
FREE
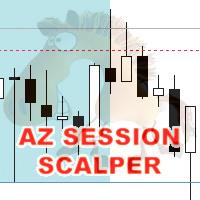
AZ Session Scalper
Ein kleiner, aber nützlicher Session-Indikator, der in erster Linie für das Scalping entwickelt wurde. Aktivieren Sie die Sitzung, in der Sie handeln möchten, beobachten Sie die Reaktion der M5/M15-Kerzen auf das Niveau der vorherigen Handelssitzung und steigen Sie ein. Wir achten immer auf die Reaktion der aktuellen Sitzung auf die vorherige. Wenn Sie zum Beispiel in Amerika handeln, aktivieren Sie die europäische Sitzung und beobachten Sie, wie eine Sitzung der anderen Liq
FREE

SessionRange-MT5-Ind ist ein Indikator für MetaTrader 5, der einen High/Low/Middle-Kanal basierend auf der gegebenen Handelssitzung erstellt. Indikator : Definiert die Session Range - erstellt einen Kanal basierend auf einem gegebenen High/Low Fenster Zeichnet drei Linien : SessionTop (blau) - maximale Session SessionMiddle (grau) - Mitte des Kanals SessionBottom (orange) - minimale Session Sitzungsmodus (Modus) : `Previous Day` - für klassische PDH/PDL (Vortagesbereich) Aktueller Tag" - für di
FREE

MonsterDash Harmonics Indicator ist ein Dashboard für harmonische Muster. Es erkennt alle wichtigen Muster. MonsterDash ist ein Dashboard, das alle erkannten Muster für alle Symbole und (fast) alle Zeitrahmen in einem sortierbaren und scrollbaren Format anzeigt. Benutzer können ihre eigenen benutzerdefinierten Muster hinzufügen. MonsterDash kann Charts mit den gefundenen Mustern öffnen und aktualisieren .
Einstellungen Die Standardeinstellungen von MonsterDash sind in den meisten Fällen gut gen

**"Multi Trendline Channel With Regression Bands" - Linearer Regressionskanal + Standardabweichungsband-Indikator (MT5)**
Dieser Indikator stellt automatisch mehrperiodige lineare Regressionskanäle zusammen mit Standardabweichungsbändern dar und bietet Händlern sofortige Klarheit über Trendrichtung, Preisstreuung und wichtige Unterstützungs-/Widerstandszonen. Durch die Umwandlung komplexer Analysen in einfache, intuitive Visualisierungen bietet er diskretionären Händlern einen klaren Marktkont
FREE
RSI Bollinger DualStrike Signals bietet einen klaren und strukturierten Ansatz zur Identifizierung von Bereichen, die für eine potenzielle Trendumkehr günstig sein könnten. Durch die Kombination des RSI mit den Bollinger Bändern hebt der Indikator Momente hervor, in denen der Preis Anzeichen von Druck oder Schwungverlust zeigt. Die KAUF-/VERKAUFssignale helfen Händlern, besser organisierte und diszipliniertere Entscheidungen zu treffen. Er ist ein nützliches Instrument für Scalping, Daytrading o
FREE

Hoch-Tief-Schwung (HLS)-Indikator
Der HLS-Indikator ist ein technisches Analysewerkzeug, das entwickelt wurde, um Swing-Hochs und -Tiefs auf dem Markt zu identifizieren und Swing-Tradern zu helfen, fundierte Entscheidungen zu treffen. Er bietet einen einstellbaren "Grad"-Parameter, mit dem Sie die Empfindlichkeit gegenüber starken Kursbewegungen auf der Grundlage der aktuellen Marktbedingungen anpassen können.
Merkmale:
- Klare Kauf-/Verkaufssignale: Der Indikator zeigt die Signale direkt auf d
FREE

Was sind Donchian-Kanäle? Donchian-Kanäle sind drei Linien, die durch Berechnungen des gleitenden Durchschnitts erzeugt werden und einen Indikator bilden, der aus oberen und unteren Bändern um einen Mittelwert oder ein mittleres Band herum besteht. Das obere Band markiert den höchsten Kurs eines Wertpapiers über N Perioden, während das untere Band den niedrigsten Kurs eines Wertpapiers über N Perioden markiert. Der Bereich zwischen dem oberen und dem unteren Band stellt den Donchian-Kanal dar. D
FREE

Der Indikator ist für die einfache Konstruktion von synthetischen Charts auf der Grundlage von Daten verschiedener Finanzinstrumente konzipiert. Er ist sowohl für den Arbitrage- und Paarhandel als auch für Analysezwecke nützlich. Sein Hauptvorteil ist die Einfachheit und Klarheit. Jedes Diagramm wird in Form einer gemeinsamen mathematischen Formel dargestellt. Wenn Sie beispielsweise den Spread (Unterschied) zwischen EURUSD und GBPUSD mit den Koeffizienten 4 und 3 darstellen möchten, geben Sie d
Swing High & Low Trendline Indicator ist ein professionelles Tool, das automatisch Swing-Punkte auf Ihrem Chart identifiziert und Trendlinien zur einfachen Visualisierung zeichnet.
Der Indikator hebt die wichtigsten Hochs und Tiefs auf der Grundlage der von Ihnen gewählten Einstellungen hervor und hilft Ihnen, die Marktstruktur zu analysieren und mit Vertrauen zu handeln. Merkmale: Automatische Erkennung von Swing-Hochs und Swing-Tiefs Zeichnet saubere Trendlinien direkt auf dem Chart F
FREE
Hallo Trader, Der Volume Spike Alert Indikator ist ein leichtgewichtiges, nicht verzögertes Tool, das Händlern helfen soll, ungewöhnliche Volumenaktivitäten in Echtzeit zu erkennen. Dieser Indikator berechnet das durchschnittliche Tick-Volumen über eine benutzerdefinierte Anzahl vorheriger Bars und vergleicht es mit dem Volumen der aktuellen Kerze . Wenn das aktuelle Volumen den Durchschnitt um einen bestimmten Prozentsatz übersteigt, löst der Indikator eine Warnung aus, die es Händlern ermöglic
FREE

Indikatoren sind für Trendfolger!
Ein Handelssystem, das aus drei gleitenden Durchschnitten aufgebaut ist. Handeln Sie mit dem Trend und lassen Sie die Gewinne laufen. Necessary for traders: tools and indicators Waves automatically calculate indicators, channel trend trading Perfect trend-wave automatic calculation channel calculation , MT4 Perfect trend-wave automatic calculation channel calculation , MT5 Local Trading copying Easy And Fast Copy , MT4 Easy And Fast Copy , MT5 Local Trading co
FREE

Hintergrund Vor einigen Jahren kam ich auf diese Seite, um einen Indikator für Binäroptionen zu finden. Wie viele Anfänger war ich zugleich selbstsicher und naiv – ich glaubte, den „heiligen Gral“ zu entdecken, der mir tägliche Gewinne garantiert, wenn ich nur den Pfeilen auf dem Bildschirm folge. Ich testete Hunderte Indikatoren, kostenpflichtig und kostenlos. Keiner lieferte dauerhaft positive Ergebnisse. Mit der Zeit kehrte ich zurück – nicht mehr als Neuling, sondern als jemand, der den ganz

Momentum Maxwell V1 PRO: Der Scharfschütze Hybrid Energy Momentum Maxwell V1 PRO ist kein herkömmlicher Oszillator, sondern ein ballistisches Präzisionswerkzeug für den Trader, der wie ein Scharfschütze agiert. Während Standardindikatoren im Marktrauschen untergehen, verwendet der Maxwell V1 PRO eine dreifache Energiefilterung, um Preiserschöpfungen mit chirurgischer Schärfe zu erkennen. Anders als der RSI oder die Stochastik, die ihre Daten auf eine künstliche 0-100-Skala beschränken, verwendet
FREE

New Candle Alert ist ein einfacher Indikator, der Sie benachrichtigt, wenn sich eine neue Kerze bildet. Funktionen : Alarmtyp - Option zur Auswahl zwischen Meldung mit Ton oder nur Ton. Nachricht - Warnmeldung . Push-Benachrichtigungen - aktivieren Sie Push-Benachrichtigungen. Zeitrahmen anzeigen - zeigt den Zeitrahmen des Symbols an. Stunde anzeigen - zeigt die Alarmzeit an . Testmeldung - wenn Sie nicht warten wollen, bis sich eine neue Kerze gebildet hat, um die Meldung zu sehen. MT4-Version:
FREE

SigmaScore XAUUSD M5 - Mean Reversion Signalindikator
SigmaScore XAUUSD M5 ist ein professioneller Mean-Reversion-Signalindikator, der speziell für XAUUSD (Gold) auf dem M5-Zeitrahmen entwickelt wurde. Er basiert auf der statistischen Abweichung (Z-Score / Sigma) und identifiziert mit hoher Wahrscheinlichkeit Erschöpfungszonen, in denen der Preis wahrscheinlich zurückgehen wird.
Dieser Indikator ist KEIN Scalper und KEIN Trendfolgemodell. Er konzentriert sich auf kontrollierte Extremwerte, ni
FREE

Magischer Trend
Dieser MT5-Indikator ist ein Gleitender Durchschnitt mit 3 Signalfarben. Die 3 Eingabeparameter dieses Indikators geben Ihnen die Möglichkeit, einen gleitenden Durchschnitt Ihrer Wahl einzustellen. Eine Kombination aus 2 verschiedenen exponentiellen gleitenden Durchschnitten, dem Relative-Stärke-Index, dem Commodity-Channel-Index und dem William's Percent Range liefert die Signale.
Weiße Farbe = Null/Nein/Ausstiegssignal Grüne Farbe = Kaufsignal Rote Farbe = Verkaufssignal
Hi
FREE

Das Jackson Auto-Candlestick-Muster . Es ist ein leistungsfähiges Preis-Action-Tool , das automatisch erkennen und alarmieren eine versteckte leistungsstarke Candlestick-Muster . Es kommt mit einigen verschiedenen Chart-Skins. Sie können diesen Indikator allein verwenden, um Gewinn zu machen, aber es mächtig, wenn Sie es mit Trendlinien kombinieren, können Sie die Jackson Auto Trendlines kostenlos herunterladen Link: UCRW695l9Wgg2ucnnf5DL5Vw Liste der erkannten Candlestick-Muster 1. Bullish & Be
FREE

Der Market Steps-Indikator wurde auf der Grundlage von Gann-Zeit/Kurs-Korrelationen entwickelt und durch Price Action-spezifische Regeln für den Devisenmarkt optimiert. Er nutzt die Konzepte des Market Order Flow, um potenzielle Preiszonen für ein hohes Auftragsvolumen vorherzusagen.
Indicator Levels kann für den Handel selbst oder als Kombination zum Filtern von falschen Signalen anderer Strategien/Indikatoren verwendet werden. Jeder Trader braucht ein solch leistungsstarkes Tool, um Multi-T
Der KT Trend Reversal Probability Indikator berechnet in Echtzeit die Wahrscheinlichkeit eines Trendwechsels basierend auf einem verfeinerten RSI-Algorithmus. Diese Wahrscheinlichkeit wird als klarer Prozentwert angezeigt und hilft dir dabei, einzuschätzen, ob ein aktueller Trend an Stärke verliert oder ob sich ein neuer bildet. Egal ob du deine Einstiege planst oder deine Ausstiege optimierst – dieser Indikator verschafft dir einen datengestützten Vorteil bei deinen Trading-Entscheidungen.
Fu

Im Handelssystem "Masters of Risk" bezieht sich eines der wichtigsten Konzepte auf Orte, an denen die Märkte ihre Richtung ändern. Dabei handelt es sich um eine Änderung der Prioritäten und eine Verletzung der Trendstruktur an den Extremen des Marktes, wo angeblich Stop-Losses von "intelligenten" Teilnehmern, die sich außerhalb der Grenzen der Volumenakkumulation befinden, vorhanden sind oder sein würden. Aus diesem Grund nennen wir sie "Reversal Patterns" - Orte mit viel Gewicht für den Beginn
Gold Flux Signal Pro ist ein fortschrittlicher MT5-Indikator mit Multi-Timeframe-Logik, Candle Timer & strukturiertem Signalpanel Intelligenter Scalping- und Swing-Indikator für MT5
Dieser MT5-Indikator wurde für Trader entwickelt, die Wert auf Klarheit, Struktur und Präzision bei der Entscheidungsfindung legen. Er bietet eine saubere Visualisierung von Kauf- und Verkaufssignalen unter Verwendung eines stabilen Logiksystems, das entwickelt wurde, um die Konsistenz nach Kerzenschluss zu erhalten

TickVelocity mit Smart Alert : Echtzeit-Dominanz von Käufern und Verkäufern **️ Entdecken Sie die rohe Energie des Marktes mit dem TickVelocity with Smart Alert Indikator. Gehen Sie über das Standardvolumen und die Preisaktion hinaus und messen Sie die Geschwindigkeit und das Momentum von Preisänderungen, um die wahre zugrunde liegende Dominanz von Käufern oder Verkäufern in Echtzeit zu erkennen. Dieses unverzichtbare Tool bietet einen klaren, separaten Überblick über die Marktdynamik und v
FREE

Dieser Indikator zeigt die aktuelle Hauptunterstützung und den Widerstand an, falls vorhanden. Und wenn eine Unterstützung oder ein Widerstand durchbrochen wird, zeigt er die neue Strömung an, falls vorhanden. Zur Identifizierung von Unterstützungs- und Widerstandspunkten werden die im aktuellen Chart identifizierten Hoch- und Tiefpunkte verwendet. Sie können auch die maximale Anzahl von Balken angeben, die verwendet werden, um einen Unterstützungs- oder Widerstandspunkt als noch gültig zu betr
FREE

Sehr einfacher, aber leistungsstarker Indikator, der Sie jedes Mal benachrichtigt, wenn eine Kerze Ihre Trendlinie, horizontale Linie und/oder Ihr Rechteck berührt. Leistungsstarker Indikator und doch sehr einfach zu bedienen! Alles, was Sie tun müssen, ist, Ihre MT5-Trendlinien, horizontalen Linien und/oder Rechtecke zu zeichnen, und SmartLine benachrichtigt Sie, sobald der aktuelle Kurs eines Ihrer Schlüsselniveaus berührt! Ein Kinderspiel Wenn Sie den Indikator mögen, hinterlassen Sie bitte e
FREE
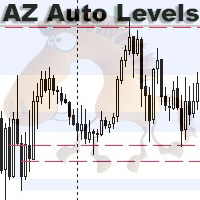
AZ Auto Levels builder ATR edition Indikator für das automatische Zeichnen von Pegeln. Für verschiedene Instrumente müssen Sie mit den Parametern spielen, um die richtigen zu finden. Die Idee dahinter ist, dass der Indikator auf dem in den Einstellungen gewählten Zeitrahmen (standardmäßig H1) nach interessanten Levels sucht. Die Suche erfolgt nur bei Kerzen, die 30 % über der täglichen Standard-ATR ähnlicher Kerzen liegen (Sie können dies in den Einstellungen ändern). Die ATR wird für die letzte
FREE
Super Strike - Das ultimative Trend-Präzisionssystem
Super Strike ist ein fortschrittliches Trendfolgesystem, das die bewährte Genauigkeit des SuperTrend-Algorithmus mit der Filterleistung eines dynamischen gleitenden Durchschnitts kombiniert. Dieser Indikator wurde für Händler entwickelt, die Präzision und Vertrauen verlangen, und verwandelt rohe Kursbewegungen in ein sauberes, intuitives und hochinformatives visuelles System - ein komplettes Rahmenwerk, um intelligentere Handelsentscheidunge
FREE

1. Überblick Der Turtle Trade Channels ist ein umfassendes technisches Analysetool für MetaTrader 5, das auf den Grundprinzipien des klassischen Turtle Trading-Systems basiert. Dieser Indikator wurde entwickelt, um Händlern zu helfen, signifikante Kursbewegungen zu erkennen, indem er dynamische Preiskanäle aufzeichnet, die potenzielle Kanalausbrüche und Umkehrungen hervorheben. Die Methodik basiert auf Kanalausbrüchen: Ein Kanalausbruch nach oben wird angezeigt, wenn der Kurs über den oberen Kan
FREE
Der KT Liquidity Sweep Filter identifiziert und markiert kritische Liquiditätszonen. Er kombiniert diese Zonen mit klaren Preisreaktionen sowie einem adaptiven Trendfilter, um präzise Kauf- und Verkaufssignale zu generieren, die mit dem aktuellen Marktrend übereinstimmen. Er unterscheidet zwischen großen und kleinen Liquiditätssweep-Zonen. Große Zonen werden mit großen Pfeilen gekennzeichnet, kleinere mit kleinen Pfeilen, um eine einfache visuelle Unterscheidung zu ermöglichen. Große Pfeile: Wei
True TrendLines MT5 - Intelligente Trenderkennung und Warnungen Überblick True TrendLines MT5 ist ein professionelles technisches Analysetool, das automatisch Trendlinien mit hoher Wahrscheinlichkeit auf Ihren MetaTrader 5-Charts identifiziert und einzeichnet. Mit Hilfe eines ausgeklügelten Algorithmus zur Erkennung von Umkehrpunkten hilft es Händlern, die wichtigsten Marktstrukturen und potenzielle Umkehrpunkte präzise zu visualisieren. Hauptmerkmale Automatische Trendlinien-Erkennung Ident
FREE

SuperTrend Plus Dema - Schnellere Trends, weniger Rauschen SuperTrend Plus Dema ist eine Weiterentwicklung des klassischen Trendfolgemessers. Im Gegensatz zu den Standard-SuperTrend-Indikatoren, die sich ausschließlich auf Hoch/Tief- oder Schlusskurse stützen, integriert dieses Tool den Double Exponential Moving Average (DEMA) als Berechnungsquelle. Diese einzigartige Kombination bietet eine glattere Trendlinie mit deutlich geringerer Verzögerung, die es Ihnen ermöglicht, Trends früher zu erkenn
FREE

Neo Fork v5 wurde für das Handelssystem "Oracle" entwickelt, wurde aber nach und nach ergänzt, z.B. mit Gann-Winkeln und anderen Optionen.... Sie können grafische Objekte mit bestimmter Farbe, Stil und Dicke erstellen, wie z.B.: Rechtecke mit und ohne Füllung, Trendliniensegmente und ein nicht standardisiertes Werkzeug - "Neo Fork" in Form eines Dreizacks, sowie es gibt eine Möglichkeit, interaktiv die Farbpalette direkt aus dem Chart anzupassen, die Sichtbarkeit von Objekten für verschiedene TF
FREE

Der selektive Pin-Balken dient dazu, Umkehrungen zu erkennen. Um den selektiven Pin Bar effektiv zu nutzen, suchen Händler in der Regel nach einer starken Ablehnung: Der Schwanz des Pin Bar sollte deutlich über die umgebende Kursbewegung hinausgehen. Dies deutet darauf hin, dass höhere oder niedrigere Kurse während des Handelszeitraums scharf zurückgewiesen wurden. Eine starke Ablehnung deutet darauf hin, dass sich die Marktstimmung ändern könnte.
FREE

Gold Master Indikator MT5 Professionelles Gold-Signalsystem Dieser fortschrittliche Indikator wurde speziell für den Handel mit Gold (XAU) entwickelt und optimiert. Er nutzt einen technischen Ansatz, bei dem Trend, Momentum, Volumen, Marktstruktur (S/R) und Multi-Timeframe-Validierung zusammenspielen . Er ist das ideale Instrument für Händler, die der Signalqualität und der Reduzierung des operativen Rauschens Vorrang vor der schieren Quantität der Einträge einräumen. 1. Funktioneller Überblick

TransitGhost Signal Indikator, das ist einer meiner besten Forex-Handelsstrategie. Die Strategie basiert auf der einfachen gleitenden Durchschnitt kreuzen, 5 SMA und 200 SMA, von denen eine längere Zeit dauern, zu kreuzen. Wann immer sich der 5 SMA und der 200 SMA kreuzen, wird ein Signal gegeben. Wenn der 5 SMA den 200 SMA nach oben kreuzt, erscheint ein Kaufpfeil auf dem Chart und eine Push-Benachrichtigung (Alarm) "Buy now, use proper risk management" wird sowohl auf dem MT5 PC als auch auf d
FREE

"Während unsere kostenlosen Indikatoren eine solide Grundlage bilden, bieten unsere kostenpflichtigen Produkte fortschrittliche neuronale Filter und automatisierte Risikomanagement-Funktionen, die Ihnen helfen, Ihre Handelskonsistenz zu verbessern. Verbessern Sie Ihren Vorsprung noch heute, indem Sie unseren Spezialkatalog für professionelle EAs und Indikatoren besuchen." Accuracy M1 Scalper ist ein Hochleistungsindikator, der speziell für Trader entwickelt wurde, die auf niedrigeren Zeitrahmen
FREE
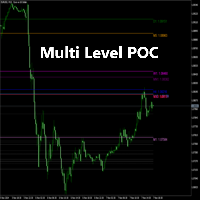
Ausführliche Beschreibung:
Der Multi Level POC Indikator wurde für Händler entwickelt, die kritische Preisniveaus auf der Grundlage von Volumenanalysen über mehrere Zeitrahmen hinweg identifizieren wollen. Hauptmerkmale:
Multi-Timeframe POC-Berechnung: Berechnet und zeigt automatisch den POC für mehrere Zeitrahmen an, einschließlich M1, M5, H1, D1 und mehr. Anzeige von Zwischenebenen: Zusätzlich zu den primären POC-Levels zeigt der Indikator auch Zwischenlevels an, die auf dem POC basieren. Be
FREE

Dieser Indikator markiert die 50%-Marke jeder Kerze. Er wird Ihnen helfen, profitable Scalping-Trades zu machen. Wenn die nächste Kerze oberhalb der 50%-Marke der vorherigen Kerze eröffnet, sollten Sie eine KAUF-Position eröffnen, und wenn die nächste Kerze unterhalb der 50%-Marke der vorherigen Kerze eröffnet, sollten Sie eine VERKAUF-Position eröffnen. Diese Strategie ist sehr profitabel. Um das Beste daraus zu machen, sollten Sie die Kerzenkontexte auf der linken Seite im Auge behalten. Viel
FREE
Haben Sie es satt, Ihre Kontohistorie zu durchforsten, um geschlossene Handelsgewinne zu verfolgen? Der Draw Profit-Indikator von Bo.Botfx revolutioniert die Art und Weise, wie Sie Ihre Handelsperformance visualisieren! Dieser intuitive und leistungsstarke Indikator zeichnet automatisch den Gewinn (oder Verlust) Ihrer geschlossenen Orders direkt in Ihren Chart . Kein Rätselraten oder mühsame Berechnungen mehr - mit Draw Profit sehen Sie sofort das genaue Ergebnis jedes Trades, genau dort, wo es
FREE

Wenn Ihnen dieses Produkt gefällt, geben Sie ihm bitte eine 5-Sterne-Bewertung als Zeichen der Wertschätzung.
Dieser Indikator zeichnet vertikale Linien, die die wichtigsten Devisenhandelssitzungen (Asien, London, New York) für eine konfigurierbare Anzahl von vergangenen Tagen markieren . Diese "Silver Bullet"-Linien helfen Händlern, die Start- und Endzeiten der Sitzungen im Chart schnell zu erkennen.
Anzuzeigende Tage: Wie viele Sitzungslinien der vergangenen Tage angezeigt werden sollen. Sitz
FREE

Der SMTrendLine-Indikator basiert auf den Prinzipien der grafischen Konstruktion von Bollinger-Bändern.
Grafisch gesehen handelt es sich bei den Bollinger Bändern um zwei Linien, die die Preisdynamik von oben bzw. von unten begrenzen. Es handelt sich dabei um eine Art Unterstützungs- und Widerstandslinien, die sich meist auf weit vom Kurs entfernten Ebenen befinden.
Wie wir wissen, sind die Bollinger-Bänder den Umschlägen der gleitenden Durchschnitte ähnlich. Der Unterschied zwischen ihnen be
FREE

Buyer Seller Balance Analyzer bietet einen umfassenden Überblick über die Stärke von Käufern und Verkäufern über mehrere Zeitrahmen hinweg. Hauptkomponenten: Buyer/Seller Balance Tabelle Zeigt das Verhältnis von Käufern und Verkäufern Deckt Zeitrahmen von M1 bis MN1 ab Farblich gekennzeichnete Werte (grün = Käufer, rot = Verkäufer) Wichtige Kennzahlen: Buyers (%) – Anteil der Käufer Sellers (%) – Anteil der Verkäufer ️ Balance – Unterschied zwischen Käufern und Verkäuf
Williams Fr actals (v2 ) — klarere Sign ale , weniger R auschen Optim ierter Fr aktal ‑Indik ator : mark iert bestät igte Hoch s/Tiefs , bere chnet nur auf neuen Kerzen und filter t per ATR und Cluster ‑Logik . H auptmer kmale Le istung : Bere chnung auf neuen Ker zen ; Voll‑Re calc nur bei Bedarf Saubere Pfeile : Farben , Größe und Abstand kon figurier bar Filter (optional ) : ATR ‑Ab stand und stärkstes Frakt al im Cluster Multi ‑TF : aktueller oder gewähl ter Z
ICONIC TITAN SIGNAL v1.6
„Handle nicht wie die Masse – handle wie eine Legende.“
Der ICONIC TITAN SIGNAL ist mehr als ein Indikator. Er ist dein persönlicher Mentor. Dein Scanner. Dein Signalgeber. Ein hybrides Meisterwerk aus Markterfahrung, mathematischer Logik und institutioneller Präzision – entwickelt für alle, die den Anspruch haben, nicht nur zu traden, sondern zu dominieren.
Was macht der ICONIC TITAN?
Er filtert 24/7 das Marktchaos in den vier relevantesten Märkten der Welt:
XAU

Bollinger Alerts ist ein klassischer Bollinger-Bänder-Indikator, erweitert um ein intelligentes Alarmsystem, das Tradern hilft, überkaufte und überverkaufte Marktbedingungen klar zu erkennen. Der Indikator stellt die drei traditionellen Bänder dar: Oberes Band
Mittleres Band (Gleitender Durchschnitt)
Unteres Band Zusätzlich verfügt er über konfigurierbare Alarme, die den Trader automatisch benachrichtigen, sobald der Preis statistisch extreme Bereiche erreicht. Integriertes Alarmsystem Alarme we

Quantopro Plus: Steigern Sie Ihren Handelserfolg Entfesseln Sie die Kraft der Präzision mit Quantopro , dem ultimativen Handelsindikator für MetaTrader 5, der das Marktchaos in profitable Gelegenheiten verwandelt. Quantopro wurde mit einer hochmodernen, proprietären Formel entwickelt und liefert kristallklare Kauf- und Verkaufssignale, die es Händlern aller Ebenen ermöglichen, die Märkte mit Zuversicht zu beherrschen. Warum Quantopro wählen? Dynamische Signalmalerei : Erkennen Sie sofort wahrsch
FREE

Handelssignale mit 98 % Genauigkeit Präzise Einstiege, klare Ausstiege | Mehrere Zeitrahmen | Alle Märkte
So funktioniert es in 3 einfachen Schritten 1️⃣ HANDEL EINFÜHREN (Kauf-/Verkaufsregeln) Signalauslöser: Zwei Linien (X) kreuzen sich außerhalb der farbigen Zone (rot für Kauf/blau für Verkauf).
Bestätigung: Die Preiskerze muss das Kreuz berühren (während oder innerhalb von 1–5 Kerzen danach).
Alternativer Einstieg (Keine Berührung):
Verkaufssignal (Blaue Zone): Der Kurs bleibt über dem K
Erfahren Sie, wie man einen Handelsroboter im MetaTrader AppStore, dem Shop für Applikationen für die MetaTrader Handelsplattform, kaufen kann.
Das Zahlungssystem der MQL5.community ermöglicht Zahlungen mit PayPal, Kreditkarten und den gängigen Zahlungssystemen. Wir empfehlen Ihnen eindringlich, Handelsroboter vor dem Kauf zu testen, um eine bessere Vorstellung von dem Produkt zu bekommen.
Sie verpassen Handelsmöglichkeiten:
- Freie Handelsapplikationen
- Über 8.000 Signale zum Kopieren
- Wirtschaftsnachrichten für die Lage an den Finanzmärkte
Registrierung
Einloggen
Wenn Sie kein Benutzerkonto haben, registrieren Sie sich
Erlauben Sie die Verwendung von Cookies, um sich auf der Website MQL5.com anzumelden.
Bitte aktivieren Sie die notwendige Einstellung in Ihrem Browser, da Sie sich sonst nicht einloggen können.