Technische Indikatoren für den MetaTrader 5 - 32

Hochgradig konfigurierbarer Adx-Indikator.
Merkmale: Hochgradig anpassbare Alarmfunktionen (bei Levels, Kreuzen, Richtungsänderungen per E-Mail, Push, Sound, Popup) Multi-Timeframe-Fähigkeit Farbanpassung (bei Pegeln, Kreuzen, Richtungsänderungen) Optionen für lineare Interpolation und Histogramm-Modus Funktioniert im Strategie-Tester im Multi-Timeframe-Modus (auch am Wochenende ohne Ticks) Einstellbare Levels Parameter:
ADX Timeframe : Sie können die unteren/höheren Timeframes für Adx einstel
FREE

RS Zone ist ein Indikator, der verwendet wird, um die Unterstützungs- und Widerstandsniveaus jedes Vermögenswerts darzustellen. und jede Zeitperiode, wie wir sie festlegen Das Prinzip zur Berechnung der Unterstützungs- und Widerstandsniveaus basiert auf der Preisspanne (Range SR), um zu sehen, ob es Punkte gibt, an denen der Preis wiederholt auf diesem Preisniveau umkehrt oder nicht. Der Gesamttopf wird gleich der von uns festgelegten Gesamt-SR sein . Beispiel: Wenn Range SR gleich 120 ist, such
FREE

Alligator Window Indicator : Verbessern Sie Ihre Analysen in MetaTrader mit dem Alligator Window. Dieser Indikator platziert den klassischen Alligator von Bill Williams in einem separaten Fenster und ermöglicht so eine klarere und übersichtlichere Darstellung. Das Alligator-Fenster ist ideal für Händler, die Präzision und Effizienz bei ihren Operationen suchen. Es bietet klare Einblicke und macht es einfach, Trends zu erkennen, ohne den Hauptchart zu verschmutzen. Testen Sie es jetzt und bringen
FREE

Wenn Ihnen dieses Produkt gefällt, geben Sie ihm bitte eine 5-Sterne-Bewertung als Zeichen der Wertschätzung.
Dieser Indikator berechnet und zeichnet Pivot-Punkte und Unterstützungs-/Widerstandsniveaus sowohl für den täglichen als auch für den wöchentlichen Zeitrahmen: Pivot (zentrales) Niveau Unterstützungsniveaus S1, S2, S3 Widerstandsniveaus R1, R2, R3 Es ermöglicht die Anzeige von täglichen, wöchentlichen oder beiden Sets von Pivots , um Händlern visuelle Referenzen für potentielle Unterstüt
FREE

Der Stretch ist ein Toby-Crabbel-Preis-Muster , das die minimale durchschnittliche Preisbewegung/Abweichung vom Eröffnungskurs während eines bestimmten Zeitraums darstellt und zur Berechnung von zwei Ausbruchsniveaus für jeden einzelnen Handelstag verwendet wird. Zur Berechnung wird der 10-Perioden-SMA der absoluten Differenz zwischen dem Eröffnungskurs und dem Höchst- oder Tiefstkurs herangezogen, je nachdem, welche Differenz kleiner ist. Dieser Wert wird zur Berechnung der Ausbruchsschwellen f
FREE
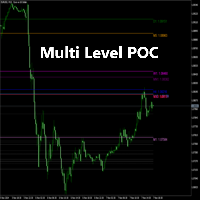
Ausführliche Beschreibung:
Der Multi Level POC Indikator wurde für Händler entwickelt, die kritische Preisniveaus auf der Grundlage von Volumenanalysen über mehrere Zeitrahmen hinweg identifizieren wollen. Hauptmerkmale:
Multi-Timeframe POC-Berechnung: Berechnet und zeigt automatisch den POC für mehrere Zeitrahmen an, einschließlich M1, M5, H1, D1 und mehr. Anzeige von Zwischenebenen: Zusätzlich zu den primären POC-Levels zeigt der Indikator auch Zwischenlevels an, die auf dem POC basieren. Be
FREE

Zeigt einen USD DXY Chart in einem separaten Fenster unterhalb des Hauptcharts an. IHR BROKER MUSS DIESE SYMBOLE HABEN, DAMIT DER INDIKATOR FUNKTIONIERT Basierend auf EUR/USD, USD/JPY, GBP/USD, USD/CAD, USD/CHF und USD/SEK Alle diese Paare müssen zu Market Watch hinzugefügt werden, damit der Indikator korrekt funktioniert Da der Indikator mit einer Formel berechnet wird, die auf den 6 Paaren basiert, funktioniert er nur, wenn der Markt geöffnet ist.
IHR BROKER MUSS DIESE SYMBOLE HABEN, DAMIT DE
FREE
S 500 Precision Block Indikator – Deine kostenlose Order Block Visualisierung Dieser Indikator zeigt dir präzise bullische und bärische Order Blocks auf S&P 500 M30-Charts an – extrahiert aus unserem bewährten "S 500 Precision Block" EA. Erlebe pure Price Action und verbessere deine Marktübersicht. Wichtiger Hinweis: Dieser Indikator wurde speziell für S&P 500-Symbole auf dem M30-Zeitrahmen entwickelt und optimiert. Seine zuverlässige Funktion ist ausschließlich in dieser spezifischen Konfigurat
FREE

การพิจารณาคุณลักษณะ HUD ขณะนี้ผมกำลังมุ่งเน้นไปที่คำอธิบายภาษาอังกฤษสำหรับแดชบอร์ด GAPHUNTER UAD รุ่น Compact HUD ผมกำลังวิเคราะห์คุณสมบัติหลักของรุ่นนี้โดยเฉพาะ เป้าหมายของผมคือการสร้างคำอธิบายผลิตภัณฑ์ที่แสดงจุดขายและประโยชน์ที่เป็นเอกลักษณ์อย่างชัดเจนสำหรับกลุ่มเป้าหมาย เป้าหมายคือการเน้นย้ำถึงความกะทัดรัดและการใช้งาน การวิเคราะห์คุณสมบัติหลัก ตอนนี้ ผมกำลังเจาะลึกฟีเจอร์สำคัญๆ มากขึ้น โดยเฉพาะอย่างยิ่งในบริบทของผู้ใช้ MQL5 Market โดยเน้นที่การติดตามกำไร/ขาดทุนแบบเรียลไทม์ของ Kompaktes HUD แ
FREE

Haben Sie Schwierigkeiten zu erkennen, wo die verschiedenen Forex-Sessions beginnen und enden? Oder erfordert Ihre Strategie, dass Sie nur in einer bestimmten Sitzung handeln? Dann ist dies genau das Richtige für Sie.
Der Sitzungsindikator schattiert die von Ihnen gewünschte Sitzung in einer bestimmten Farbe, so dass Sie sie leicht identifizieren können. Zu den angezeigten Sitzungen gehören: Londoner Sitzung, New Yorker Sitzung, Asiatische Sitzung, Überschneidung Asien - London und Überschneid
FREE

SuperTrend Plus Dema - Schnellere Trends, weniger Rauschen SuperTrend Plus Dema ist eine Weiterentwicklung des klassischen Trendfolgemessers. Im Gegensatz zu den Standard-SuperTrend-Indikatoren, die sich ausschließlich auf Hoch/Tief- oder Schlusskurse stützen, integriert dieses Tool den Double Exponential Moving Average (DEMA) als Berechnungsquelle. Diese einzigartige Kombination bietet eine glattere Trendlinie mit deutlich geringerer Verzögerung, die es Ihnen ermöglicht, Trends früher zu erkenn
FREE
1. Einführung Squeeze Momentum Plus ist ein leistungsstarkes technisches Analyseinstrument, das Händlern helfen soll, Perioden geringer Marktvolatilität (die "Squeeze"-Phase) zu erkennen und die Richtung und Stärke des Kursmomentums zu beurteilen. Dieser Indikator kombiniert die Prinzipien der Bollinger Bänder und Keltner-Kanäle, um Veränderungen in der Marktvolatilität zu erkennen, mit einem Momentum-Oszillator zur Messung des Kauf-/Verkaufsdrucks. 2. Hauptkomponenten des Indikators Der Squeeze
FREE

Der "Envelope of Adaptive Moving Average" Indikator ist ein Tool, das Ihnen dabei hilft, fundierte Entscheidungen auf dem Finanzmarkt zu treffen. Er wurde entwickelt, um Ihnen eine klare Vorstellung von der Trendrichtung und den möglichen Ein- und Ausstiegspunkten in Ihren Trades zu vermitteln.
Dieser Indikator basiert auf einem adaptiven gleitenden Durchschnitt, was bedeutet, dass er sich automatisch an Veränderungen in der Marktvolatilität anpasst. Dies macht ihn besonders nützlich in Märkten
FREE

Entdecken Sie die Geheimnisse, die die großen Marktteilnehmer Ihnen vorenthalten wollen. Haben Sie sich jemals gefragt, ob die Markt- „Wale“ immer zur gleichen Zeit und in die gleiche Richtung einsteigen? Dieser Indikator zeigt es Ihnen. Er liefert keine direkten Einstiegssignale, aber er enthüllt historische Bewegungsmuster nach Stunden oder Tagen , die normalerweise unbemerkt bleiben würden. Sie könnten beispielsweise feststellen, dass der EURUSD donnerstags um 15:00 Uhr eine 80%ige Wahrschein
FREE

Fair Value Gaps (FVG) und Liquiditätslücken sind Preisbereiche, die Sie für bessere Ein- und Ausstiege bei Ihren Geschäften ausnutzen können. Sie sind ähnliche Konzepte, also lassen Sie uns sie von oben betrachten und aufschlüsseln. Betrachten Sie FVG und Liquiditätslücken als Schwachstellen auf dem Markt. Sie sind der Weg des geringsten Widerstands. Das bedeutet nicht, dass der Preis durch sie hindurchgehen wird, aber der Preis könnte leichter durch sie hindurchgehen.
Um sie zu finden und zu
FREE

Der klassische Fraktal-Indikator ist zeitverzögert, da man 2 Balken abwarten muss, um die Fraktalbildung zu bestätigen. Wenn dies vermieden wird, wird der Indikator neu gezeichnet, d.h. wenn das Maximum/Minimum innerhalb von 2 Takten aktualisiert wird, wird das Fraktal seine Position zu einem späteren Zeitpunkt ändern. In diesem Produkt werden diese beiden Nachteile so weit wie möglich ausgeglichen und gleichzeitig die Vorteile beider Ansätze kombiniert! Der Indikator zeigt das Fraktal sofort im
FREE

Session Range Lite ist ein kostenloser Indikator für MetaTrader 5 (MT5) , der automatisch die Höchst- und Tiefststände der asiatischen Handelssitzung auf dem Chart anzeigt. Der Indikator hebt die asiatische Handelssitzungsspanne und wichtige Kursniveaus hervor, die häufig für Ausbrüche, Wiederholungen und Intraday-Marktstrukturanalysen verwendet werden. Hauptmerkmale: Automatische Berechnung von Asian Session High und Low Klare Visualisierung der Sitzungsspanne Horizontale Hoch-/Tiefstände Preis
FREE
Der ATR-Indikator (Average True Range) ist ein leistungsstarkes Instrument zur Messung der Marktvolatilität. Dieser Indikator liefert genaue Daten zu den Preisbewegungsspannen und hilft Händlern, Risiken effektiver zu verwalten und fundierte Handelsentscheidungen zu treffen. Er basiert auf dem weit verbreiteten ATR-Indikator und eignet sich sowohl für professionelle Händler als auch für Anfänger zur Analyse der Marktvolatilität. Mit dem ATR-Indikator können Sie die aktuelle Kursbewegungsspanne v
FREE

Was sind Donchian-Kanäle? Donchian-Kanäle sind drei Linien, die durch Berechnungen des gleitenden Durchschnitts erzeugt werden und einen Indikator bilden, der aus oberen und unteren Bändern um einen Mittelwert oder ein mittleres Band herum besteht. Das obere Band markiert den höchsten Kurs eines Wertpapiers über N Perioden, während das untere Band den niedrigsten Kurs eines Wertpapiers über N Perioden markiert. Der Bereich zwischen dem oberen und dem unteren Band stellt den Donchian-Kanal dar. D
FREE

Chronolines - Zeitliche Unterstützungs- und Widerstandsniveaus für MetaTrader 5 Einführung in Chronolines
Chronolines ist ein grafischer Indikator, der zeitliche Unterstützungs- und Widerstandsniveaus anhand der Höchst- und Tiefstwerte von vier vordefinierten Perioden identifiziert und visualisiert. Er ist mit allen auf dem MetaTrader 5 verfügbaren Vermögenswerten kompatibel, einschließlich Aktien, Währungen, Rohstoffen, Indizes und Kryptowährungen, und bietet einen logischen und strukturierten
FREE
GridLinesX ist ein leichtgewichtiges und effizientes Dienstprogramm für MetaTrader 5, das Händlern hilft, Kursniveaus mit Präzision zu visualisieren. Egal, ob Sie ein Grid Trader oder ein Scalper sind oder einfach nur psychologische Kursniveaus markieren müssen, GridLinesX automatisiert diesen Prozess sofort. Vergessen Sie das manuelle Zeichnen von horizontalen Linien, eine nach der anderen. Definieren Sie einfach Ihren High/Low-Bereich und den Rasterschritt (in Punkten), und das Tool wird ein s
FREE

Der Camarilla Swing Trade Indicator ist ein Indikator. Die Unterstützungs- und Widerstandspunkte werden aus dem High Low Close des Kurses der vorherigen TF-Woche berechnet.
Was sind Camarilla Pivot-Punkte?
(1) Camarilla Pivot Points ist eine modifizierte Version des klassischen Pivot Point. 2) Camarilla Pivot Points wurde 1989 von Nick Scott, einem erfolgreichen Anleihenhändler, eingeführt. Der Grundgedanke hinter Camarilla Pivot Points ist, dass der Preis dazu neigt, zu seinem Mittelwert zurü
FREE
Regime Radar - Marktregime + Bias Stops (MT5) Regime Radar zeigt das aktuelle Marktregime - Range, Schwacher Trend, Starker Trend oder Schock - und zeichnet ATR-basierte Stop-Linien auf dem Chart. Es bietet auch ein kompaktes Panel mit Regime, Richtung, Vertrauen und optionalen RSI/Bollinger-Vorschlägen. Dies ist ein Analysetool; es liefert keine Handelssignale und garantiert keine Gewinne. Wichtigste Funktionen Regime-Erkennung in vier Zuständen (Range, Schwacher Trend, Starker Trend, Schock).
FREE
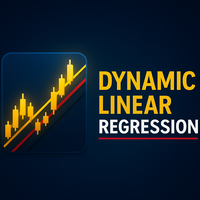
Linearer Regressionskanal (LRC) Indikator - Überblick Der Linear Regression Channel (LRC)-Indikator ist ein professionelles Tool, das dynamische Preiskanäle um eine Regressionstrendlinie herum anzeigt. Er passt sich automatisch an die Marktbedingungen an und hilft Händlern, Kursbewegungen klar und deutlich zu visualisieren. Hauptmerkmale : Regressionsbasierte Zentrallinie mit oberen/unteren Kanalgrenzen. Vollständig anpassbare Farben, Stile und Ebenen. Optionale Labels und Forward Extensio
FREE

LongTerm — Indikator zur mittel- und langfristigen Trendrichtungsanalyse LongTerm ist ein Indikator zur Richtungsanalyse , der entwickelt wurde, um die Stärke und Qualität des mittel- bis langfristigen Trends zu interpretieren, mit einem klaren Fokus auf die Long-orientierte Analyse . Er ist kein Einstiegssignal und kein Timing-Indikator , sondern ein Analysewerkzeug, das dem Trader hilft zu verstehen, wann der Markt günstige oder ungünstige Bedingungen für einen Long-Trend bietet , indem es das
FREE
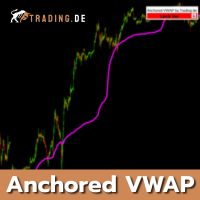
Speziell entwickelter Anchored VWAP für den MetaTrader 5 (MT5) von Trading.de. Passend zu unserer Daytrading Strategie kann du en Anchored VWAP in deinem Chart platzieren. Der Volume Weighted Average Price Indikator lässt sich farblich anpassen und auch am Chart fixieren. Es ist möglich echtes Volumen sowie kein echtes Volumen in den Einstellungen zu wählen. Am besten eignet sich der Indikator zum Daytrading im 1-Minuten-Chart wie du es bei Trading.de in der Ausbildung lernst.
Du kannst "E" au

Crash 1000 Scalping Indikator für den Crash 1000 Deriv Synthetic Index. Einführung Der Crash 1000 Scalping Indicator ist ein spezielles Tool, das für den Crash 1000 Index auf dem Deriv Synthetic Markt entwickelt wurde. Dieser Indikator ist besonders nützlich für Scalping auf dem M1-Zeitrahmen und hilft Händlern, präzise Ein- und Ausstiegspunkte für Kaufpositionen zu identifizieren. Er ist so konzipiert, dass er nicht nachzeichnet, klare Signale mit akustischen Warnungen und Push-Benachrichtigung

Der MACD ist wahrscheinlich einer der beliebtesten technischen Indikatoren überhaupt. Wenn sich der Markt im Trend befindet, leistet er eigentlich recht gute Arbeit, aber wenn der Markt zu konsolidieren beginnt und sich seitwärts bewegt, schneidet der MACD nicht so gut ab. SX Impulse MACD für MT4 ist hier erhältlich. Impulse MACD ist eine modifizierte Version des MACD, die sehr gut für den Handel mit Forex, Aktien und Kryptowährungen funktioniert. Er hat seine eigene einzigartige Funktion, die d

Der Indikator Quantitative Qualitative Estimation (QQE) ist vom berühmten Relative Strength Index (RSI) von Wilder abgeleitet. Im Wesentlichen ist der QQE ein stark geglätteter RSI.
Modifikation dieser Version: ( konvertiert von tradingview script von Mihkell00, Original von Glaz, 100% identische Ausgabe)
Es gibt also zwei QQEs. Eine, die auf dem Chart als Säulen angezeigt wird, und die andere "versteckt" im Hintergrund, die auch ein 50-MA-Bollinger-Band hat , das als Nulllinie fungiert .
Wenn
Der gute alte UT BOT wurde von 'QuantNomad ' aus dem TradingView-Skript konvertiert, ursprünglich von 'Yo_adriiiiaan ' und 'HPotter ' - Sie können also darauf wetten, dass dies ein leistungsfähiges Tool ist. Wenn Sie es kennen, wissen Sie es. Dies ist das Beste vom Besten, während es wirklich einfach gehalten ist.
Hauptfunktion: Trendidentifikation mit Trendwechselpunkten , die durch EMA(Quelle) und ATR gebildet werden -Quelle ist der CLOSE PRICE mit der Option, stattdessen den HEIKEN ASHI-Cha
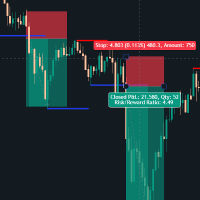
Indikator für Unterstützungs- und Widerstandsausbrüche Dieser maßgeschneiderte MT5-Indikator identifiziert automatisch wichtige Kursniveaus, bei denen der Markt in der Vergangenheit eine Umkehr vollzogen hat (Unterstützungs- und Widerstandszonen), und warnt Händler, wenn diese Niveaus mit Überzeugung durchbrochen werden. Was er tut: Der Indikator scannt das Kursgeschehen, um signifikante Höchst- und Tiefststände zu erkennen, und zeichnet dann dynamische Unterstützungs- und Widerstandslinien, die

Verbessern Sie Ihr Breakout-Trading mit dem Trendlines with Breaks by LuxAlgo MT5, einem innovativen pivot-basierten Indikator, der dynamische Trendlinien automatisch zeichnet und Echtzeit-Breaks hervorhebt, inspiriert vom popularen LuxAlgo-Suite auf TradingView, wo es über 100.000 Nutzungen und positive Bewertungen für seine Genauigkeit bei der Erkennung von Support/Resistance-Leveln gesammelt hat. Gefeiert in Trading-Communities wie Reddit und YouTube für seine non-repainting-Option und anpass
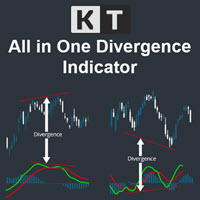
Der KT All-In-One Divergence wurde entwickelt, um regelmäßige und versteckte Divergenzen zwischen dem Preis und 11 allgemein anerkannten Oszillatoren zu erkennen. Dieses leistungsstarke Tool ist unverzichtbar, um schnell und präzise Marktumkehrungen zu erkennen. Es ist ein unverzichtbares Werkzeug im Arsenal eines jeden Händlers, das klare und genaue Divergenzmuster liefert. Seine Genauigkeit und Schnelligkeit bei der Identifizierung von Marktumkehrungen sind bemerkenswert und ermöglichen es Hän

Ein Indikator zum Zeichnen eines Diagramms des aktuellen und historischen Kontostandes wie Saldo, Eigenkapital, Marge, freie Marge, Margenniveau, Drawdown, Kontoprofit, Einzahlungen und Abhebungen.
Eingaben des Indikators : Saldo-Grafik zeichnen Equity-Grafik zeichnen Margin-Grafik zeichnen Grafik Freie Marge zeichnen Draw Margin Level Graph Drawdown-Diagramm Kontogewinn-Grafik zeichnen Daten im Diagramm und in den Puffern ausblenden Lücken durch Linien verbinden Vorzeichen von DDs auf Gewinn

Halb-Trend-Indikator für MetaTrader5
Um alle unsere Produkte herunterzuladen, können Sie auf diesen Link klicken: LINK
Einführung Der Half-Trend-Indikator ist einer der führenden Indikatoren auf dem Markt, der Ihnen hilft, Ihre Trades durch das Hoch, das Tief, den gleitenden Durchschnitt und die ATR einzugeben.
Spezifikationen Plattform metatrader5 (MT5) Typ benutzerdefinierter technischer Handelsindikator Niveau Anfänger Zeitrahmen alle Zeitrahmen von wöchentlich bis Handelsstile Scalping -

KT Custom High Low zeigt die jüngsten Hochs/Tiefs an, indem es die Datenpunkte aus mehreren Zeitrahmen abruft und sie dann auf ein einziges Diagramm projiziert. Wenn zwei oder mehr Hochs/Tiefs zum gleichen Preis gefunden werden, werden sie zu einem einzigen Level zusammengeführt, um die Charts zu entrümpeln.
Merkmale
Das Programm verfügt über einen Sortieralgorithmus, der die Charts entrümpelt, indem er die doppelten Werte zu einem einzigen Wert zusammenfasst. Holen Sie sich Hochs/Tiefs aus meh

Eabotpro Signals v3.0
Ein professioneller MetaTrader 5 Indikator, der entwickelt wurde, um hochpräzise Handelssignale mit Echtzeit-Benachrichtigungen, Handelsmanagement-Tools und eine saubere Schnittstelle zu liefern. "Empfohlener Basiszeitrahmen ist 4H Fibo From input . und Handelszeitrahmen 1 mint , und 5 mint " Hauptmerkmale: Hochpräzise Signale : Optimiert für Präzision und Konsistenz unter verschiedenen Marktbedingungen. Smart Trade Panel : Zeigt Einstiegskurse, Ziele, Stop-Levels, Leistun
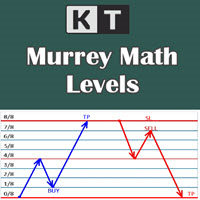
Es zeigt die Murrey Math-Levels auf dem Diagramm an und gibt außerdem eine Warnung aus, wenn der Kurs ein bestimmtes Level berührt. T. Henning Murrey stellte 1995 ein Handelssystem namens Murrey Math Trading System vor, das auf den Beobachtungen von W.D. Gann basiert.
Anwendungen
Für Murrey Math-Liebhaber ist dieser Indikator ein Muss in ihrem Arsenal. Sie müssen nicht die ganze Zeit auf dem Bildschirm präsent sein. Sobald der Kurs ein bestimmtes Niveau berührt, sendet er eine Warnung. Erkennen

TickVelocity mit Smart Alert : Echtzeit-Dominanz von Käufern und Verkäufern **️ Entdecken Sie die rohe Energie des Marktes mit dem TickVelocity with Smart Alert Indikator. Gehen Sie über das Standardvolumen und die Preisaktion hinaus und messen Sie die Geschwindigkeit und das Momentum von Preisänderungen, um die wahre zugrunde liegende Dominanz von Käufern oder Verkäufern in Echtzeit zu erkennen. Dieses unverzichtbare Tool bietet einen klaren, separaten Überblick über die Marktdynamik und v
FREE

Easy Correlations-Indikator Der Easy Correlations Indic ator wurde entwickelt, um Händlern bei der Analyse der Beziehung zwischen zwei korrelierten Instrumenten zu helfen. Durch die Überwachung des Abstands zwischen ihren Relative Strength Index (RSI)-Werten hebt der Indikator Situationen hervor, in denen sich ein Instrument deutlich weiter bewegt hat als das andere. Dies schafft potenzielle Handelsmöglichkeiten: Verkaufen Sie das stärkere Instrument (überstreckter RSI) Kauf des schwächeren Inst
FREE

Burning Scalper - Advanced MFI Trading System
Indikator-Beschreibung
Burning Scalper ist ein umfassendes Handelssystem basierend auf einem erweiterten Money Flow Index (MFI) Indikator, entwickelt für die präzise Identifizierung von Marktein- und Ausstiegspunkten. Der Indikator kombiniert Volumen- und Preisanalyse und bietet dem Händler ein vollständiges Bild der Marktdynamik.
Hauptfunktionen
Intelligente Handelssignale
Der Indikator identifiziert automatisch optimale Marktein
FREE

MT5 Version Dashboard: Kostenloser Scanner zur Überwachung aller Paare und Zeitrahmen. Bitte kontaktieren Sie mich nach dem Kauf, ich werde es Ihnen zusenden! MT4 Version Indikator: https: //www.mql5.com/en/market/product/59127 Tipp: Dies ist ein Indikator für die Anzeige von Echtzeitsignalen. Wenn der Indikator geladen ist und auf dem Chart läuft, kann das vergangene Signal nicht angezeigt werden. Die Marktstruktur ändert sich, wenn sich der Preis umkehrt Und Filter mit allen Importfunktionen
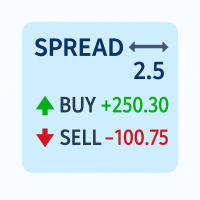
Verfolgen Sie Ihren Spread und alle Positions-PnLs (Buy & Sell) in Echtzeit - behalten Sie die Kontrolle über Ihre Trades auf einen Blick!
Merkmale: Spread-Anzeige in Echtzeit (in Pips) Gesamte Buy-Position PnL Gesamtverkaufsposition PnL Sauberes, nicht-intrusives Display-Layout Funktioniert mit allen Symbolen und Zeitfenstern Perfekt für: Scalper, die einen schnellen Überblick über den Spread benötigen Daytrader, die die Long/Short-Performance überwachen Risikomanager zur Optimierung des En
FREE
Spike Detector Rider - Intelligenter Handel in volatilen Märkten Einführung
Der Spike Detector Rider ist ein fortschrittliches System für MetaTrader 5, das explosive Preisbewegungen in hochvolatilen Vermögenswerten wie synthetischen Indizes und Rohstoffen erkennt.
Er kombiniert Volatilitätsfilter, Trendanalyse und automatisches Risikomanagement, um intelligente Handelsbestätigungen zu liefern. Nach dem Kauf senden Sie mir bitte eine private Nachricht über MQL5, um das Installationshandbuch und
Heikin Ashi RSI-Indikator für MT5 (HARSI) Übersicht
Der Heikin Ashi RSI-Indikator (HARSI) kombiniert die Heikin Ashi-Kerzenglättung mit der RSI-Momentum-Analyse und bietet so eine zweischichtige Ansicht der Preisbewegung und der relativen Stärke. Er bietet eine klare Visualisierung der Marktrichtung, RSI-basierte überkaufte und überverkaufte Bedingungen sowie optionale Backtesting- und Alarmsysteme zur Strategievalidierung und Automatisierung von Handelssignalen. Funktionsweise
Der Indikator w

MT4-Version MA-Band MT5 MA Ribbon ist ein erweiterter Indikator mit einem gleitenden Durchschnitt von 8 Perioden. Das MA-Band kann verwendet werden, um die Trendrichtung und Umkehrung zu identifizieren und Marktfortsetzungspunkte sowie potenzielle Einstiegspunkte, partielle Gewinnpunkte und Ausstiegspunkte. JETZT KOSTENLOS AUSPROBIEREN! Einstiegspunkte für Long- und Short-Positionen können gefunden werden, wenn der Preis in das Band eintritt oder es verlässt, erneut testet oder eine de

QuantumAlert CCI Navigator ist ein kostenloser Indikator, der für MT4/MT5-Plattformen verfügbar ist. Seine Aufgabe ist es, "Alarme" zu liefern, wenn sich der Markt in "überkauften und überverkauften" Regionen in Form von "Kauf- oder Verkaufssignalen" befindet. Dieser Indikator verfügt über viele Anpassungsoptionen, die im Abschnitt "Parameter" unten aufgeführt sind. Der Benutzer kann diese Parameter nach Bedarf anpassen. Treten Sie unserer MQL5-Gruppe bei, in der wir wichtige Neuigkeiten und Upd
FREE
Super Strike - Das ultimative Trend-Präzisionssystem
Super Strike ist ein fortschrittliches Trendfolgesystem, das die bewährte Genauigkeit des SuperTrend-Algorithmus mit der Filterleistung eines dynamischen gleitenden Durchschnitts kombiniert. Dieser Indikator wurde für Händler entwickelt, die Präzision und Vertrauen verlangen, und verwandelt rohe Kursbewegungen in ein sauberes, intuitives und hochinformatives visuelles System - ein komplettes Rahmenwerk, um intelligentere Handelsentscheidunge
FREE

Dieser Indikator ermöglicht es Ihnen, das Aussehen Ihres Charts zu verändern, indem Sie einen sanften Übergang zwischen zwei anpassbaren Farben für den Hintergrund anwenden. Dieser auffällige Farbeffekt verleiht Ihrem Chart ein frisches, modernes Aussehen und macht es visuell ansprechender. Der Farbverlauf wird auf alle Indikatorfenster angewendet, die sich derzeit auf Ihrem Chart befinden, wenn der Indikator angehängt ist, und wird auch alle neuen Indikatorfenster beeinflussen, die später hinzu
FREE

Vorerst kostenlos, der Preis wird am 1. Januar 2025 30 USD betragen.
Features: Pin Bar-Erkennung : Der Indikator ist so konzipiert, dass er bullische und bearische Pin-Bars anhand spezifischer Kriterien erkennt, einschließlich der relativen Größe des Kerzenkörpers und des Schattens sowie der Position des Kerzenkörpers in Bezug auf das 38,2%-Fibonacci-Level. Anpassbare Beschriftungen : Über jedem identifizierten bullischen oder bearischen Pin Bar wird ein benutzerdefinierter Text angezeigt, wie z
FREE

Dieser MT5-Chart-Trend-Checker durchbricht das Rauschen der Marktvolatilität und liefert ein klareres Bild von Trends und Kursbewegungen. Er enthält die folgenden Funktionen, die für mehr Klarheit bei der Markteinschätzung sorgen können: 1 anpassbarer gleitender Mehrperioden-Durchschnitt Optionale Heikin-Ashi-Kerzen 3 umschaltbare Fokus-Modi Eindeutige Farben für eine einfache Analyse
Link zur MT4-Version: https://www.mql5.com/en/market/product/106708/
Dieser Indikator zeigt Ihren bevorzugten
FREE

Der Index macht es den Händlern leicht, die Eröffnungs- und Schlusszeiten der globalen Märkte zu kennen :
- Sidney - Tokio - London - New York
Wo er jede Zeitzone irreführt und es uns ermöglicht, die Zeiten der Überschneidung der Märkte zu kennen, wenn die Liquidität hoch ist.
Um mehr Indikatoren und Signale zu erhalten, folgen Sie uns auf dem Telegram-Kanal Link
https://t.me/tuq98
oder unserem YouTube-Kanal, der Erklärungen in Arabisch und einen Kurs der technischen Analyse bietet
https:/
FREE

Diese Supertrend-Strategie ermöglicht es Ihnen, bei einem Supertrend-Trendwechsel eine Long- oder Shortposition einzugehen. Sowohl die ATR-Periode als auch der ATR-Multiplikator sind einstellbar. Wenn Sie das Kontrollkästchen "ATR-Berechnungsmethode ändern" aktivieren, wird die Berechnung auf der Grundlage des SMA durchgeführt und Sie erhalten leicht abweichende Ergebnisse, die je nach Asset besser funktionieren können. Achten Sie darauf, dass Sie Slippage und Kommission in die Eigenschaften ein
FREE

Beschreibung Der Gewinn- und Verlustindikator von Creative Tech Solutions ist ein robustes und umfassendes Tool, das Händlern hilft, ihre Handelsleistung in Echtzeit zu überwachen. Dieser Indikator liefert detaillierte Metriken zu Gewinnen und Verlusten und stellt sicher, dass Trader immer über ihre Handelsaktivitäten und -ergebnisse informiert sind. Mit anpassbaren Warnungen und Anzeigeeinstellungen ist dieser Indikator ein unverzichtbares Werkzeug für jeden ernsthaften Trader. Merkmale Metrike
FREE

Der Hyper Force-Indikator, der ursprünglich 1984 von David Weis erstellt wurde, zeigt in Wellenform die Stärke des Trends eines Symbols an.
Je größer die Welle, desto stärker der Trend.
Kleine Wellen bedeuten schwachen Trend oder Markt ohne Trend.
In einer Welle ist der Trend umso stärker, je größer der Unterschied zwischen einem Balken und einem anderen ist.
Wenn der Abstand zwischen einem Balken und einem anderen abnimmt, bedeutet dies, dass die Welle begonnen hat, ihre Tendenz zu verlier
FREE
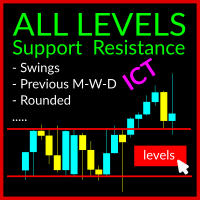
Der Swing Levels Support and Resistance Indicator ist ein robustes Tool, das für MetaTrader 5-Händler entwickelt wurde (auch für MT4 verfügbar). Er hilft bei der Identifizierung entscheidender Marktniveaus, an denen sich die Kursrichtung ändern kann, indem er diese anzeigt: Swing High und Swing Lows über alle Zeitrahmen hinweg Frühere Hochs und Tiefs für Tag, Woche und Monat US Mitternachtsniveau und gestriges Mitternachtsniveau US-Preopen 8:30 AM Level Gerundete Levels Dieser Indikator verfügt

Das Analytics-Dashboard analysiert Ihre vergangenen und aktuellen Trades und erstellt ein Dashboard mit detaillierten Analysen, das Sie zusätzlich in Form von Tortendiagrammen einsehen können.
Die Analyse umfasst im Wesentlichen vier Kategorien: 1) Performance-Kennzahlen, 2) Kennzahlen zum Handelsverhalten, 3) Kennzahlen zur Ausführungsqualität und 4) Kennzahlen zur Positionsebene.
Die vier allgemeinen Analysekennzahlen sind weiter in spezifischere Kennzahlen unterteilt (siehe unten).
Perfor
FREE

Moving Average Color Moving Average (MA) ist ein Trendindikator, bei dem es sich um eine gekrümmte Linie handelt, die auf der Grundlage von Preisänderungen berechnet wird. Dementsprechend ist der gleitende Durchschnitt ein Assistent des Händlers, der den Trend bestätigt. Auf dem Chart sieht es aus wie eine Biegelinie, die die Preisbewegung wiederholt, jedoch sanfter. Moving Average Color ist ein Standardindikator für den gleitenden Durchschnitt, dessen Farbe sich ändert, wenn sich die Trendrich
FREE

Keltner Channels Enhanced - Professioneller Indikator mit Alarmen
Vollständige Beschreibung:
Keltner Channels Enhanced ist ein professioneller technischer Indikator, der den klassischen Keltner Channels auf ein neues Niveau mit erweiterten Funktionen und vollständiger Anpassung bringt.
KEY FEATURES
Erweiterte Berechnung Auf dem Exponential Moving Average (EMA) basierende Mittellinie. Average True Range (ATR) für dynamische Kanalbreite. Anpassbarer Preistyp (Close, Open, High, Low, Median
FREE

Dieser Indikator ist eine direkte Portierung eines bekannten MetaTrader 4-Indikators, der im Internet frei verfügbar ist. Er wird nicht neu gezeichnet. Er implementiert eine Art von Ausbruchsstrategie. Die Pfeile zeigen die Marktrichtung an. Verwenden Sie den Indikator auf M15-Charts und höher. Der Indikator zeichnet zwei Bänder in der Nähe des Kursgeschehens und generiert Signale, wenn der Kurs unter dem unteren Band und auch über dem oberen Band schließt. Der Indikator verwendet periodische Hö
FREE
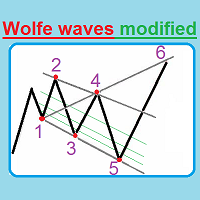
Dieser einzigartige Indikator bildet automatisch Wolfe Waves und bietet eine hocheffiziente Handelsstrategie. Verwenden Sie Wenn die Zahl 5 erscheint, warten Sie, bis die erste Kerze hinter dem Gleitenden Durchschnitt geschlossen ist, und sehen Sie sich dann die drei Mittellinien an, die zeigen, welches Lot-Volumen verwendet werden sollte, wenn der fünfte Punkt die Linie um 25 % überschritten hat. Die Kerze wird hinter dem Moving Average geschlossen, und dann eröffnen wir einen Handel mit dem Lo

Es gibt eine Wissenschaft namens Quantitative Finance, die es ermöglicht, die Preisbildungsmodelle für Finanzderivate mit den Methoden der theoretischen und mathematischen Physik zu untersuchen.
Kürzlich stieß ich auf ein Papier, in dem ein neuer Indikator für die technische Analyse beschrieben wird, der Ideen aus der Quantenphysik kombiniert und in die Finanzwelt einbringt. Ich interessierte mich dafür und beschloss, zu lehren, wie man Indikatoren, die auf einer wissenschaftlichen Arbeit basier
FREE
Acht Indikatoren für 3-Tage/Session/Woche-Setups. Sehen Sie sich unsere anderen Produkte für fxer.net an:
https://www.mql5.com/en/market/product/114888
https://www.mql5.com/en/market/product/114890
Indikator täglich Funktionen: Tagesschluss/Hoch/Tief Wöchentliche Eröffnung/Höchst-/Tiefst-/Schlusskurs Tokio/London/New Yorker Sitzungen Warnungen Signale und Alarme für Erste grüne Tage Erste rote Tage Innere Tage Äußere Tage 3x Tage des Ausbruchs nach oben 3x Tage mit Ausbrüchen nach unten Seien
FREE

ICT, SMC, Smart Money Concept, Support and Resistance, Trend Analysis, Price Action, Market Structure, Order Blocks, Breaker Blocks, Momentum Shift, Strong Imbalance, HH/LL/HL/LH, Fair Value Gap, FVG, Premium & Discount Zones, Fibonacci Retracement, OTE, Buyside Liquidity, Sellside Liquidity, Liquidity Voids, Market Sessions, NDOG, NWOG,Silver Bullet,ict template
Auf dem Finanzmarkt ist eine genaue Marktanalyse für Investoren von entscheidender Bedeutung. Um Investoren dabei zu helfen, Markttr

Sind Sie es leid, profitable Markttrends zu verpassen? Wünschen Sie sich ein zuverlässiges Tool, das Trendfortsetzungen präzise und genau erkennen kann?
Suchen Sie nicht weiter! Unser Trendfortsetzungsindikator soll Ihre Handelsstrategie stärken und Ihnen helfen, immer einen Schritt voraus zu sein.
Der Trendfortsetzungsindikator ist ein leistungsstarkes Tool, das speziell entwickelt wurde, um Händlern bei der Identifizierung und Bestätigung von Trendfortsetzungsmustern auf verschiedenen Finan

Das Hydra Multi Trend Dashboard ist ein leistungsstarkes Markt-Scanning-Tool für MetaTrader 4 und MetaTrader 5. Es überwacht bis zu 25 Währungspaare oder Vermögenswerte gleichzeitig über alle 9 Standard-Zeitrahmen (M1 bis monatlich). Mithilfe einer speziellen Trendformel filtert das Dashboard Marktgeräusche heraus und liefert klare, visuelle Bullish- oder Bearish-Signale, die es Händlern ermöglichen, Trendausrichtungen auf einen Blick zu erkennen, ohne die Charts zu wechseln. Einrichtung & Anle

Indikator für manuellen Handel und technische Analyse für Forex.
Es besteht aus einem Trendindikator mit dem Eröffnungsniveau des Handelstages und einem Pfeilindikator zur Bestimmung von Einstiegspunkten.
Der Indikator ändert seine Farbe nicht; er funktioniert, wenn die Kerze schließt.
Enthält verschiedene Arten von Warnungen für Signalpfeile.
Kann für die Arbeit mit jedem Diagramm, Handelsinstrument oder Zeitrahmen konfiguriert werden.
Die Arbeitsstrategie basiert auf der Suche nach Preisbewe
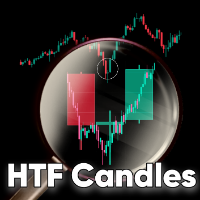
HTF Candles ist ein Indikator, der die Umrisse der Kerzen des höheren Zeitrahmens auf die untere Kerze überträgt. Der Indikator gibt Ihnen die Möglichkeit zu wählen, ob Sie die aktuelle HTF-Kerze live sehen möchten oder nicht, ohne Verzögerung oder erneutes Zeichnen. Merkmale Es werden keine Objekte auf dem Chart gezeichnet: Der Indikator zeichnet keine Linien oder Rechtecke auf dem Chart, sondern nur die HTF-Kerzen. So bleibt Ihr Chart einfach und sauber. MTF-Auswahl: Der Indikator ermöglicht e

CANDLESTICK_MT5
Ein sehr interessanter Indikator für Candlestick-Muster, der aus der kostenlosen Version des CANDLESTICK-Indikators für den MetaTrader4-Terminal in die Version für den MetaTrader5-Terminal umgewandelt wurde. Zusätzlich zu den Candlestick-Mustern zeichnet er Unterstützungs- und Widerstandslinien, die perfekt durch den Preis auf dem Chart ausgearbeitet werden. Es kann auf jedem Zeitrahmen arbeiten. Hat einfache Einstellungen. Bei der Konvertierung wurden die Arbeitslogik und das
FREE

Ich empfehle Ihnen, den Blog des Produkts (Handbuch) von Anfang bis Ende zu lesen , damit von Anfang an klar ist, was der Indikator bietet . Dieser Multi-Zeitrahmen- und Multisymbol-Indikator identifiziert doppelte oder dreifache Top/Bottom-Formationen oder einen folgenden Ausbruch aus der Nackenlinie (bestätigtes Top/Bottom). Er bietet RSI-, Pin-Bar-, Engulfing-, Tweezer-, Morning/Evening Star- sowie Divergenz-Filteroptionen, die es ermöglichen, nur die stärksten Setups herauszufiltern. Der In
MetaTrader Market bietet jedem Entwickler eine einfache und bequeme Plattform für den Verkauf von Programmen.
Wir unterstützen Sie bei der Veröffentlichung des Produkts und beraten Sie gerne, wie man eine Beschreibung für den Market vorbereitet. Alle Produkte, die im Market verkauft werden, sind durch eine zusätzliche Verschlüsselung geschützt und können nur auf dem Rechner des Kunden gestartet werden. Illegales Kopieren ist ausgeschlossen.
Sie verpassen Handelsmöglichkeiten:
- Freie Handelsapplikationen
- Über 8.000 Signale zum Kopieren
- Wirtschaftsnachrichten für die Lage an den Finanzmärkte
Registrierung
Einloggen
Wenn Sie kein Benutzerkonto haben, registrieren Sie sich
Erlauben Sie die Verwendung von Cookies, um sich auf der Website MQL5.com anzumelden.
Bitte aktivieren Sie die notwendige Einstellung in Ihrem Browser, da Sie sich sonst nicht einloggen können.