Legacy of Gann for MT5
- 指标
- 版本: 2.4
- 更新: 15 八月 2022
- 激活: 5

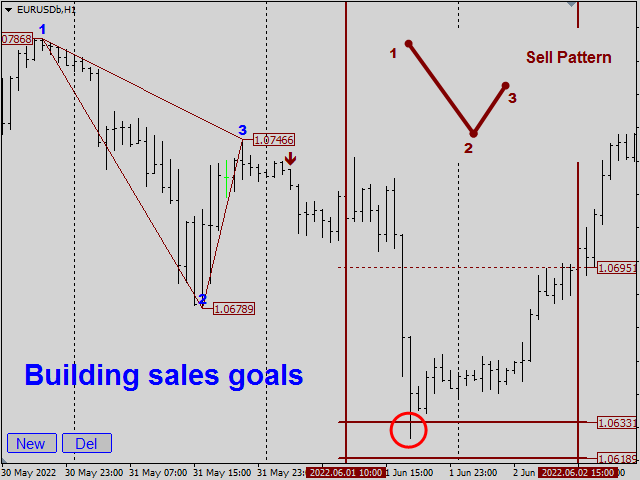
The indicator very accurately determines the levels of the possible end of the trend and profit fixing.
The method of determining levels is based on the ideas of W.D.Gann, using an algorithm developed by his follower Kirill Borovsky.
Extremely high reliability of reaching levels (according to K. Borovsky - 80-90%)
Indispensable for any trading strategy – every trader needs to determine the exit point from the market!
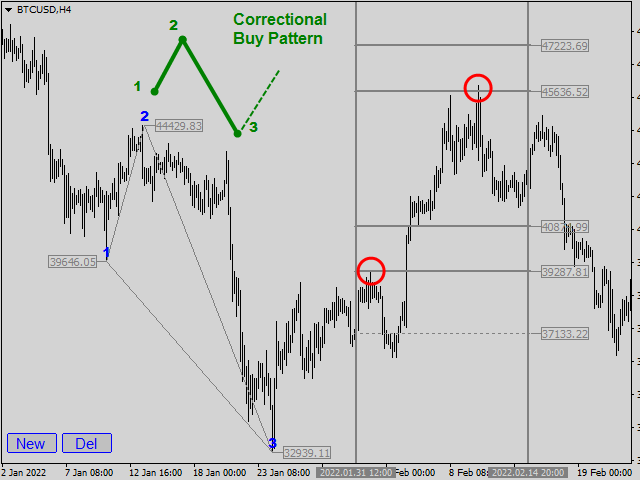
Precisely determines targets on any timeframes and any instruments (forex, metals, commodities, stocks, crypto...)
Related videos:
1. Detailed information on how the indicator works, its capabilities: https://youtu.be/WiMxOQJLNOI
2. How to find targets in real time, using the example of one day (Gold, different TFs): https://youtu.be/cjpPkvTnc00
Features:
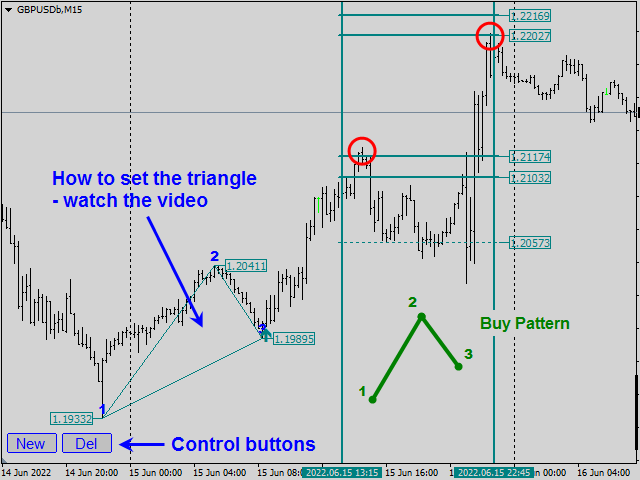
- Plotting any number of triangles on the chart, user-friendly interface.
- All constructions remain on the chart when switching the timeframe and retain their operability!
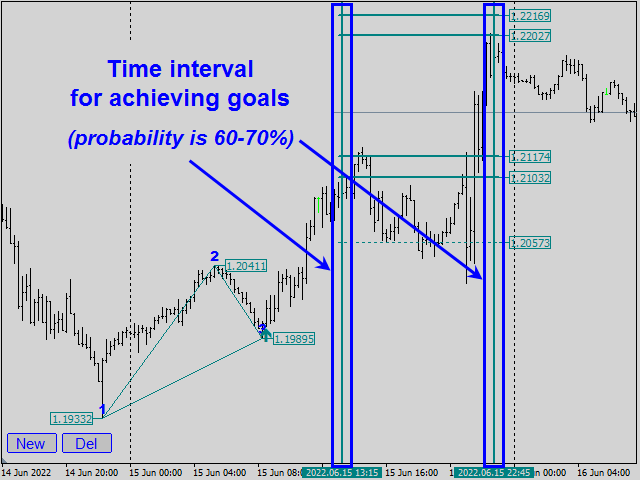
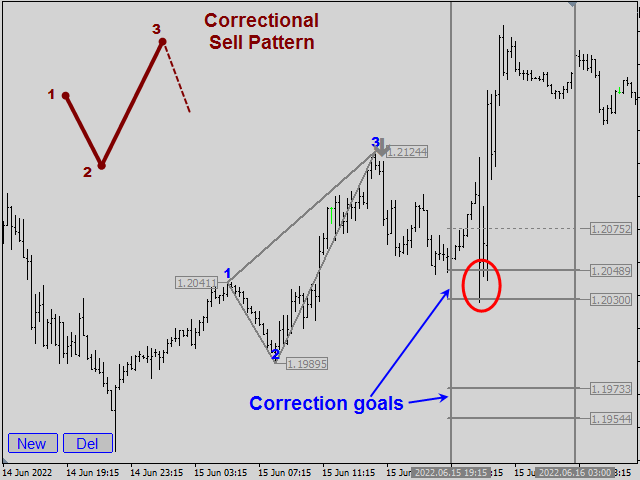
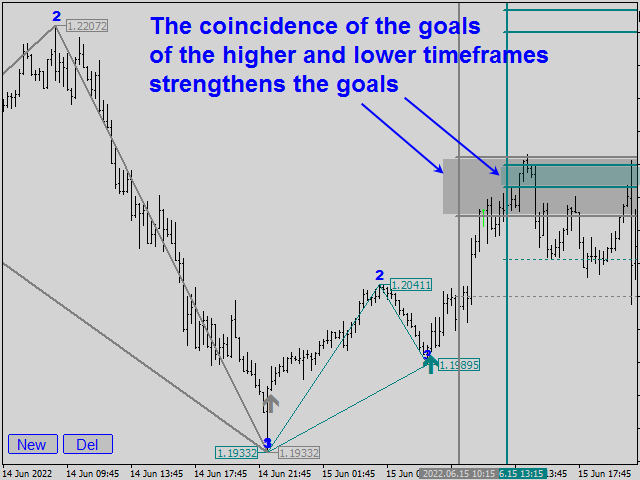
- Determination of the most probable time interval for achieving goals (according to my statistics, the accuracy of working out at this time is approximately 60-70%).
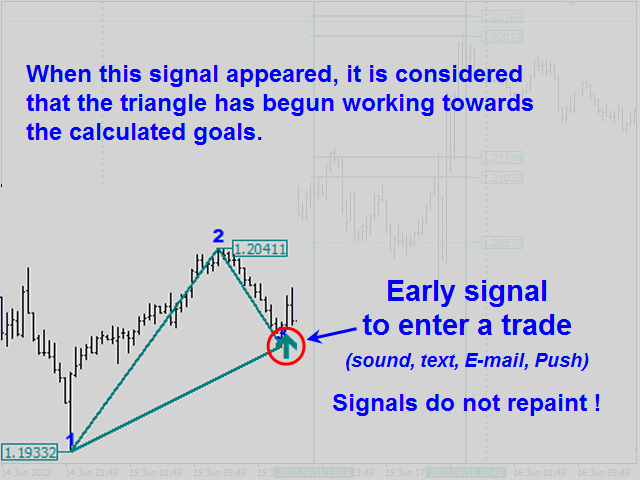
- Additional Early Signals to open a trade (rendering both in real time and on history). The signals are not repaint!
- Notifications about the achievement of goals: Preliminary Target, 1st and 2nd zones (text + sound, E-mail, Push to mobile phone)
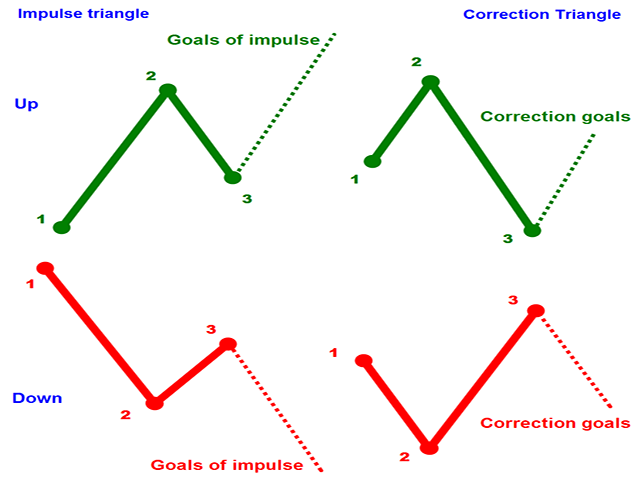
See the Guide to building Gann Levels:
Indicator Parameters:
-
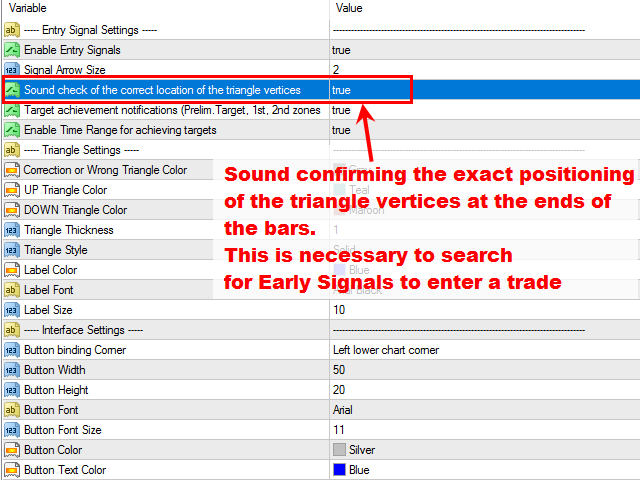
Entry Signal Settings - block of settings for an Early Signal to enter a trade. At the moment of the occurrence of the Early Signal, it is considered that the price has started to fulfill the calculated goals.
- Enable Entry Signals - enable an Early Signal to enter a trade
- Signal Arrow Size - signal arrow size (from 0 to 5)
- Sound check of the correct location of the triangle vertices - enable Sound confirming the exact positioning of the triangle vertices at the ends of the bars. Precise positioning on the ends of the bars is necessary to find Early Signals.
- Target achievement notifications (Prelim.Target, 1st, 2nd zones) - enable Notifications about the achievement of goals (Preliminary Target, 1st and 2nd Zones)
- Enable Time Range for achieving targets - enable the display of the Time Range for achieving goals
-
Messages Settings - text and sound settings
-
Triangle Settings - triangle appearance settings
-
Interface Settings - interface settings (size, color and location of buttons)
Please note that the indicator does not work in the strategy tester!
To test the indicator, download the demo version from the Comments tab (it works on NZDUSD only).


Very good Indicator. You need to do a little work and thinking on your own, but results are excellent especially if you combine with other proven indicators.