Aggression Volume Profile

4.55

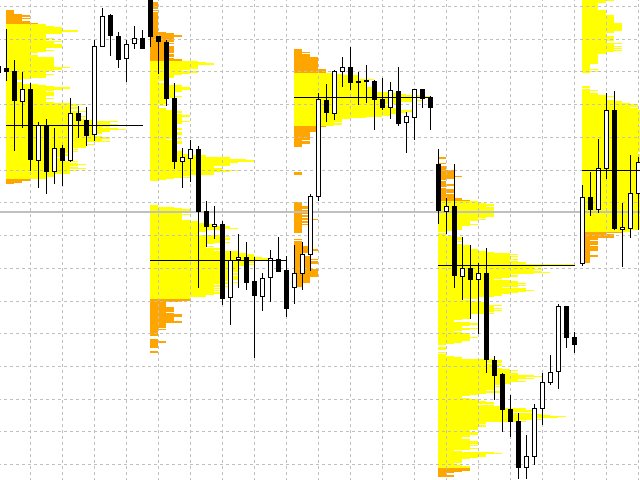
This indicator plots the volume profile by Price on the chart


There are 5 ways to view it:

  1. By Total Volume Traded (Premium Version);
  2. Volume Ticks(Forex)
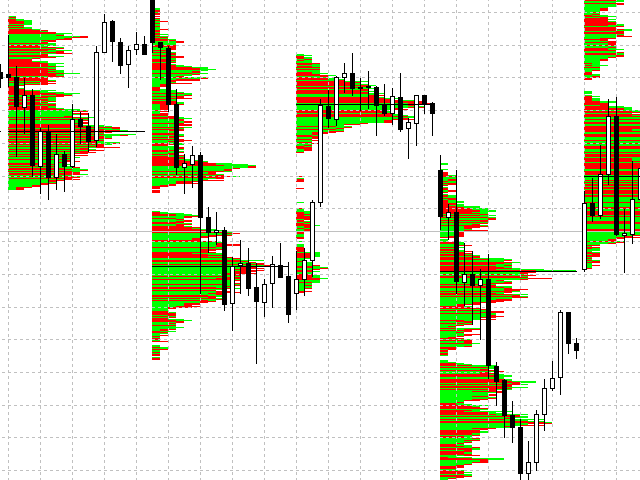
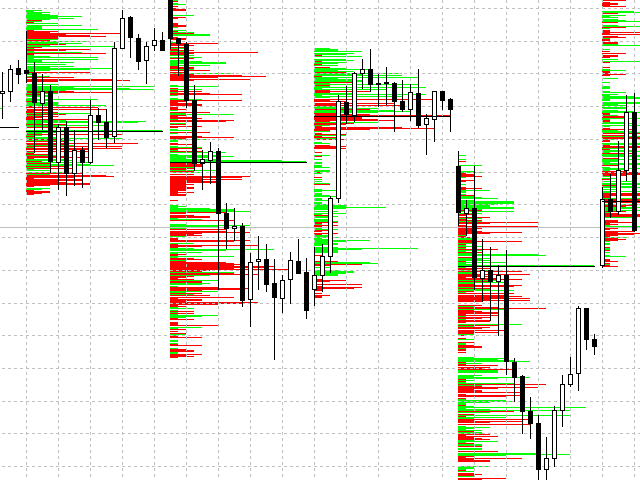
  3. Separated by Buyers and Sellers(Premium Version);
  4. Buyers Only(Premium Version);
  5. Sellers Only (Premium Version);
  6. Business balance (Buyers - Sellers) (Premium Version);.

It is possible to select how many days the profiles will be calculated.(Premium Version)


On the current day it recalculates the histogram data for each new candlestick.


Another feature is to select the highest trading range by entering the desired percentage.(Premium Version);


The indicator also allows you to select the colors of the profiles.


Know our Products


Follow us on our website.


Edson Cavalca Junior
Systems Analyst


NOTICE:

You need trading information (Time and Sales).


评分 15
mataphutguru
26
mataphutguru 2025.01.20 09:26 
 

Works well on gold futures, I like it but requires considerable trading experience to use with confidence. Thank you

ZiadSherif11
56
ZiadSherif11 2025.01.19 13:29 
 

good one

Giovanni Di Grazia
130
Giovanni Di Grazia 2024.12.20 14:13 
 

good

推荐产品
Market Profile 3 ForexArby com
Hussien Abdeltwab Hussien Ryad
4 (15)
Market Profile 3 MetaTrader 5 indicator  version 4.70— is a classic Market Profile implementation that can show the price density over time, outlining the most important price levels, value area, and control value of a given trading session. This indicator can be attached to timeframes between M1 and D1 and will show the Market Profile for daily, weekly, monthly, or even intraday sessions. Lower timeframes offer higher precision. Higher timeframes are recommended for better visibility. It is als
FREE
Waves Sizer
Flavio Javier Jarabeck
3.86 (7)
Wyckoff fans, enjoy! Ideally to be used with the Weis Waves indicator, but it can be easily used alone, the Waves Sizer puts the range (in resulting Price movement) done by the Price on its market swings. You can control how accurate or loose will be the swings. This tool is very helpful for visually know how much the Price has traveled in your Timeframe. This way you can confront this level of effort with the resulting Volume, etc... Weis Waves indicator: https://www.mql5.com/en/market/produc
FREE
核心用途 ​ 一款专为 MetaTrader 5(MT5)设计的常驻十字光标指标。它解决了 MT5 原生十字光标的核心局限,包括需手动激活、点击后自动消失、实线遮挡 K 线等问题,通过提供顺滑的专业级十字光标体验,优化图表分析流程。 ​ 核心特性 ​ 自动激活:加载后立即生效,替代原生 Ctrl+F 功能。点击图表任意位置仍保持十字光标状态,无需手动切换。 ​ 优化视觉设计:默认采用点状线条,避免遮挡 K 线、技术指标等图表核心内容,视觉呈现更简洁。 ​ 可自定义设置:支持调整十字线颜色、线条样式(点状 / 虚线 / 实线等,兼容 ENUM_LINE_STYLE 全系列)及线条宽度,适配不同图表背景与个人使用习惯。 ​ 实时鼠标跟随:十字线随鼠标移动精准更新,快速定位价格与时间坐标,助力高效对比历史 K 线关联关系,提升分析效率。 ​ 低干扰设计:禁用鼠标悬停工具提示,避免弹窗遮挡;卸载指标时自动清理十字线对象,无残留图表垃圾,不改动原图表设置。 ​ 快速设置指南 ​ 下载指标文件后,导入 MT5 平台(导航栏 > 指标 > 导入)。 ​ 在 MT5 图表中加载指标(导航栏 > 自定
FREE
Value Chart Candlesticks
Flavio Javier Jarabeck
4.57 (14)
The idea of a Value Chart indicator was presented in the very good book I read back in 2020 , " Dynamic Trading Indicators: Winning with Value Charts and Price Action Profile ", from the authors Mark Helweg and David Stendahl. The idea is simple and the result is pure genius: Present candlestick Price analysis in a detrended way! HOW TO READ THIS INDICATOR Look for Overbought and Oversold levels. Of course, you will need to test the settings a lot to find the "correct" one for your approach. It
FREE
Cumulative Delta MT5
Evgeny Shevtsov
4.53 (62)
The indicator analyzes the volume scale and splits it into two components - seller volumes and buyer volumes, and also calculates the delta and cumulative delta. The indicator does not flicker or redraw, its calculation and plotting are performed fairly quickly, while using the data from the smaller (relative to the current) periods. The indicator operation modes can be switched using the Mode input variable: Buy - display only the buyer volumes. Sell - display only the seller volumes. BuySell -
FREE
This indicator will mirror the assets in use in another metatrader, being able to choose the timeframe and a template. This is the Metatrader 5 Client, it needs the Metatrader 4 or 5 Server versions: Metatrader 4 Mirror Chart Server:   https://www.mql5.com/en/market/product/88644 Metatrader 5 Mirror Chart Server: https://www.mql5.com/en/market/product/88652 Details of how it works in the video.
FREE
Weis Waves
Flavio Javier Jarabeck
2.83 (18)
The original author is David Weis, an expert in the Wyckoff Method. The Weis Wave is a modern adaptation of the 1930's Wyckoff Method, another expert in Tape Reading techniques and Chart Analysis. Weis Waves takes market volume and stacks it into waves according to price conditions giving the trader valuable insights about the market conditions. If you want to learn more about this subject you can find tons of videos in YouTube. Just look for "The Wickoff Method", "Weis Wave" and "Volume Spread
FREE
Mirror Chart MT5
Andrej Hermann
5 (1)
The Mirror Chart MT5 is a overlay indicator specifically designed to project a second financial instrument directly onto the main chart window. This tool is invaluable for traders who rely on correlation analysis, as it visualizes the price movements of two different instruments in real time. Unlike traditional overlays, this indicator utilizes intelligent, dynamic centering and scaling logic. It continuously analyzes the visible price range in the current window for both symbols and calculates
FREE
Enhanced Volume Profile: The Ultimate Order Flow & Liquidity Analysis Tool Overview Enhanced Volume Profile is an indicator for MetaTrader 5 that displays the traded volume at specific price levels over a defined period. It separates the total volume into buy and sell components, presenting them as a side-by-side histogram on the chart. This allows users to observe the volume distribution and the proportion of buy and sell volumes at each price level. Graphics Rendering The indicator uses the
FREE
BoxInside MT5
Evgeny Shevtsov
5 (4)
This indicator calculates the volume profile and places labels that correspond to the VAH, VAL and POC levels, for each candle individually. Indicator operation features The indicator works on the timeframes from M3 to MN, but it uses the history data of smaller periods: M1 - for periods from M3 to H1, M5 - for periods from H2 to H12, M30 - for the D1 period, H4 - for the W1 period, D1 - for the MN period. The color and location of the VAL, VAH and POC labels on the current candle are considere
FREE
Aggression Volume
Flavio Javier Jarabeck
4.29 (17)
Aggression Volume Indicator is the kind of indicator that is rarely found in the MQL5 community because it is not based on the standard Volume data provided by the Metatrader 5 platform. It requires the scrutiny of all traffic Ticks requested on the platform... That said, Aggression Volume indicator requests all Tick Data from your Broker and processes it to build a very special version of a Volume Indicator, where Buyers and Sellers aggressions are plotted in a form of Histogram. Additionally,
FREE
Simple QM Pattern MT5
Suvashish Halder
3.33 (3)
Simple QM Pattern   is a powerful and intuitive trading indicator designed to simplify the identification of the Quasimodo (QM) trading pattern. The QM pattern is widely recognized among traders for effectively signaling potential   reversals   by highlighting key market structures and price action formations. This indicator helps traders easily visualize the QM pattern directly on their charts, making it straightforward even for those who are new to pattern trading. Simple QM Pattern includes d
FREE
High Low Open Close
Alexandre Borela
4.98 (44)
如果你象这个项目一样,就有5个饥饿审查。 这项指标采用了既定价格的公开、高、低价和关闭价格 可以对特定时间区加以调整。 许多机构和专业人士都认为这些是重要的。 贸易商可以为你了解他们可能更进一步的地点, 积极。 现有期间为: 前一日。 前一星期。 曾任Month。 曾任。 前一年。 或: 目前日。 目前周。 目前 Month。 目前配额。 今年。
FREE
Haven Volume Profile
Maksim Tarutin
4.55 (11)
Haven Volume Profile 是一个多功能的成交量剖面分析指标,帮助基于交易量分布识别关键价格水平。它旨在为专业交易者提供更深入的市场理解,并帮助识别重要的进出场点。 其他产品 ->  这里 主要功能: Point of Control (POC) 计算 - 最大交易活动水平,帮助识别最具流动性的水平 Value Area 定义(增加活动区)和可自定义的成交量百分比,帮助更准确地评估交易区间 支持tick成交量和实际成交量,适用于不同市场类型和交易策略 灵活的计算周期设置(天数),使工具能够适应任何时间范围 自动适应浅色和深色终端主题,提升用户界面的可视体验 清晰的水平可视化,支持自定义样式和颜色,便于图表分析和快速决策 该指标非常适合识别重要的价格水平和整合区,帮助交易者做出更加明智的交易决策。使用 Haven Volume Profile 有助于通过更准确的成交量和市场动态分析来降低风险并增加利润。
FREE
Donchian Breakout And Rsi
Mattia Impicciatore
4.5 (2)
概述 本指标是经典 Donchian 通道 的增强版,增加了多种实用的交易功能。 除了标准的三条线(最高、最低和中线),系统能够检测 突破 ,并在图表上用箭头进行可视化标记,同时只显示 与当前趋势方向相反的那条线 ,让图表更加简洁。 功能包括: 可视化信号 :突破时在图表上绘制彩色箭头 自动通知 :弹窗、Push 推送和 Email 邮件 RSI 过滤 :根据市场相对强弱验证信号 个性化设置 :颜色、线条粗细、箭头符号、RSI 阈值等 工作原理 Donchian 通道计算: 上轨线 :最近 N 根已收盘 K 线的最高价 下轨线 :最近 N 根已收盘 K 线的最低价 中线 :最高价和最低价的平均值 看涨突破 :收盘价高于上轨线 看跌突破 :收盘价低于下轨线 指标会: 绘制三条 Donchian 通道线 仅在 方向变化后的首次突破 绘制箭头 隐藏顺应趋势方向的那条线(上涨趋势: 只显示红色下轨线;下跌趋势: 只显示绿色上轨线) 可选用 RSI 过滤突破信号,减少虚假突破 支持实时发送通知 参数说明 Donchian 通道设置 indPeriod :计算通道高低点的已收盘 K 线数量 Lin
FREE
Overview Market Volume Profile Modes is a powerful MT5 volume distribution indicator that integrates multiple Volume Profile variants. Users can switch between different analysis modes through a simple menu selection. This indicator helps traders identify key price levels, support and resistance zones, and market volume distribution. Core Concepts • POC (Point of Control): The price level with the highest volume concentration, representing the market's accepted "fair value" area • VAH (Value A
FREE
Expansoes M
Marcus Vinicius Da Silva Miranda
The M Extensions are variations of the Golden Ratio (Fibonacci Sequence). It is the World's first technique developed for Candle Projections. Advantages: Easy to plot. Candle anchoring; High and accurate precision as support and resistance; Excellent Risk x Return ratio; Works in any timeframe; Works in any asset / market.   The M Extensions are classified into: M0: Zero point (starting candle) RC: Initial candle control region M1: Extension region 1 M2: Extension region 2 M3: Extension regi
FREE
MW Volume
Martin Bittencourt
3.8 (5)
The Martinware Volume indicator plots a colored moving average over volume bars. The coloring uses three colors and can be done in different ways choosable by the user and is applied both to the average as to the volume bars. Three types of coloring are possible: None: no coloring is done Increasing or decreasing: changes the color depending on the current value being bigger or lesser than the previous one Volume relative to average: colors vary if the current volume is bigger or lesser then
FREE
Volume profile CVD Frato
Francisco Felipe Alves Da Silva Rocha
5 (1)
Frato Volume Profile Pro v7.5 由 Frato Academy 开发 此指标用于 MetaTrader 5 平台,显示价格成交量分布图。它计算在可配置周期内各价格水平的交易量分布,并将结果直接显示在主图表上。 功能: 带颜色渐变的成交量分布图 该指标将价格区间划分为多个水平,并为每个水平分配相应的成交量。每个水平的颜色根据成交量呈连续渐变:低成交量水平采用冷色调(深蓝色),高成交量水平采用暖色调(黄色)。最高成交量水平,称为控制点 (POC),会以视觉方式突出显示。 参考线:POC、VAH 和 VAL 该指标会自动绘制三条水平线: - POC(控制点):最高成交量水平 - VAH(价值区域上限):价值区域的上限 - VAL(价值区域下限):价值区域的下限 定义价值区域的百分比可配置(默认值:70%)。 预估成交量差值 对于每个价格水平,该指标根据每根K线的开盘价、收盘价、最高价和最低价之间的关系,估算买卖成交量之间的差异。结果以镜像K线的形式显示在成交量分布图旁边。 当日成交量差值面板 一个浮动面板显示自当日开盘以来的累计成交
FREE
LT Donchian Channel
Thiago Duarte
4.86 (7)
Donchian Channel is an indicator created by Richard Donchian. It is formed by taking the highest high and the lowest low of the last specified period in candles. The area between high and low is the channel for the chosen period. Its configuration is simple. It is possible to have the average between the upper and lower lines, plus you have alerts when price hits one side. If you have any questions or find any bugs, please contact me. Enjoy!
FREE
Show Pips for MT5
Roman Podpora
4.55 (29)
对于那些总是想了解帐户当前情况的人来说,此信息指示器将很有用。 VERSION MT 4 -   More useful indicators 该指标显示诸如利润点数、百分比和货币等数据,以及当前货币对的点差以及柱在当前时间范围内收盘的时间。 有多种选项可用于将信息线放置在图表上: 价格右侧(运行在价格后面); 作为评论(在图表的左上角); 在屏幕的选定角落。 还可以选择信息分隔符: | / \ # 该指标易于使用且信息丰富。可以在设置中禁用不必要的信息项目。 设置 外观类型     - 信息行的显示类型。有以下三种选择: 跟随价格     - 遵循价格; 作为评论     - 作为评论; 在屏幕的选定角落     - 在屏幕的选定角落。 附件图角     - 如果您选择屏幕选定角的显示类型,则此项目允许您选择四个捕捉角之一; 显示利润?       - 该参数负责以存款货币显示利润; 以百分比显示利润?       - 该参数负责以百分比形式显示利润; 显示传播?       - 该参数负责显示当前点差; 显示酒吧关闭时间?       - 该参数负责显示柱关闭之前的时间; 文字颜
FREE
LT Agression Indicator
Thiago Duarte
5 (3)
This is a buyer and seller aggression indicator that analyzes the shape of each candle and project this data in a histogram form. There are 4 histograms in one. On the front we have two: Upper - Buyer force. Lower - Seller force. At the background we also have two histogram, both with same color. They measure the combined strenght of buyers and sellers. This histograms can be turned off in Input Parameters. It is also possible to have the real or tick volume to help on this force measurement. IN
FREE
DALA Forecast
Grigorii Matsnev
About the indicator: DALA Forecast is a universal tool for predicting the dynamics of time series of any nature. For prediction, modified methods of nonlinear dynamics analysis are used, on the basis of which a predictive model is built using machine learning methods.  To get the trial version of the indicator, you can contact me in private messages. How to use the indicator: Apply the indicator to your chosen financial instrument or indicator with the settings you need. The prediction will be
FREE
PZ Penta O MT5
PZ TRADING SLU
3.5 (4)
The Penta-O is a 6-point retracement harmonacci pattern which usually precedes big market movements. Penta-O patterns can expand and repaint quite a bit. To make things easier this indicator implements a twist: it waits for a donchian breakout in the right direction before signaling the trade. The end result is an otherwise repainting indicator with a very reliable trading signal. The donchian breakout period is entered as an input. [ Installation Guide | Update Guide | Troubleshooting | FAQ | A
FREE
BKT Pro Tooco SR
Khac Thanh Bui
BKT Pro Tooco 一款适用于 MetaTrader 5 的多方法支撑阻力工具,使用四种可选检测算法实时识别摆动区间,已确认信号不重绘。 BKT Pro Tooco 是一款面向 MetaTrader 5 的支撑与阻力指标,专为需要在多种市场结构中可靠识别区间的交易者而设计。该指标提供四种独立的检测方法,允许交易者根据自己偏好的交易风格选择算法:基于枢轴的结构分析、唐奇安通道反转、连续K线序列,或 ZigZag 摆动识别。所有已确认区间均基于已收盘的K线计算,不会重绘。   概述 该指标扫描历史价格行为和当前K线,以定位重要的摆动高点和摆动低点。当识别到摆动点时,系统使用基于 ATR 的深度计算构建对应的支撑或阻力区间。区间宽度由两个参数决定:一个控制区间主体,另一个为可配置的突破缓冲区,使交易者能够控制区间对价格短暂突破边界的敏感程度。 每个区间持续追踪价格互动情况。指标记录价格进入区间的次数、已确认扫盘次数(价格短暂突破边界后收盘回到区间内),以及区间内的累计成交量。当价格收盘突破区间边界时,该区间被标记为已测试,可根据用户偏好显示或隐藏。活跃区间可在图表上向右延伸,并附带统
FREE
Friend of the trend
Anderson De Assis
Friend of the Trend: Your Trend Tracker Master the market with Friend of the Trend , the indicator that simplifies trend analysis and helps you identify the best moments to buy, sell, or wait. With an intuitive and visually striking design, Friend of the Trend analyzes price movements and delivers signals through a colorful histogram: Green Bars : Signal an uptrend, indicating buying opportunities. Red Bars : Alert to a downtrend, suggesting potential selling points. Orange Bars : Represent cons
FREE
Pin Bars MT5
Yury Emeliyanov
Main purpose:   "Pin Bars"   is designed to automatically detect pin bars on financial market charts. A pin bar is a candle with a characteristic body and a long tail, which can signal a trend reversal or correction. How it works:   The indicator analyzes each candle on the chart, determining the size of the body, tail and nose of the candle. When a pin bar corresponding to predefined parameters is detected, the indicator marks it on the chart with an up or down arrow, depending on the directi
FREE
Order Book, known also as Market Book, market depth, Level 2, - is a dynamically updated table with current volumes of orders to buy and to sell specific financial instument at price levels near Bid and Ask. MetaTrader 5 provides the means for receiving market book from your broker, but in real time only, without access to its history. The indicator OrderBook Cumulative Indicator accumulates market book data online and visualizes them on the chart. In addition, the indicator can show the market
Magic 7 Indicator
Marek Pawel Szczesny
5 (1)
Overview Magic 7 Indicator is a comprehensive MetaTrader 5 (MQL5) indicator that identifies seven different trading scenarios based on candlestick patterns and technical analysis. The indicator combines traditional price action patterns with modern concepts like Fair Value Gaps (FVG) to provide trading signals with precise entry points and stop loss levels. Features 7 Trading Scenarios : Each scenario identifies specific market conditions and trading opportunities Visual Signals : Clear buy/sell
FREE
Stamina HUD
Michele Todesco
STAMINA HUD – Advanced Market & Trend Dashboard (MT5) STAMINA HUD   is a professional   market information panel   designed for traders who want   clarity, speed, and control   directly on the chart. It provides a   clean heads-up display (HUD)   with essential market data and   multi-timeframe trend direction , without cluttering the chart or generating trading signals. What STAMINA HUD Shows   Current Price   Spread (in real pips)   Today High–Low range (pips)   Average D
FREE
该产品的买家也购买
Neuro Poseidon MT5
Daria Rezueva
4.94 (16)
Neuro Poseidon is a new indicator by Daria Rezueva. It combines precise trading signals with adaptive TP/SL levels - creating best possible trades as a result! Message me and get  Neuro Poseidon Assistant  as a gift to automize your trading process! What makes it stand out? 1. Proven profitability on all assets and timeframes 2. Only confirmed BUY and SELL signals present on the chart 3. Adaptive TP & SL levels generated by the software for each trade 4. Easy to understand - suitable for al
SuperScalp Pro
Van Minh Nguyen
4.65 (26)
SuperScalp Pro – 高级多重过滤剥头皮指标系统 SuperScalp Pro 是一款高级剥头皮交易指标,将经典 Supertrend 与多种智能确认过滤器结合,帮助识别交易机会。它可高效运行于 M1 至 H4 多个时间周期,并针对 XAUUSD、BTCUSD 及主要外汇货币对进行了优化。 该指标提供清晰的 Buy 和 Sell 信号,并基于 ATR 自动计算入场价、止损和止盈水平,帮助交易者更有效地管理风险。Fibonacci Take Profit 功能可在关键价格水平提前平仓,并在到达这些水平时发送通知,从而提升交易管理效率与稳定性。 默认配置已启用 Fibonacci Take Profit,专注于更稳定、更持续的交易体验。您只需将指标加载到图表即可立即开始使用,无需额外设置。对于高级用户,所有参数均可完全自定义,以适应不同交易策略和偏好。 完整使用文档可在产品博客查看: [User Guide] 支持通过 SuperScalp Pro Auto Trader EA 进行自动交易: [Auto Trader] SuperScalp Pro 集成了 EMA、RSI
Gold Entry Sniper
Tahir Mehmood
5 (12)
Gold Entry Sniper – 专业多周期ATR黄金交易仪表盘,适合黄金剥头皮与波段交易 Gold Entry Sniper 是一款先进的 MetaTrader 5 指标,旨在为 XAUUSD 及其他品种提供精准的 买/卖信号 。基于 ATR 移动止损逻辑 和 多周期分析仪表盘 ,适合剥头皮交易者与波段交易者,帮助识别 高概率黄金入场点 。 主要功能与优势 多周期信号分析 – 同时显示 M1、M5、M15 趋势方向。 基于ATR的动态止损 – 根据波动性自动调整。 专业图表仪表盘 – 展示信号状态、ATR水平、线性回归中线和交易方向。 清晰买卖标记 – 自动箭头与文字标签提示。 离场提示与交易管理 – 自动检测离场信号锁定利润。 全面自定义 – 调整仪表盘位置、颜色、字体及参数。 专为黄金优化 – 适用于 M1至M15 黄金剥头皮 ,也适合外汇、指数与加密货币。 为什么选择 Gold Entry Sniper? 为追求 快速、精准、可视化交易决策 的交易者打造,ATR 与多周期确认结合,帮助你抓住 最佳黄金入场点
Divergence Bomber
Ihor Otkydach
4.9 (89)
购买该指标的每位用户将额外免费获得以下内容: 原创工具“Bomber Utility”,该工具会自动跟踪每一笔交易,设置止损和止盈点,并根据策略规则自动平仓; 适用于不同交易品种的指标设置文件(Set 文件); 三种不同风险模式下的 Bomber Utility 设置文件:“最低风险”、“平衡风险” 和 “观望策略”; 一套详细的 视频操作手册,帮助您快速完成安装、配置并开始使用本交易系统。 注意: 要获取以上所有赠品,请通过 MQL5 的私人消息系统联系卖家。 我为您介绍原创的自定义指标 “Divergence Bomber”(背离轰炸机),它是一套基于 MACD 背离交易策略 的“全功能”交易系统。 该技术指标的主要任务是识别 价格与 MACD 指标之间的背离,并发出交易信号(包括推送通知),指示未来价格可能的运动方向。平均而言,这些信号的准确率超过 98%。有关该指标如何工作的详细说明,请观看本页面上的视频演示。 该系统使用 止损订单 和 动态回撤平仓机制 来管理交易。 Divergence Bomber 指标的主要特点: 支持交易的品种: AUDCAD、AUDCHF、AUDSG
SMC Intraday Formula
Kareem Abbas
5 (12)
让我们先坦诚一点。 没有任何一个指标可以单独让你实现盈利。如果有人告诉你可以,那他是在向你兜售一个梦想。任何显示完美买卖箭头的指标都可以被做得看起来毫无瑕疵——只需要放大历史中的某一段并截取成功交易的截图。我们不会这样做。 SMC Intraday Formula 是一个工具。 它为你读取市场结构,标记出概率最高的价格区域,并用简单直白的语言准确告诉你当前智能资金的行为轨迹。你仍然需要做决定。你仍然需要执行交易。但现在,你是带着精确性执行,而不是靠希望。 我们已经在黄金(XAUUSD)以及主要外汇货币对的日内剥头皮交易中使用该指标将近三年。这是我们在 M1、M5、M15 和 M30 上的日常主力工具。它之所以有效,是因为它不试图预测未来——它展示的是当前正在形成的高概率交易机会,并解释 为什么 。 它与其他所有指标有什么不同? 大多数交易指标只做一件事。移动平均线交叉。振荡指标触及某个水平。出现一个箭头。你进场交易。你亏损。你责怪指标。重复。 SMC Intraday Formula 将多个机构级概念整合为一个统一的市场解读: - 斐波那契共振引擎 不只是普通的斐波那契水平——该指标
Entry In The Zone and SMC Multi Timeframe is a real-time 2-in-1 market analysis tool that combines market structure analysis and a No Repaint BUY / SELL signal system into a single indicator, built on Smart Money Concepts (SMC) — a widely adopted framework used by professional traders to understand market structure. This indicator helps you see the market more clearly, make decisions based on structure rather than guesswork, and focus on high-probability zones where price is more likely to react
ScalpPoint
Temirlan Kdyrkhan
ScalpPoint is a powerful trading companion designed to generate high-probability entry signals with dynamic TP/SL/DP levels based on volatility. Built-in performance tracking shows win/loss stats, PP1/PP2 hits, and success rates — all updated live. Key Features: Buy/Sell signals with adaptive volatility bands Real-time TP/SL/DP levels based on ATR Built-in MA Filter with optional ATR/StdDev volatility Performance stats panel (Success, Profit/Loss, PP1/PP2) Alerts via popup, sound, push, or emai
SmartScalping
Temirlan Kdyrkhan
SmartScalping is a powerful trading companion designed to generate high-probability entry signals with dynamic TP/SL/DP levels based on volatility. Built-in performance tracking shows win/loss stats, PP1/PP2 hits, and success rates — all updated live. Key Features: Buy/Sell signals with adaptive volatility bands Real-time TP/SL/DP levels based on ATR Built-in MA Filter with optional ATR/StdDev volatility Performance stats panel (Success, Profit/Loss, PP1/PP2) Alerts via popup, sound, push, or e
Power Candles MT5
Daniel Stein
5 (8)
Power Candles V3 - 自我优化的强度指标 Power Candles V3 把货币与品种的强度直接转化为图表上可执行的交易方案。指标不再仅根据强度给K线着色,而是在后台持续运行实时自动优化,为您正面对的品种给出最佳 Stop Loss、Take Profit 与信号阈值。一键采用,Entry、Stop Loss、Take Profit 线就以精确价格绘制在图表上,提醒消息中直接包含方向。 本工具是 Stein Investments 生态系统的一部分 - 18+ 款工具,加上 Max,您的一对一 AI 交易导师。  随时在线,深入了解每一款指标,在您需要梳理思路的那一刻就在那里。  立即认识他: https://stein.investments 每根收盘K线运行 3,000+ 次交易模拟。9 种强度状态。2 种策略并行测试。一键采用最优配置。 为什么需要这个 大多数强度指标只给您一个数值,然后留下三个问题:相信哪个阈值、用哪个 Stop Loss、走哪个交易方向。Power Candles V3 在每根收盘K线上自动回答这些问题。结果就是一个完整的交易方案 -
SignalTech MT5
Yue Wang
5 (26)
SignalTech MT5 is an unique fully rule based trading system for EURUSD, USDCHF, USDJPY, AUDUSD, NZDUSD, EURJPY, AUDJPY, NZDJPY, CADJPY.  All the winning trades with chart setups are published on the comments page. 2026-05 4107 Pips (Until 05-29 NY Closed) 2026-04 2243 Pips 2026-03 2165 Pips 2026-02 2937 Pips 2026-01 2624 Pips 2025-12 1174 Pips It can generate signals with Buy/Sell Arrows and Pop-Up/Sound Alerts. Each signal has clear Entry and Stop Loss levels, which should be automatically flag
TrendProMaster
Temirlan Kdyrkhan
MasterTrend Indicator for MT5 A powerful trend-following and signal-evaluation tool MasterTrend   is a custom MT5 indicator that combines Moving Averages and ATR-based risk/reward logic to generate clear buy/sell signals. It visualizes dynamic SL/TP levels, evaluates past trade outcomes, and displays win/loss statistics in a clean on-chart panel. Key features include: Buy/Sell signals based on MA crossovers ATR-based SL/TP1/TP2/TP3 levels with visual lines and labels Signal outcome tracking wit
MasterTrend
Temirlan Kdyrkhan
MasterTrend Indicator for MT5 A powerful trend-following and signal-evaluation tool MasterTrend   is a custom MT5 indicator that combines Moving Averages and ATR-based risk/reward logic to generate clear buy/sell signals. It visualizes dynamic SL/TP levels, evaluates past trade outcomes, and displays win/loss statistics in a clean on-chart panel. Key features include: Buy/Sell signals based on MA crossovers ATR-based SL/TP1/TP2/TP3 levels with visual lines and labels Signal outcome tracking wit
介绍     Quantum Breakout PRO   ,突破性的 MQL5 指标,正在改变您交易突破区域的方式!由拥有超过13年交易经验的资深交易员团队开发,     量子突破 PRO     旨在通过其创新和动态的突破区域策略将您的交易之旅推向新的高度。 量子突破指标将为您提供带有 5 个利润目标区域的突破区域的信号箭头,以及基于突破框的止损建议。 它既适合新手交易者,也适合专业交易者。 量子 EA 通道:       点击这里 重要的!购买后请私信我领取安装手册。 建议: 时间范围:M15 货币对:GBPJPY、EURJPY、USDJPY、NZDUSD、XAUUSD 账户类型:ECN、Raw 或 Razor,点差极低 经纪商时间:GMT +3 经纪商:IC Markets、Pepperstone with Raw 和 Razor 的点差最低 规格: 不重漆! 最多 5 个建议利润目标区域 建议止损水平 可定制的盒子。您可以设置自己的 Box Time Start 和 Box Time End。 接触 如果您有任何疑问或需要帮助,请通过私人消息与我联系。
本产品已针对 2026 年市场进行更新,并针对最新 MT5 版本进行了优化。 价格更新通知: Smart Trend Trading System 目前价格为 $99 。 接下来的 30 次购买 后,价格将上涨至 $199 。 特别优惠: 购买 Smart Trend Trading System 后,请发送私信给我,即可免费领取 Smart Universal EA ,并将您的 Smart Trend 信号转换为自动交易。 Smart Trend Trading System 是一套完整的交易系统,具备不重绘、不回绘、不延迟的特点,专为希望获得更清晰信号、更准确趋势方向以及更有组织交易方式的交易者打造。 Online course , manual and download presets . 它将 10 多种交易工具 整合到一个系统中,包括趋势检测、反转区域、Smart Cloud、移动止损逻辑、支撑与阻力、K线着色、提醒以及多周期分析。 该系统旨在帮助您应对不同的市场环境: 趋势市场: 识别主要趋势,发现回调,跟随动能,并通过止损指导和移动止损选项寻找更清晰的入场机会。 震荡
Quantum TrendPulse
Bogdan Ion Puscasu
5 (25)
介绍 Quantum TrendPulse   ,这是一款终极交易工具,它将 SuperTrend   、   RSI 和 Stochastic 的强大功能整合到一个综合指标中,以最大限度地发挥您的交易潜力。该指标专为追求精准和效率的交易者而设计,可帮助您自信地识别市场趋势、动量变化以及最佳进入和退出点。 主要特点: 超级趋势整合: 轻松跟随当前的市场趋势并乘上盈利浪潮。 RSI 精度: 检测超买和超卖水平,非常适合把握市场逆转时机,可用作 SuperTrend 的过滤器 随机精度: 利用随机振荡在波动的市场中寻找隐藏的机会, 用作超级趋势的过滤器 多时间范围分析: 从 M5 到 H1 或 H4,在不同时间范围内关注市场动态。 可定制的警报: 当您的自定义交易条件得到满足时收到通知,这样您就不会错过任何交易。 无论您是新手还是经验丰富的交易员,   Quantum TrendPulse 都能为您提供所需的优势,帮助您增强策略并自信地进行交易。借助这一强大的指标,将洞察力转化为利润 — 掌控您的交易! ***购买 Quantum TrendPulse,即可免费获得 Quantum Tr
Azimuth Pro
Ottaviano De Cicco
5 (7)
Azimuth Pro V2:MT5合成分形结构分析与确认入场 概述 Azimuth Pro 是 Merkava Labs 推出的多层级波段结构指标。四层嵌套波段层级、锚定波段的VWAP、ABC形态识别、三时间框架结构过滤以及收盘确认入场——一个图表,一个从微观波段到宏观周期的完整工作流程。 这不是盲目的信号产品。它是一个以结构为先的工作流程,专为重视位置、背景和时机的交易者打造。 V2上市优惠 — Azimuth Pro V2售价USD 399(接下来的100份)。最终价格:USD 499。 1. V2的变化 合成多时间框架引擎 高时间框架分析从零开始重建,采用与Meridian Pro相同的专有合成架构。更清晰的HTF背景、稳定的实时行为、无经典MTF同步问题。合成引擎还解锁了 固定比率时间框架级联 (x2、x3、x4、x6)——不再在经纪商的固定时间框架之间任意跳转,您可以按图表时间框架的固定倍数分析结构,在每个尺度上保持相同的分形关系。 确认入场箭头 作为稳定且可恢复的执行层而设计的收盘确认箭头。当ABC设置形成且自适应确认逻辑在收盘K线上验证方向时,箭头会写入下一根K线的
FX Trend MT5 NG
Daniel Stein
5 (6)
FX Trend NG:新一代多市场趋势智能分析工具 概述 FX Trend NG 是一款专业的多时间周期趋势分析与市场监控工具,帮助您在几秒钟内全面了解市场结构。 无需在多个图表之间来回切换,您可以立即看到哪些品种处于趋势中、哪里动能正在减弱,以及哪些时间周期之间存在强烈共振。 限时发布优惠 – 仅需 $30(6个月) 或 $80 终身授权 即可拥有 FX Trend NG 。 已经是 Stein Investments 客户? -> 发送消息 以获取专属客户群访问权限。 需要帮助或安装指导? -> 请访问 Stein Investments 官方页面 。 1. FX Trend NG 的核心优势 三状态趋势逻辑 —— 不只是 Buy 或 Sell • 大多数指标仅显示两种状态:Buy 或 Sell。 • FX Trend NG 增加第三种状态: Fade 。 • Fade 表示趋势强度正在减弱,在完全反转之前提前发出信号。 这种结构化逻辑让您看到趋势变化过程,而不仅仅是简单方向信号。 多时间周期分析(M1 至 MN1) • 从短线交易到中长线交易全面覆盖。 • 快速识别趋势
Gann Made Easy MT5
Oleg Rodin
5 (4)
Gann Made Easy   是一个专业且易于使用的外汇交易系统,它基于使用先生理论的最佳交易原则。 W.D.江恩。该指标提供准确的买入和卖出信号,包括止损和获利水平。您甚至可以使用推送通知在旅途中进行交易。 购买后请联系我,即可免费获得交易指导和超棒的额外指标! 您可能已经多次听说过江恩交易方法。通常 Gann 的理论不仅对于新手交易者而且对于那些已经有一定交易经验的人来说都是非常复杂的东西。这是因为江恩的交易方法在理论上并不那么容易应用。我花了几年时间来完善这些知识,并将最好的原则应用到我的外汇指标中。 该指标非常易于应用。您所需要的只是将其附加到您的图表并遵循简单的交易建议。该指标不断进行市场分析工作并寻找交易机会。当它检测到一个好的入口点时,它会为您提供一个箭头信号。该指标还显示止损和获利水平。 换句话说,当您像先生一样进行交易时,该指标会为您提供最佳江恩建议。江恩亲自告诉你此时此刻该做什么。但最好的部分是您不需要了解任何有关江恩交易原则的知识,因为该指标会为您完成整个市场分析工作。
M30/H1/H4 波段版已上线 想抓住M5/M15无法捕捉的大行情? Gold Signal Swing Pro(M30/H1/H4)现已发售。 目标每笔$20-$80+。 https://www.mql5.com/en/market/product/177643 KURAMA GOLD SIGNAL PRO(MT5版)— 7层过滤器 XAUUSD完整交易系统 不重绘。不重画。不延迟。每个信号确认后永久固定。 买断版购买者专属福利:购买买断版许可证可免费获得 AI Zone Radar(价值$59)+ PDF使用手册。购买后请在MQL5上给我发消息。 AI Zone Radar: https://www.mql5.com/en/market/product/175834 在真实黄金交易员社区中使用,因精度和易用性获得高度评价。 你的问题 — 以及解决方案 黄金每天波动$30-$50。你知道机会就在那里。但你是否经历过: - 入场过早,价格反向运行$10后才朝你预期的方向走 - 每
GoldenX Entry MT5
Kareem Abbas
5 (8)
GoldenX Entry 是一款用于 MT5 的指标,包含自适应 Smart Entry Trend 算法、信号评分系统、市场状态识别器以及波动率过滤器。每个信号都包含计算得出的入场位、三个止盈位(TP1、TP2、TP3)以及止损位。它基于多个分析层构建,旨在适应不同市场条件,将多层分析系统与内置优化器及统计跟踪系统相结合。该指标基于风险收益比(RR)指标和历史交易行为提供量化分析。 开始使用非常简单——在所选时间周期上运行优化器,然后在图表上开始使用该指标。 核心功能 GoldenX Entry 将信号引擎与内置交易管理及历史统计跟踪整合在同一图表中: - 内置优化器: 优化器可在图表上单击运行。它通过两阶段搜索流程测试200种参数组合——先进行探索,再进行优化——并在完成后自动应用选定配置。结果会按时间周期缓存,因此当返回已优化的周期时,会立即恢复相同设置。 - 黄金品种自动周期识别: 将指标加载到任何 XAUUSD 图表(M1 到月线)。系统会自动识别当前周期并加载对应预设。共包含9个时间周期配置文件,专为黄金在标准周期上优化设计。切换周期时,参数会自动调整。 - 资金参考面
RelicusRoad Pro MT5
Relicus LLC
4.96 (24)
RelicusRoad Pro: 量化市场操作系统 终身访问限时 70% 折扣 - 加入 2,000+ 交易员社区 为什么大多数交易者即使拥有“完美”指标也会失败? 因为他们在真空中交易 单一概念 。没有背景的信号是赌博。要持续获胜,您需要 共振 (CONFLUENCE) 。 RelicusRoad Pro 不是一个简单的箭头指标。它是一个完整的 量化市场生态系统 。它描绘价格运行的“公允价值之路”,区分市场噪音和真实的结构性突破。 停止猜测。开始用机构级“路”逻辑进行交易。 核心引擎:“Road” (路) 算法 系统的核心是 Road Algo ,一个实时适应市场条件的动态波动率通道。它投射出 安全线 (平衡) 和价格可能反转的 扩展水平 。 Simple Road: 典型市场的标准结构映射。 Smooth Road: 针对震荡盘整的降噪计算。 Breakout Road: 专为识别波动率扩张和爆发性走势而调整。 1. 算法动量与确认 我们的“剥头皮箭头”不只是简单的交叉。它们利用 高阶多项式逻辑 过滤噪音,确保信号与主周期一致。我们检测动量、价格行为和 Road 结构汇聚的精确入场
Trend Catcher ind mt5
Ramil Minniakhmetov
5 (4)
趨勢捕捉指標 趨勢捕捉指標結合了作者獨有的客製化自適應趨勢分析指標,用於分析市場價格趨勢。它透過過濾掉短期噪音,並專注於潛在的動能強度、波動性擴張和價格結構行為,來識別真實的市場方向。此外,它還結合了平滑和趨勢過濾等客製化指標,例如移動平均線、相對強弱指標 (RSI) 和波動率過濾器。 您可以在這裡查看實際運行情況以及我的其他產品: https://www.mql5.com/en/users/mechanic/seller 請注意,我不會在 Telegram 上出售 EA 或任何設置,那是騙局。所有設定都可以在我的部落格上免費取得。 重要提示!購買後請立即聯繫我,以獲取使用說明和額外獎勵! 請注意,我不會在 Telegram 上出售 EA 或任何設置,那是騙局。所有設定都可以在我的部落格上免費取得。
ARIPoint
Temirlan Kdyrkhan
1 (1)
ARIPoint is a powerful trading companion designed to generate high-probability entry signals with dynamic TP/SL/DP levels based on volatility. Built-in performance tracking shows win/loss stats, PP1/PP2 hits, and success rates all updated live. Key Features: Buy/Sell signals with adaptive volatility bands Real-time TP/SL/DP levels based on ATR Built-in MA Filter with optional ATR/StdDev volatility Performance stats panel (Success, Profit/Loss, PP1/PP2) Alerts via popup, sound, push, or email Cu
Crystal Heikin Ashi Signals
Muhammad Jawad Shabir
5 (2)
Crystal Heikin Ashi Signals - Professional Trend & Signal Detection Indicator Advanced Heikin Ashi Visualization with Intelligent Signal System for Manual & Automated Trading Final Price: $149 ---------> Price goes up $10 after every 10 sales . Limited slots available — act fast . Overview Crystal Heikin Ashi Signals is a professional-grade MetaTrader 5 indicator that combines pure Heikin Ashi candle visualization with an advanced momentum-shift detection system. Designed for both manual traders
Atomic Analyst MT5
Issam Kassas
4.21 (33)
本产品已针对 2026 年市场进行更新,并针对最新 MT5 版本进行了优化。 价格更新通知: Atomic Analyst 目前价格为 $99 。 接下来的 30 次购买 后,价格将上涨至 $199 。 特别优惠: 购买 Atomic Analyst 后,请发送私信给我,即可免费领取 Smart Universal EA ,并将您的 Atomic Analyst 信号转换为自动交易。 Atomic Analyst 是一款不重绘、不回绘、不延迟的 Price Action 交易指标,专为手动交易、清晰信号和 EA 自动化而设计。 User manual: settings, inputs and strategy. 它分析价格行为、强度、动能、多周期方向和高级过滤器,帮助交易者减少噪音,避免弱势交易机会,并做出更有结构的交易决策。 该指标将复杂的市场计算转换为简单的视觉信号、彩色K线、趋势读数、止损水平和多个止盈区域,使交易者能够快速理解并应用于真实市场环境。 主要交易用途: 剥头皮和日内交易: 专为快速决策、清晰箭头、提醒、K线颜色和结构化进出场区域而设计。 日内交易和波段交易:
Reversion King Indicator
Eugen-alexandru Zibileanu
5 (3)
全新王者降临 - 指标 + 订单管理提示(TP1 + TP2 + TP3)+ 可选 Telegram 信号发送器 INCLUDED(免费) (完整交易与信号系统) 我们最强的黄金 EA: Gold Slayer 该指标包含先进的交易策略、可自定义订单管理系统,以及结合 Envelope 扩展的均值回归系统,并通过 RSI 等多重智能确认过滤器进行验证,以捕捉高概率反转入场机会,提供 BUY 与 SELL 信号。 你不仅能够学习如何交易,还能学会如何高效管理多个仓位,并利用之前盈利的持仓来覆盖亏损交易。 专为 M5 周期打造并优化,在 BTCUSD 和 XAUUSD 上表现尤为出色,因为这些市场的流动性能够让信号更加干净、可靠。 该指标会自动生成清晰的多头(Long)与空头(Short)信号,同时基于 ATR 自动计算入场位、止损位和止盈位,让风险管理从一开始就融入系统之中。 多 TP 系统设有三个渐进式目标位,你可以在 TP1 锁定部分利润、在 TP2 继续持仓,并在更大的行情中将仓位持有至 TP3,而这正是平均风险回报比真正开始大放异彩的地方。 默认参数开箱即用,已经针对稳定表现进行
Market Structure Order Block Dashboard MT5 是一款专为希望直接在图表上解读市场结构和主要价格反应区域的交易者设计的MT5指标。它结合了BOS、ChoCH、订单块(Order Blocks)、公允价值缺口(FVG)、流动性、Kill Zones、成交量分布图以及一个紧凑的面板,便于快速分析。 本指标面向使用市场结构、ICT和Smart Money概念作为决策框架的交易者。它可以帮助以更结构化的方式识别趋势延续、可能的反转、价格失衡、流动性目标和关注区域。 面向买家的资源 购买后可通过MQL5私信申请获取完整的PDF使用指南和参数配置建议。通过MQL5私信提供直接技术支持。 1.20版本带来两项重要新增: Pending BOS / Pending ChoCH 检测 和 可拖动面板 (按住面板标题栏即可将其拖动到图表任意位置,不影响图表本身)。当K线收于前一摆动点之外时,Pending Breaks 立即显示待确认的结构突破,无需等待经典的摆动确认。 重要 本产品仅为指标。它不会自动开仓、平仓或管理仓位。它不是EA(智能交易系统)。 主要功能 市场
Smart Structure Concepts MT5
Cristhian Alexander Gaibor Cuasquer
5 (1)
这不是又一个画区域却让你猜测的结构指标。 Smart Structure Concepts 为你阅读市场 — 在 XAUUSD(黄金)、外汇、指数、加密货币以及任何其他市场 实时标记 Smart Money Concepts (SMC / ICT) 结构。忘掉进入输入参数来配置每个区域:通过其 图表上的交互式仪表板面板 ,你只需一键即可决定显示、隐藏或调整内容 — 无需打开属性,无需重启指标。 此工具是 MetaTrader 5 不断扩展的指标和面板系列的一部分 — 所有工具都配有 11 种语言的教育性工具提示,并在每个图表中内置可视化导师。 每个工具都在你交易时教你:将鼠标悬停在任何区域、信号或水平上,解释会直接出现在图表上。没有黑匣子,没有盲目下单。你在交易中学习。 在此发现完整产品线: https://www.mql5.com/en/users/09151993a/seller 问题: 手动绘制和标记市场结构是最让交易者疲惫的事,无论是新手还是有经验者。每次切换图表或时间框架,都必须重新开始 — 标记区域、画线、手动识别 BOS 和 CHoCH — 一次误读就可能毁掉一个好的设
FX Levels MT5
Daniel Stein
5 (14)
FX Levels:适用于所有市场的高精度支撑与阻力 快速概览 想要精准确定适用于任何市场(外汇、指数、股票或大宗商品)的支撑与阻力吗? FX Levels 将传统的“Lighthouse”方法与前沿的动态分析相结合,实现近乎通用的准确性。依托真实经纪商经验和自动化的每日与实时更新, FX Levels 帮助您捕捉价格反转点、设置合理的盈利目标,并自信地管理交易。立即使用,体验更准确的支撑/阻力分析如何助力您的交易更上层楼! 1. 为什么 FX Levels 对交易者非常有利 极度精准的支撑 & 阻力区 • FX Levels 专为不同经纪商提供的行情源和时间设置而设计,可生成几乎相同的价位区,解决数据不一致的常见问题。 • 这意味着无论您在哪里交易,都能获得稳定一致的水平线,为策略打下更加牢固的基础。 结合传统与先进技术 • 通过将久经考验的“Lighthouse”方法与动态分析相融合, FX Levels 不仅限于每日刷新,还可针对新的价格波动进行即时更新。 • 您可以选择经典的静态方式,或实时捕捉新出现的水平,以贴近最新的市场行为。 识别清晰的反转点 • FX Lev
Trend Forecaster
Alexey Minkov
5 (7)
Trend Forecaster – Since 2023. The Trend Forecaster indicator utilizes a unique proprietary algorithm to determine entry points for a breakout trading strategy. The indicator identifies price clusters, analyzes price movement near levels, and provides a signal when the price breaks through a level. The Trend Forecaster indicator is suitable for all financial assets, including currencies (Forex), metals, stocks, indices, and cryptocurrencies. You can also adjust the indicator to work on any time
作者的更多信息
This indicator plots in the candles the divergence found in the selected indicator and can also send a notification by email and / or to the cell phone. Works on all TIMEFRAMES. Meet Our Products   He identifies the divergences in the indicators: Relative Strength Index (RSI); Moving Average Convergence and Divergence (MACD); Volume Balance (OBV) and;. iStochastic Stochastic Oscillator  (STOCHASTIC). It is possible to choose the amplitude for checking the divergence and the indicator has to b
Market Thermometer Jr
Edson Cavalca Junior
The Market Thermometer can be used to help traders identify sleepy or turbulent periods. It helps beginners to check when is the ideal time to enter operations, that is, when the value of the thermometer is below its average for several periods, identifying a peaceful market. When the market is heated, that is, the thermometer is above three times its average, it is time to make profits. The Thermometer measures the extent to which the end of a period, maximum or minimum price, projects outsid
The Market Thermometer can be used to help traders identify sleepy or turbulent periods.  It helps beginners to check when is the ideal time to enter operations, that is, when the value of the thermometer is below its average for several periods, identifying a peaceful market.   When the market is heated, that is, the thermometer is above three times its average, it is time to make profits.  The Thermometer measures the extent to which the end of a period, maximum or minimum price, projects out
Three Candles Pattern
Edson Cavalca Junior
5 (1)
The patterns of 3 (three) Candles: Three White Soldiers; Three Black Crows; These are reversal patterns widely used by traders, as they have a high probability of showing the inversion of the current market movement. For example, if in a bullish trend there are three black crows, there is a high probability of reversing the current bullish movement. The Three White Soldiers have the following characteristics: There are 3 consecutive candles with a good body, that is, the difference between th
This indicator is based on the system of three moving averages where: First is the fast average (MA1); Second is the intermediate average (MA2) and; T hird is the slow average (MA3). The theory covered in the technical analysis books informs us that when the first average exceeds the second average it is an alert for the trader, however the movement occurs when the second average exceeds the third. The indicator will insert the check s Parameters : Averages : Period Fast Moving Average(FMA); Smo
Accumulated Aggression
Edson Cavalca Junior
The indicator measures the accumulated balance of aggression. The formula is as follows:  Accumulated   = Previous Candle Accumulated + Purchase Volume - Sales Volume. Know our products    *** Did you like the product? Then, help us doing review in the " Reviews " tab. The indicator sends information to your email or cell phone when the accumulated balance changes direction. Example : Accumulated seller becomes a buyer. Note : It is recommended to use the default configuration and VPS valu
Balance Aggression
Edson Cavalca Junior
The indicator measures the balance of aggression. The formula is as follows:   Aggression  = Purchase Volume - Sales Volume. Note : It is rec ommended to use the default configuration and VPS values. It does not work in Forex. Meet Our Products     Parameters : Numbers of days prior to the current one for calculation; Volume Divider e; Enables calculation of the current candle; Histogram Line style and; Size; Line Line style and; Size;  Follow us on our website to check the next news.
The indicator plots the buying and selling volume on the chart. Two lines are generated corresponding to the average purchase and sale volumes. The crossing of averages, the increase in their distance are good indicators of market movement. Know our products    NOTES : It is recommended to use the default configuration and VPS values.  You need trading information (Time and Sales).   Parameters : Aggression Numbers of days prior to the current one for calculation; Volume Divider e; Enabl
Divergence Notification
Edson Cavalca Junior
This indicator plots in the candles the divergence found in the selected indicator and can also send a notification by email and / or to the cell phone. Works on all TIMEFRAMES. Meet Our Products   He identifies the divergences in the indicators: Relative Strength Index (RSI); Moving Average Convergence and Divergence (MACD); Volume Balance (OBV) and;. iStochastic Stochastic Oscillator  (STOCHASTIC). It is possible to choose the amplitude for checking the divergence and the indicator has to b
ACDO Brasil
Edson Cavalca Junior
The robo t opens a buy or sell position using the signs. Know our products   Position openings are based on the parameters identified as signals, if you activate all the robot will issue a trading order only if the number of signals is greater than the minimum stipulated by the user. The  filters  are used to increase the accuracy of the signals and if activated and not met your criteria, the order is not sent. EA also offers MOBILE STOP with the Parabolic SAR indicator and also by distance
Busque Trade
Edson Cavalca Junior
This indicator looks for SIGNS of Buy and Sell 14 SIGNS: Crossover of 2 moving averages; Crossover of 3 moving averages; RSI Indicator; Stochastic Indicator; Crossing line 0 MACD; Divergence of the RSI indicator; Divergence of the MACD indicator; Divergence of the OBV indicator; Divergence of the STOCHASTIC indicator; Three white soldiers candle pattern; Three black crows candle pattern; Hanging man    candle pattern; Hammer    candle pattern; Rupture Bands Bollinger. The indicator plots on
Topos Fundos
Edson Cavalca Junior
The robot opens positions from Tops and Bottoms Perform trend reversal operations. It has 3 levels of top and bottom measurement. Trader can open and close position on 3 strength signals. The expert also allows you to configure the maximum loss to move along with the price (moving stop). Know our products    Edson Cavalca Junior Systems Analyst WARNINGS The buyer declares himself capable of: We do not provide any trading or risk management advice, ideal configurations, promise of
Forca Relativa
Edson Cavalca Junior
The robot issues buy/sell signals based on the setting of the RELATIVE STRENGTH INDICATOR Know our products    Review and get a month's rental on any of our paid robots.  This Expert Advisor (EA) works on HEDGE (Forex, etc.) and NETTING (Bovespa, etc.) accounts, but manages only one position at a time. The  filters  are used to increase the accuracy  and if activated and not met your criteria, the order is not sent. 5 FILTERS available: ADX indicator; ADX + (DM +) and - (DM-) directional ind
Inversao Infinita
Edson Cavalca Junior
This robot operates through triggers above and below the previous candlestick with STOP orders. When reaching the trigger (Stop Order) it opens the order and we have three situations: If it reaches TAKE PROFIT (Maximum Profit) and the Breakeven Point is activated, it moves the STOP LOSS and the reverse STOP ORDER to Breakeven and cancels the reverse STOP order when reaching the TP. If you go to STOP LOSS after reaching breakeven, the trigger of the reverse order will be reached because i
Robo Nuvem
Edson Cavalca Junior
The robot uses one of the most used indicators in Asia: * ICHIMOKU CLOUD * There are two trading strategies: Crossing of Tenkan and Kijun lines and; Kumo lines crossing. Know our products    Position openings are based on the parameters identified as signals, if you activate all the robot will issue a trading order only if the number of signals is greater than the minimum stipulated by the user. This Expert Advisor (EA) works on HEDGE (Forex, etc.) and NETTING (Bovespa, etc.) accounts, but
Robo Bandas
Edson Cavalca Junior
The robot uses one of the most known and used indicators in the world BOLLINGER BANDS There are two trading strategies: Upper or Lower Band Break and; Bollinger Band Entry. Know our products    Position openings are based on the parameters identified as signals. This Expert Advisor (EA) works on HEDGE (Forex, etc.) and NETTING (Bovespa, etc.) accounts, but manages only one position at a time. The  filters  are used to increase the accuracy of the signals and if activated and not met your c
Zona de Trade
Edson Cavalca Junior
The robot operates within pre-configured channels at the beginning of the operation. Use a Demo account or the Strategy Tester to find the best setup for the asset you want to trade. If you have any doubts about handling the robot, send a comment in the "Comments" tab and we will respond and insert you in our private group. Follow the steps below to configure it. After dragging the robot onto the chart, go to "input parameters and configure the following data: Enter the number of l
Robo Sinal Telegram
Edson Cavalca Junior
Send your trades on the Metatrader 5 platform to your Telegram Group! Simple to use, just follow the steps below: Create a group in Telegram and enter the name in the robot parameters; Create a Bot in Telegram with the user BotFather: Send the following message-> /newbot; BotFather will ask for a name for your Bot; Send a message with the desired name; BotFather will ask for a username for your Bot; Send a message with the desired username; BotFather will send the Token; Insert the Token
Arbitragem B3
Edson Cavalca Junior
1 (1)
Arbitrage Robot IND/WIN or DOL/WDO This arbitrage robot works with WIN and WDO assets from the Brazilian Stock Exchange. The EA compares the best bid and ask (BID and ASK) of the "full" Index (IND) and compares it with the mini-index (WIN) and, if there is a gap between them, the difference in Ticks stipulated in the robot parameters, it opens a trade. It does the same analysis with DOL and WDO. It is necessary to insert the robot in the WIN or WDO chart and it will automatically fet
Tunel Vegas Sinal
Edson Cavalca Junior
Trader! Don't you want to spend all day on your computer screen looking at quotes? And do you want to receive stock buying/selling tips based on one of the most used indicators in FOREX on your cell phone? Then discover the Vegas Tunnel Support and product questions at the link below: Support This indicator searches for Buy and Sell SIGNALS in Stock Exchange Assets. It works on any asset on the market. Select in the parameters which Fibonacci line the signal will be sent and then jus
Robo Vegas
Edson Cavalca Junior
Robo Vegas The robot's trading signal is given by touching the channels created by a moving average and distanced lines based on the Fibonacci Theory. See the Vegas Tunnel Signal indicator. Parameter configuration can be obtained from Support. Support and product questions at the link below: Support Select in the parameters which Fibonacci line will be used to open positions. You will receive all updates and insertions of new trading signals. Discover our other Products Se
筛选:
QuakerDIOS
14
QuakerDIOS 2025.12.21 03:57 
 

Hola me baje el indicador "Aggression Volume Profile" y no anda

mataphutguru
26
mataphutguru 2025.01.20 09:26 
 

Works well on gold futures, I like it but requires considerable trading experience to use with confidence. Thank you

ZiadSherif11
56
ZiadSherif11 2025.01.19 13:29 
 

good one

Giovanni Di Grazia
130
Giovanni Di Grazia 2024.12.20 14:13 
 

good

Irusel
794
Irusel 2024.10.29 21:32 
 

Отличный

Edson Cavalca Junior
26677
来自开发人员的回复 Edson Cavalca Junior 2024.10.31 01:25
Спасибо
maiquelq2
15
maiquelq2 2024.08.22 16:37 
 

Bom trabalho indicador é muito completo.

Edson Cavalca Junior
26677
来自开发人员的回复 Edson Cavalca Junior 2024.08.22 21:32
Obrigado! E conheça nossos outros produtos. Sucesso em seus investimentos.
PichaiPraphas
69
PichaiPraphas 2024.07.23 08:56 
 

nice job

Edson Cavalca Junior
26677
来自开发人员的回复 Edson Cavalca Junior 2024.07.23 17:59
Thanks!
Alex
95
Alex 2024.07.04 15:35 
 

用户没有留下任何评级信息

Edson Cavalca Junior
26677
来自开发人员的回复 Edson Cavalca Junior 2024.07.23 18:00
Thanks!
[删除] 2024.05.19 03:32 
 

用户没有留下任何评级信息

Edson Cavalca Junior
26677
来自开发人员的回复 Edson Cavalca Junior 2024.05.19 03:47
Thanks!
Seth Tetteh
2588
Seth Tetteh 2024.04.25 12:35 
 

great

Edson Cavalca Junior
26677
来自开发人员的回复 Edson Cavalca Junior 2024.04.27 00:36
Thanks!
ArekJP
34
ArekJP 2024.01.11 20:51 
 

用户没有留下任何评级信息

Edson Cavalca Junior
26677
来自开发人员的回复 Edson Cavalca Junior 2024.01.11 22:10
Thanks!
sharpie0319
22
sharpie0319 2023.12.19 07:16 
 

For those wanting to try in GOLD, it doesn't work.

Edson Cavalca Junior
26677
来自开发人员的回复 Edson Cavalca Junior 2023.12.19 22:54
Hello! It works in gold just choose the Volume Tick option
Andrew_ft
85
Andrew_ft 2023.06.06 11:29 
 

Very good!! Light,works very good not like others indicators tested. If there were the possibility to change the time calculate it will be greater! (for example 1week,4h,1h,30m,15m)

Edson Cavalca Junior
26677
来自开发人员的回复 Edson Cavalca Junior 2023.06.08 02:58
Hello! Thanks, i will analyse your suggestion.
wnunes_grafic
14
wnunes_grafic 2022.11.18 04:04 
 

用户没有留下任何评级信息

Edson Cavalca Junior
26677
来自开发人员的回复 Edson Cavalca Junior 2022.12.08 19:07
Olá wnunes_grafic! Esse indicador necessita de Time And Sales, ou seja, funciona apenas em ações e futuros pois esses possuem dados de negociações, em Forex ele não funciona, pois não há disponibilização dos registros de negociações.
ssarabeso
35
ssarabeso 2022.05.17 00:03 
 

works fine.. thank you very much

Edson Cavalca Junior
26677
来自开发人员的回复 Edson Cavalca Junior 2022.05.17 00:17
Hello Ssarabeso! Thanks!
回复评论