适用于MetaTrader 5的技术指标 - 15

Introduction to Fractal Pattern Scanner Fractal Indicator refers to the technical indicator that makes use of the fractal geometry found in the financial market. Fractal Pattern Scanner is the advanced Fractal Indicator that brings the latest trading technology after the extensive research and development work in the fractal geometry in the financial market. The most important feature in Fractal Pattern Scanner is the ability to measure the turning point probability as well as the trend probabil

Market Hours Pro shows Tokyo, London, and New York trading sessions directly on your MT5 chart, including scheduled overlap periods. It’s designed to give you a clear view of global market timing so you can plan trades, spot high-activity periods, and align strategies with standard Forex hours. How It Works Displays scheduled session times visually on your chart. Highlights session overlaps for London/New York and Tokyo/London. Automatically adjusts times for your timezone or broker time. Shows
FREE

Market Structure Internal & External (CHoCH/BoS) Описание: Индикатор Market Structure Internal & External (CHoCH/BoS) — это мощный инструмент для анализа структуры рынка (Market Structure - MS) , который автоматически определяет и визуализирует ключевые точки разворота (свинги) и пробои структуры на двух различных временных масштабах/глубинах: Внутренней (Internal) и Внешней (External) . Он использует концепции Change of Character (CHoCH) и Break of Structure (BoS) из методологии Smart Money Con
FREE

HiLo Activator is a technical analysis indicator developed by Robert Krausz, a renowned hungarian trader with a career in the USA.
It is a trend indicator that helps you to predict the cange of the current trend. In an uptrend it is displayed at the bottom of the candles; in a downtrend it is displayed at the top.
Its only setting is the calculation period.
It is possible to have alerts when a new trend begin. Enjoy! This is a free indicator, but it took hours to develop. If you want to pay me a
FREE

This Quarter Levels Indicator for MQL5 is a sophisticated technical analysis tool designed to capitalize on "Psychological Levels" or "Round Numbers" in financial markets. It operates on the principle that institutional order flow, stop-losses, and take-profit targets tend to cluster at specific mathematical intervals—specifically the whole numbers ( 00 ), midpoints ( 50 ), and quarter points ( 25 and 75 ). By dividing price action into these four distinct quadrants, the indicator provides a cle
FREE

A combined indicator of two famous indicators: RSI , Bollinger Bands Can be used in all currency pairs Can be used in all time frames with many signals Very simple and fast to use
Description:
This indicator is made from the combination of RSI and Bollinger Bands indicators
As you can see, it shows good signals and is worth using and testing
We hope you are satisfied with this indicator
Settings: show past show candle: Displays the number of candles that the indicator calculates.
For example
FREE

Trend Catalyst Pro 专业的多趋势指标,具有7重确认、智能警报、新闻概览和MetaTrader 5的集成仪表板。 Trend Catalyst Pro将七个经过验证的市场指标的信号合并为一个清晰的评分。无需单独分析每个指标,您可以在图表蜡烛上获得可见的结果: 箭头和文本,如"6/7 LONG"或"7/7 SHORT" 根据信号强度进行颜色编码的蜡烛 实时清晰显示所有值的仪表板 显示下一次因新闻可能发生的强劲波动的新闻线 目标很明确:减少猜测,更多客观确认,更清晰的决策。 7点趋势评分如何工作 每根蜡烛基于七个组成部分进行评估。每个看涨条件在多头侧得一分;每个看跌条件在空头侧得一分。结果是0到7的评分。 使用以下内容: ADX与+DI和−DI ADX测量是否存在趋势。高于25的值,市场被视为"趋势性"。 如果+DI高于−DI,一分流向看涨方向;如果−DI在上方,则计入空头。 优势:您优先在市场确实有动向的地方交易,而不是在横盘阶段挣扎。 CCI(商品通道指数) CCI高于100表示强劲的买入压力,低于−100表示强劲的卖出压力。 这过滤掉弱反向运动,专注于明确的极端情况
FREE
Reverse RSI Signals Indicator
The Reverse RSI Signals indicator is a versatile technical analysis tool designed for MetaTrader 5 (MT5). It transforms traditional RSI calculations into dynamic price-based bands, integrates Supertrend for trend identification, and includes divergence detection for potential reversal signals. This overlay indicator provides visual and alert-based insights to help traders spot overbought/oversold conditions, trend shifts, and momentum divergences directly on the p
FREE

凤凰K线形态监测器(MT5)
专为MetaTrader 5设计的实时K线形态检测与监控工具。可跨多个交易品种自动识别经典K线形态,并通过可视化仪表盘展示全面的形态统计数据。
概述
凤凰K线形态监测器可识别并追踪十字星、锤子线、流星线、看涨吞没、看跌吞没、晨星、暮星、三白兵及三乌鸦等形态。系统支持同时扫描最多18个可配置交易品种,并为每个监控品种维护形态计数统计。
仪表盘以简洁网格格式展示形态出现情况,显示交易品种名称、总形态计数及最新检测形态。每种检测到的形态均可在图表上触发可自定义颜色的视觉箭头,区分看涨与看跌信号。形态检测基于K线收盘价运行,确保信号确认且不会重绘。
警报功能包括弹出通知、声音提醒及移动端推送通知,当监控品种出现形态时触发。系统支持按形态筛选警报,交易者可专注特定形态并忽略其他形态。所有形态定义均采用标准K线分析规则,支持自定义灵敏度阈值(如十字星检测及实体与影线比例)。
指标支持从仪表盘一键切换交易品种,实现监控工具间的快速导航。可配置热键可独立控制面板可见性、图表箭头或两者同时切换。形态统计数据在图表重启后持续保留,并在整个交易时段内累积。
安装指
FREE

This indicator draw a line on high and low levels of X number of days. It is possible to have an alert (in the software and mobile app) for when the price breaks the high or low of the current day. Configurações: Days - past days to calculate (1 = actual day only).
Alert when reach levels - activate the alert for specific levels or both.
Push notification - enable the alert to the mobile MT5 app.
Appearance
High - high level color.
Low - low level color.
Size actual day - thickness
FREE

The fact that round number levels have a significant influence on the market cannot be denied and should not be overlooked. These psychological levels are used by both retail Forex traders and major banks that deal in Forex. Very simple and effective indicator and most importantly free. ////////////////////////////////////////////////////////////////////////////////////////////////////////////////////////////////////////////////////////////// The program does not work in the strategy tester.
FREE

BREAKOUT-SESSION-BOX LONDON EU US ASIA Open
watch the expectation of a volatile movement above or under the opening range We take the high of the range as Entry for a long trade and SL will be the low of the range and vice versa the low of the range as Entry for a short trade and the high for SL The size of the range is the distance to the TP (Take Profit) The range of the opening hours should not be larger than about 1/3 of the average daily range 4 breakout examples are already predefined: A
FREE
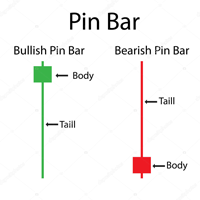
Pin bar pattern is characterized by a long upper or lower wick with a small body relative to the size of the wick with little to no lower or upper shadows. Pin bars are not to be traded in isolation , but need to be considered within the larger context of the chart analysis. A pin bar entry signal, in a trending market, can offer a very high-probability entry and a good risk to reward scenario.
Inputs Multiplier ; AlertOn - enable alerts; EmailAlert - enable email alerts; PushAlert - en
FREE

Magic Candles 是一款新产品,可以识别当前的市场阶段(上升趋势、下降趋势或持平)。
该指标根据市场的当前状态用不同的颜色绘制条形,并通过警报向用户发出趋势变化的信号。
Magic Candles 非常适合交易货币(包括加密货币)和二元期权。
优点 适合倒卖和日内交易。 该指标不会重新绘制(重新计算),信号严格在“柱线收盘价”上生成。 它可以作为独立工具使用,也可以与其他指标一起使用。 关于新指标信号的电子邮件和移动设备通知系统。 简单的指标设置,最少的参数。 适用于任何金融工具和市场。
如何使用产品 当最后一根蜡烛的颜色从灰色变为红色时,打开卖单。
当蜡烛颜色从灰色变为绿色时,打开买入订单。
当出现灰色条时,关闭未平仓订单,因为预计会持平。
参数 Zone BUY - 买入蜡烛的颜色(默认为绿色)。 Zone SELL - 卖出蜡烛的颜色(默认为红色)。 Neutral zone - 平面颜色(默认为灰色)。 Alert - 启用/禁用警报。 如果 true - 启用, false - 禁用。 Email - 启用/禁用发送电子邮件。 如果 true - 启

VJ Sniper - MT5 Buy / Sell Indicator: This Indicator is as simple as Buy in Up Trend & Sell in Down Trend. There are Support / Resistance Graphic levels for choosing the best Entries. Background: Any in-built indicator of MT5 does not work as stand alone such as Stochastic, CCI or DeMarker etc. But combination of them with trend projection work & give the best results for Trading entries. So this Indicator is blended to give the best

This indicator displays pivot points in the chart, including historical vales, and supports many calculation modes for Pivot Points and S/R levels. [ Installation Guide | Update Guide | Troubleshooting | FAQ | All Products ] It plots historical levels for backtesting purposes
It allows you to select the reference timeframe It implements different Pivot Point calculation modes It implements different SR calculation modes
It implements customizable colors and sizes
Calculation Modes The indicato
FREE
If you love this indicator, please leave a positive rating and comment, it will be a source of motivation to help me create more products <3 How to use Gann High-Low Activator? The Gann HiLo Activator helps the trader identify the current trend of the market. When the indicator is below the closing price, it can indicate that an uptrend is taking place. Conversely, when the indicator is above the closing price, it can indicate a downtrend. The Gann HiLo Activator also generates buy and sell sig
FREE

Easily get all relevant economic events of the current day right into your chart, as markers. Filter what kind of markers do you want: by country (selected individually) and by Importance (High relevance, Medium, Low or any combination of these). Configure the visual cues to your liking. If there is more than one event set to the very same time, their Names will be stacked and you will see the messages merged with the plus (+) sign on the marker. Obviously that long or too much events on the sam
FREE

SMART SD ARROW INDICATOR
Trade Smarter, Not Harder: The Smart SD Arrow Indicator That Paints Clear Buy & Sell Signals Right On Your Chart!
Finally, an All-in-One Supply & Demand Tool That Doesn’t Just Draw Zones—It Gives You Precise, Actionable Entry Arrows. Stop Analyzing, Start Executing.
Dear Trader,
Let's be honest. You've tried indicators that draw complicated zones all over your chart. They look smart, but when it's time to pull the trigger, you're left with the same old question:
FREE

With this easy to set up indicator you can display and set alerts for the following candlestick formations: Bull Breakout, Bear Breakout, Hammer, Pin, Bullish Engulfing, Bearish Engulfing. Input parameters: ShortArrowColor: The color of the Arrows, displaying a Bearish candle formation LongArrowColor: The color of the Arrows displaying a Bullish candle formation BullishEngulfing: Disabled/Enabled/EnabledwithAlert BearishEngulfing: Disabled/Enabled/EnabledwithAlert Pin: Disabled/Enabled/Enabledw
FREE

Candle Number Indicator for MetaTrader 5 The Candle Number Indicator displays a numeric label on each candlestick, starting from the most recent bar. This tool assists traders in visually tracking candle progression, which may support strategies based on time, structure, or pattern identification.
Features: Numbers each candle from the current bar backward Allows custom color, horizontal or vertical text orientation, and label offset Option to limit display to recent candles (e.g., last 10 bar
FREE

Swing BOS Structure is a market structure indicator for MetaTrader 5.
The indicator automatically detects: • Swing High (SH) • Swing Low (SL) • Break of Structure (BOS) • Change of Character (CHoCH)
Swings are confirmed only after a defined number of candles, ensuring no repainting. BOS signals indicate trend continuation. CHoCH signals indicate a potential change in market structure and may appear less frequently depending on market conditions and timeframe.
The indicator is lightweight, fa
FREE

If you have the opportunity to read the book " Trend Trading - A Seven-Step Approach to success " by Daryl Guppy, you will have a great deal of information about how to "read" the market. In his book Daryl show, among other things, how can we use a visual tool to measure the volatility and trend between Long and Short-term periods: The GMMA - Guppy Multiple Moving Averages .
Instead of using his original idea of having 12 Exponential Moving Averages in your chart - which could be very CPU-deman
FREE
The Ultimate Dashboard New Year Sale - save $20 (normal price $79) Indicators are useful for traders, but when you put them into a dashboard that can scan 28 symbols at once they become even better, and when you can also combine different indicators and timeframes to give you synchronized alerts, then they become awesome. This easy to use dashboard provides you with 32 leading indicators, use them individually or together, to create powerful combination alerts. So when you want to know that RS

MACD 2 Line MTF (Multi-Timeframe) Indicator for MetaTrader 5 This custom MetaTrader 5 indicator implements a classic MACD with two lines (MACD Line and Signal Line) and a color-coded histogram , enhanced with multi-timeframe capability . It allows traders to monitor MACD trends from higher or lower timeframes directly on the current chart. Key Features: MACD Line (Fast EMA minus Slow EMA) Signal Line (SMA of MACD Line) Histogram Up/Down : Displays positive values in green and negative values in
FREE
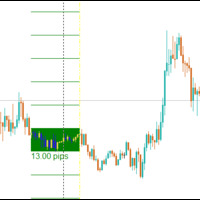
The Central Bank Dealers Range (CBDR) is a key ICT concept, used to project potential highs and lows for the day based on market conditions during a specific time window. The CBDR is utilized to forecast price movements in both bullish and bearish market conditions. By identifying this range, traders can better anticipate the price levels that may form as the day progresses.
CBDR and Standard Deviation A key feature of the CBDR is its application of standard deviation , a statistical measure u
FREE

The Advanced Trend Scalper MT5 indicator is designed to help both novices and professional traders. The indicator analyses the market and gives you buy and sell signals. It does not use any other indicators, it works only with the market actions. The signal appears right after the candle close and it does not repaint. The efficient algorithm provides a high degree of reliability of such signals. Advanced Trend Scalpe r for the MetaTrader 4 terminal : https://www.mql5.com/en/market/product/
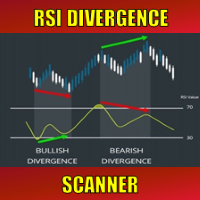
Special offer : ALL TOOLS , just $35 each! New tools will be $30 for the first week or the first 3 purchases ! Trading Tools Channel on MQL5 : Join my MQL5 channel to update the latest news from me 在动态的金融市场中,识别趋势反转信号对于有效交易至关重要。RSI Divergence Scanner 旨在帮助您准确高效地检测各种货币对和时间框架下的 RSI 背离信号。 查看更多 MT4 版本请访问: RSI Divergence MT4 Scanner 查看更多产品请访问: 所有 产品 1. 理解 RSI 背离 RSI(相对强弱指数) 是一种衡量价格动量的技术指标,广泛被交易者使用。RSI 背离发生在价格走势和 RSI 方向相反时,表明潜在的趋势反转。 背离类型: 看涨背离: 价格形成更低的低点,但 RSI 形成更高的低点。 表明下跌趋势可能在减弱,可能
FREE

A personal implementation of the famous Bollinger bands indicator as a trend following mechanism, which uses a moving average and the standard deviation to define what a trend is and when it changes. Bollinger bands are usually used as an oversold/overbought indicator only, but in my opinion, the trading approach is more complete using the trend variant as an exit strategy. [ Installation Guide | Update Guide | Troubleshooting | FAQ | All Products ] Easy to trade Customizable colors and sizes I
FREE
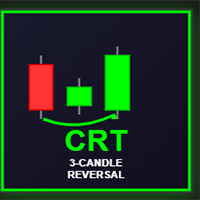
CRT Bomb Indicator - MT5 Full Version The CRT Bomb is a professional trading indicator that detects high-probability 3-candle reversal patterns (CRT - Candle Reversal Technique) across all timeframes and symbols. VPS is recomended so that you dont miss any CRT setups as they form , for entries you can use your manual analysis for confirmation like FVG, OBS etc Works on all Pairs ,Metals & Indices Key Features: Identifies impulse-trap-reversal candle structures Provides visual arrows and patter

The Range Filter Buy and Sell indicator is a trend-following technical analysis tool designed to identify optimal entry and exit points in the market. It filters out market noise by creating dynamic bands around price movements, generating clear buy and sell signals when price breaks through these bands. Key Features Dynamic Range Filtering : Uses a sophisticated algorithm to calculate adaptive bands that adjust to market volatility Trend Identification : Clearly visualizes the current trend dir
FREE

Linear Regression Trending indicator analyzes price trends by plotting a linear regression channel based on user-defined parameters such as source (for example, close prices), channel length, and deviation multiplier.
How It Works: - The indicator calculates a linear regression line over the specified length, forming a channel with upper and lower boundaries offset by the deviation value. - It detects price breaks from the channel and optionally displays broken channel lines (in a customizable
FREE

One of the good and important features in MT4 is the availability of the iExposure indicator. With the iExposure indicator, traders can see a comparison of ongoing open positions and how much funds have been used, and more importantly what is the average value of these open positions.
Unfortunately this indicator is not available on MT5.
This indicator is iExposure MT4 which I rewrote using the MT5 programming language. This indicator can be used like iExposure on MT4 with the same functions.
FREE

John Bollinger created this indicator in 2010 as a way to read the original indicator (Bollinger Bands) in a more "technical" way, shown as an oscillator. The typical range of the Bollinger Bands %B is 0 - 0.5 - 1.0, where "0" represents the lower band, the "0.5" the middle band, and "1" the upper band. The line on the indicator represents the Closing prices. As simple as that.
SETTINGS
Bollinger Bands period of analysis Standard Deviation multiplier Shift Price type to be analyzed
If you like
FREE

This indicator shows the breakeven line level for the total number of open positions of the current symbol with P/L value and total volume. This indicator is helpful to decide the exit level when using a trading grid strategy. The style of the breakeven line is customizable to choose the color, line shape and font size of the positions description. Send mobile notification when crossing a positive P/L target
FREE

This indicator calculates the volume profile and places labels that correspond to the VAH, VAL and POC levels, for each candle individually.
Indicator operation features The indicator works on the timeframes from M3 to MN, but it uses the history data of smaller periods: M1 - for periods from M3 to H1, M5 - for periods from H2 to H12, M30 - for the D1 period, H4 - for the W1 period, D1 - for the MN period. The color and location of the VAL, VAH and POC labels on the current candle are considere
FREE

Candle Time Countdown is a professional MT5 indicator developed to displays in real-time the countdown showing the remaining time until candle close across multiple timeframes simultaneously. The indicator features intelligent color-coded visual feedback where each timeframe's text dynamically changes to bright lime green for bullish candles and red for bearish candles, with each timeframe updating independently based on its own candle direction.
Key Features Multi-Timeframe Support: M1, M5, M1
FREE

Time your Entry and Exits with Average True Range (ATR) Trailing Stops ATR Trailing Stops are primarily used to protect capital and lock in profits on individual trades but they can also be used, in conjunction with a trend filter, to signal entries. The indicator will help make your calculation of stop loss easier as it will be visually aiding you in choosing where to put your stoploss level on the chart by calculating the current value of ATR indicator. For those who are unfamiliar with ATR, i
FREE

FREE

Bring the popular "Crosshair with Magnet Mode" functionality from modern charting platforms directly to your MetaTrader 5 terminal. Crosshair for MT5 is a precision utility tool designed for traders who demand accuracy. Unlike the standard MT5 crosshair, this smart tool automatically detects Open, High, Low, and Close prices on your candles. When your mouse hovers near a candle, the crosshair "snaps" to the nearest wick or body price, ensuring you are looking at the exact price level every tim
FREE

FREE

This indicator finds Double Top and Double bottom Example : What is Double Top When price establishes a new high and then falls, then reverse to the same candle area of High then its considered a valid double top and vice versa for double bottom. 1. It plots and high and low on visible chart if ChartChange is set to true else it searches on new bar opening
2. If there is double top and double bottom found in visible chart window then it plots a line 3. It has options to customize text color, tex
FREE

使用此指标获取市场内发展趋势的警报。
使用此指标,您将能够获得有关市场发展趋势的警报。 该指标可用于识别趋势中的入口或出口。 该指标结合了来自更高时间框架的信息,以及当前时间框架的价格变动,以输出买入或卖出信号。 该指标可以识别趋势变化,或主导趋势的延续。
注意:趋势跟踪的赢率很低,但趋势的回报可能是平均损失的3到5倍。 简单的设置 拖放到任何图表,在任何时间框架. 启用警报(可选) 你就完了! 视觉和音频警报 警报直接发送到您的手机 弹出警报发送到您的终端 多用途 股票、外汇、期权、期货 灵活 适用于任何时间范围
注意:趋势跟踪的赢率很低,但趋势的回报可能是平均损失的3到5倍。 注意:趋势跟踪的赢率很低,但趋势的回报可能是平均损失的3到5倍。
FREE
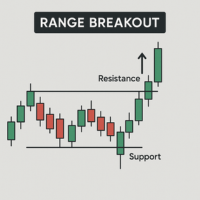
If you love this indicator, please leave a positive rating and comment, it will be a source of motivation to help me create more products <3 Key Takeaways Automatically draws Range High and Range Low boundaries for a chosen time period. Alerts when price breaks above or below the defined range. Support sending notifications via alert, email, notification when breakout occurs. Can be used as a trade signal in breakout-based strategies. However, like all indicators, it isn't foolproof, to avoid
FREE

Sessions are very important in trading and often good area where to look for setup. In SMC, ICT we will look for Asian session to serve as liquidity
This indicator displays: High & Low of the Asia session Midnight New York time opening line
Congifuration Line Style, color Label position, size, color Start of the level (Start of the day, Start of the session, Highest or Lowest point in the session)
Any questions or comments, send me a direct message here https://www.mql5.com/en/users/mvonline
FREE

Are you tired of plotting Fibonacci retracements or extensions manually? This indicator displays Fibo retracements or extensions automatically, calculated from two different price points, without human intervention or manual object anchoring. [ Installation Guide | Update Guide | Troubleshooting | FAQ | All Products ] Easy to use Manual anchoring is not needed Perfect for price confluence studies The indicator evaluates if retracements or extensions are needed Once drawn, you can manually edit t
FREE

N/B: All our product purchase comes with our free ‘’DAILY SCALPER EA’’ - bit.ly/4qlFLNh Whatsapp Developer for yours after successful purchase
OMEGA ONE SPIKE DETECTOR: Catch Every Explosive Move /Spikes with Surgical Precision
"I Used To Watch Spikes Fly By - Now I Catch Them Consistently Using Institutional Order Levels"
WATCHING 500-POINT SPIKE and not profiting? ENTERING TOO LATE after the big move already happened? GETTING STOPPED OUT right before the explosion?
What If

锚定VWAP 锚定VWAP是传统VWAP的一种变体,该指标的计算从特定的时间点(锚点)开始,而不是从交易时段开始或固定时间间隔计算。这对于希望从特定事件(如重大新闻、趋势开始或技术事件(例如支撑位或阻力位的突破))评估价格与成交量关系的交易者非常有用。 该指标适用于外汇、股票和指数。 您可以在同一图表上添加多个实例,并通过单击修改每个VWAP的锚点。 当价格触及VWAP时启用警报。 VWAP具有"磁性":鼠标位于K线上方时,自动配置为HIGH;位于中心时,为TYPICAL;位于K线下方时,为LOW。 .....................................................
FREE

Trend Dashboard / Trend Scanner – Smart Multi-Timeframe Tool Our Trend Dashboard is an advanced tool for trend analysis that allows you to monitor multiple symbols and timeframes in one place. It displays the current trend direction on popular intervals such as M1, M5, M15, M30, H1, H4, and D1, enabling traders to quickly assess market conditions without manually checking multiple charts. Features: Trend indicators for multiple timeframes in a single dashboard Color-coded trend display: bullish,
FREE

FVG智能区域 - 免费版
MetaTrader 5 (MT5) 公允价值缺口检测指标 您是否在寻找真正的交易工具,而不仅仅是另一个随机指标?
FVG智能区域 - 免费版通过自动检测公允价值缺口(FVG)并在图表上直接高亮显示高概率交易区域,为您提供专业的市场洞察。 专为以下交易者打造:
聪明资金概念(SMC)
ICT交易概念
价格行为
供需分析
机构交易策略 该指标帮助您专注于真正重要的事情:价格可能做出反应的区域。 主要特点: 智能区域检测:
自动检测看涨和看跌缺口
清晰、专业的视觉区域
智能过滤以消除弱相关或不相关的缺口 高级确认:
更高时间框架(HTF)汇合验证
当价格填补时智能移除无效区域
活动区域与已填补区域之间的清晰视觉区分 优化性能:
轻量快速 - 不会拖慢您的图表
兼容所有货币对和时间框架
真实交易条件下的平稳运行 完全自定义:
完全可调整的颜色和视觉风格
完美适用于外汇、黄金(XAUUSD)、指数和加密货币
适合日内交易、波段交易和剥头皮交易
FREE
SizeInPips Indicator – Visualize Candle Size with Ease!
Unlock the power of price action analysis with the SizeInPips Indicator ! This simple yet powerful tool is designed for traders who want to quickly measure and visualize the size of each candle (bar) in pips, helping you make informed trading decisions with confidence. Whether you're a beginner or an experienced trader, SizeInPips is the perfect addition to your MetaTrader 5 toolkit.
What Does It Do? The SizeInPips Indicator calculates
FREE

SummarySignalLine is an intelligent multi-indicator for MetaTrader 5 that combines signals from five classical technical indicators into a single smoothed signal line. The indicator visualizes overall market sentiment in a simple, intuitive format with color coding. Key Features Composite Analysis — combines MA, RSI, Bollinger Bands, Stochastic, and ATR Smoothed Signal — reduces market noise with configurable smoothing Visual Clarity — color gradient from green (bullish) to red (bearish)
FREE

Stochastic indicator alerts when EA Available in comments , must have indicator installed buys stochastic main line is above signal line stochastic is below 30 rsi 5 is below 20 sell stochastic main line is below signal line stochastic is above 70 rsi 5 is above 80 ADD to chart Stochastic k 30 - d 9 - slowing 3, levels 30/70 rsi 5 lelels 20.80
Full alerts push, mobile , email ect All input settings variable feel free to contact for more information or alert sugestions
FREE

Identify key turning points with reliable fractal analysis
This indicator examines the price structure of fractals of different periods to determine possible reversal points in the market, providing timing to positional traders that already have a fundamental or technical valuation model. Unlike its younger brother, Reversal Fractals , this indicator won't miss reversals because of the period selected, and will find reversal fractals on a zig-zag fashion, ignoring those reversals which do not

Trading Session Indicator The Trading Session Indicator visualizes the high and low points as well as the start and end times of the Asian, London, and New York trading sessions directly on your chart. Features: Visualization of major trading sessions Highlighting of high and low points Display of start and end times for each session Customizable session times User-friendly and efficient Customizability: Each trading session (Asian, London, New York) can be individually customized to match speci
FREE
ZigZag Optimized 指标介绍 ZigZag Optimized 指标由 MetaQuotes Ltd. 开发,已更新至 2.00 版本,是 MetaTrader 5 平台上强大的技术分析工具。设计目的是通过连接价格的峰值和谷值来识别显著的price reversal,为交易者提供更高的准确性。 关键优势 精确的背离支持 : 帮助确定合理的价格区域,与 RSI 搭配使用时与背离算法高度兼容。 高级噪声过滤 : 利用 InpNeighborCount 和 InpThresholdRatio 检测异常值并调整价格以确保稳定性。 可定制参数 : 提供灵活的输入选项,如 InpDepth (12)、 InpDeviation (5) 和 InpBackstep (3),适用于个性化分析。 视觉增强 : 包含可选的 InpShowLabels 功能,在关键点显示价格标签。 高效性能 : 优化后的代码确保即使处理大数据集也能平稳运行。 应用 趋势分析 : 适合识别主要趋势和支撑/阻力位。 艾略特波浪分析 : 支持波形模式识别。 背离检测 : 提高基于背离的交易策略精度。 自动交易 :
FREE

The Advanced Support and Resistance Indicator for MetaTrader 5 leverages sophisticated pivot point detection algorithms to autonomously identify and visualize critical price levels on the chart. Utilizing a configurable pivot period (default: 20 bars) and data source (High/Low or Open/Close), it intelligently scans historical price action within a user-defined loopback window (default: 290 bars) to pinpoint pivot highs and lows with strict validation criteria for enhanced precision. Pivots are d
FREE

Hull移动平均线(HMA)MT5版——高速、平滑、近乎零滞后的专业趋势指标
Hull移动平均线(HMA)是一款为MT5平台打造的高性能趋势分析指标。它能够在保持极度平滑的同时实现接近零滞后的响应速度,比传统的SMA、EMA或WMA更快、更精准地反映市场方向变化,并有效过滤噪音,特别适合剥头皮交易者和日内交易者使用。 该指标基于高效的加权移动平均算法,严格按照Alan Hull公式计算,输出真实、稳定且不重绘的趋势线,让交易者能够清晰识别趋势的加速、减速、反转与延续。HMA不仅运行轻量、绘图顺畅,还兼容EA,可通过iCustom轻松调用。 核心优势
几乎零滞后的即时趋势响应
曲线极度平滑,噪音过滤效果优秀
比SMA/EMA/WMA更精准、更快速
完全不重绘,EA友好,可用于自动化策略
适用于所有交易品种:外汇、黄金、指数、加密货币等 适用场景
趋势方向识别、顺势入场、回调买卖点、反转信号、离场确认、自动化策略开发等。 这是一款干净、稳定、快速的HMA指标,专为追求精准和效率的专业交易者打造。
FREE

All-in-one trading powerhouse: trend, reversal, and exhaustion detection
This indicator is a personal implementation of the famous Traders Dynamic Index, which uses RSI, moving averages and volatility bands to find trends, reversals and price exhaustions. However, this particular implementation supports not only RSI, but many others. It is suitable for scalping, day trading, and swing trading and aims to provide a full picture of the current market conditions. [ Installation Guide | Update Guid
FREE
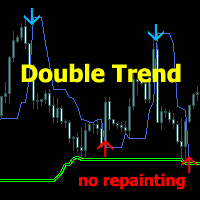
Trading System Double Trend MT5 - 个由多个指标组成的独立交易系统。它能够判断总体趋势,并发出价格变动方向的信号。
可用于剥头皮交易、日内交易或周内交易。
功能
适用于任何时间框架和交易工具(外汇、加密货币、贵金属、股票、指数)。 信息直观易读,无需加载图表 指标不会重绘,也不会完成信号 仅在 K 线收盘时生效 提供多种信号提醒类型 直观易懂,只需将其附加到图表上并遵循信号的简单建议即可。
系统中每个趋势的输入参数均可配置。
General trend - 判断总体趋势 Signal trend - 发出入场和出场信号。 Play sound / Display pop-up message / Send push notification / Send email - 出现信号箭头和止损时使用提醒。 Sound for signals - 信号声音文件。
使用方法
General trend - 浅绿色线,如果高于价格 - 趋势为下行;如果低于价格 - 趋势为上行。当趋势发生变化时,会出现信号箭头。
Signal trend - 跟随价

Auto Fibo Expansion is an indicator that projects the Fibonacci expansion levels above and below the opening price of the day. It does the calculation based on the previous day and projects the levels on the current day. It is very efficient to find "psychological" zones of support and resistance. Its appearance is all configurable and you can set up to 30 different levels. Enjoy! This is a free indicator, but it took hours to develop. If you want to pay me a coffee, I appreciate a lot <3 PayP
FREE

Engulfing Candle Detector
Detectable pattern Double Candlestick Patterns Bullish Engulfing
The first candle is black candle. The second candle opens with a gap below the real body of the black candle but rallies upwards to close above the real body of the black candle. In other words, the second candle's real body completely engulfs the first candle's real body Bearish Engulfing
The first candle is white candle. The second candle opens with a gap above the real body of the white candle but dec
FREE

DESCRIPTION:
-----------
KS Dynamic Trendlines is an advanced indicator that automatically detects swing points
and draws intelligent trendlines that adapt to market conditions in real-time.
KEY FEATURES:
------------
Automatic swing high/low detection
Dynamic trendline generation connecting swing points
Real-time break detection - broken trendlines disappear automatically
Next strongest trendline appears when current one breaks
Multi-timeframe support - detect on H4, display on M15
Parallel t
FREE
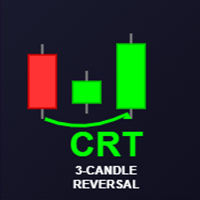
CRT Bomb Indicator - MT5 GBPUSD The CRT Bomb is a professional trading indicator that detects high-probability 3-candle reversal patterns (CRT - Candle Reversal Technique) across all timeframes and symbols. VPS is recomended so that you dont miss any CRT setups as they form , for entries you can use your manual analysis for confirmation like FVG, OBS etc Works on GBPUSD ONLY BUY THE FULL VERSION WORKING ON ANY INSTRUMENT HERE https://www.mql5.com/en/market/product/155393 Key Features: Identif
FREE

BUY INDICATOR AND GET EA FOR FREE AS A BONUS + SOME OTHER GIFTS! ITALO TREND INDICATOR is the best trend indicator on the market, the Indicator works on all time-frames and assets, indicator built after 7 years of experience on forex and many other markets. You know many trend indicators around the internet are not complete, does not help, and it's difficult to trade, but the Italo Trend Indicator is different , the Italo Trend Indicator shows the signal to buy or sell, to confirm the signal t

BUY INDICATOR AND GET EA FOR FREE AS A BONUS + SOME OTHER GIFTS! ITALO VOLUME INDICATOR is the best volume indicator ever created, and why is that? The Indicator works on all time-frames and assets, indicator built after 7 years of experience on forex and many other markets. You know many volume indicators around the internet are not complete, does not help, and it's difficult to trade, but the Italo Volume Indicator is different , the Italo Volume Indicator shows the wave volume, when market

A indicator for detecting FVGS
I hope this helps you scalp and generate money for yourself
NOTE BETTER:
Trading is risky and you can lose all your funds , use the money you are willing to lose
NOTE BETTER:
Trading is risky and you can lose all your funds , use the money you are willing to lose
NOTE BETTER:
Trading is risky and you can lose all your funds , use the money you are willing to lose
FREE
Introdução O Precision Spike Detector V2 é um indicador avançado para MetaTrader 5 (MT5) projetado para identificar potenciais picos de preço (movimentos bruscos de mercado) em índices sintéticos (DERIV: Boom, Crash; WELTRADE: GainX e PainX).
Ele combina análises de RSI (Índice de Força Relativa) e ATR (Amplitude Média Real) para fornecer sinais precisos e confiáveis. Funciona apenas no período M5 (5 minutos) . Em outros períodos, nenhuma seta será exibida. Principais características Filtro ba

Tool that allows viewing candles in multiple timeframes. This way, it helps the analysis in multiple timeframes.
This is another product developed by Renato Fiche Junior and available to all MetaTrader 5 users!
Input Parameters
- Option 1 - TimeFrame: Standard MT5 timeframe - Option 2 - Custom TimeFrame (in minutes): Or, if this value is different from zero, the timeframe will be customized. This allows you to choose timeframe other than the MT5 standard. - Total Candles: Number of candles. -
FREE
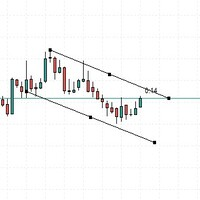
This indicator serves to give sound alerts when the price passes the manually placed line. A very useful tool, which allows you not to spend too much time sitting in front of the computer.
Note that the alert issued will always refer to the current candle, you can use multiple lines on the past chart to analyze.
This indicator will always receive better updates.
FREE
MetaTrader市场是 出售自动交易和技术指标的最好地方。
您只需要以一个有吸引力的设计和良好的描述为MetaTrader平台开发应用程序。我们将为您解释如何在市场发布您的产品将它提供给数以百万计的MetaTrader用户。
您错过了交易机会:
- 免费交易应用程序
- 8,000+信号可供复制
- 探索金融市场的经济新闻
注册
登录