Multi Timeframe Levels Pro

Türkçe (Turc)

Açıklama

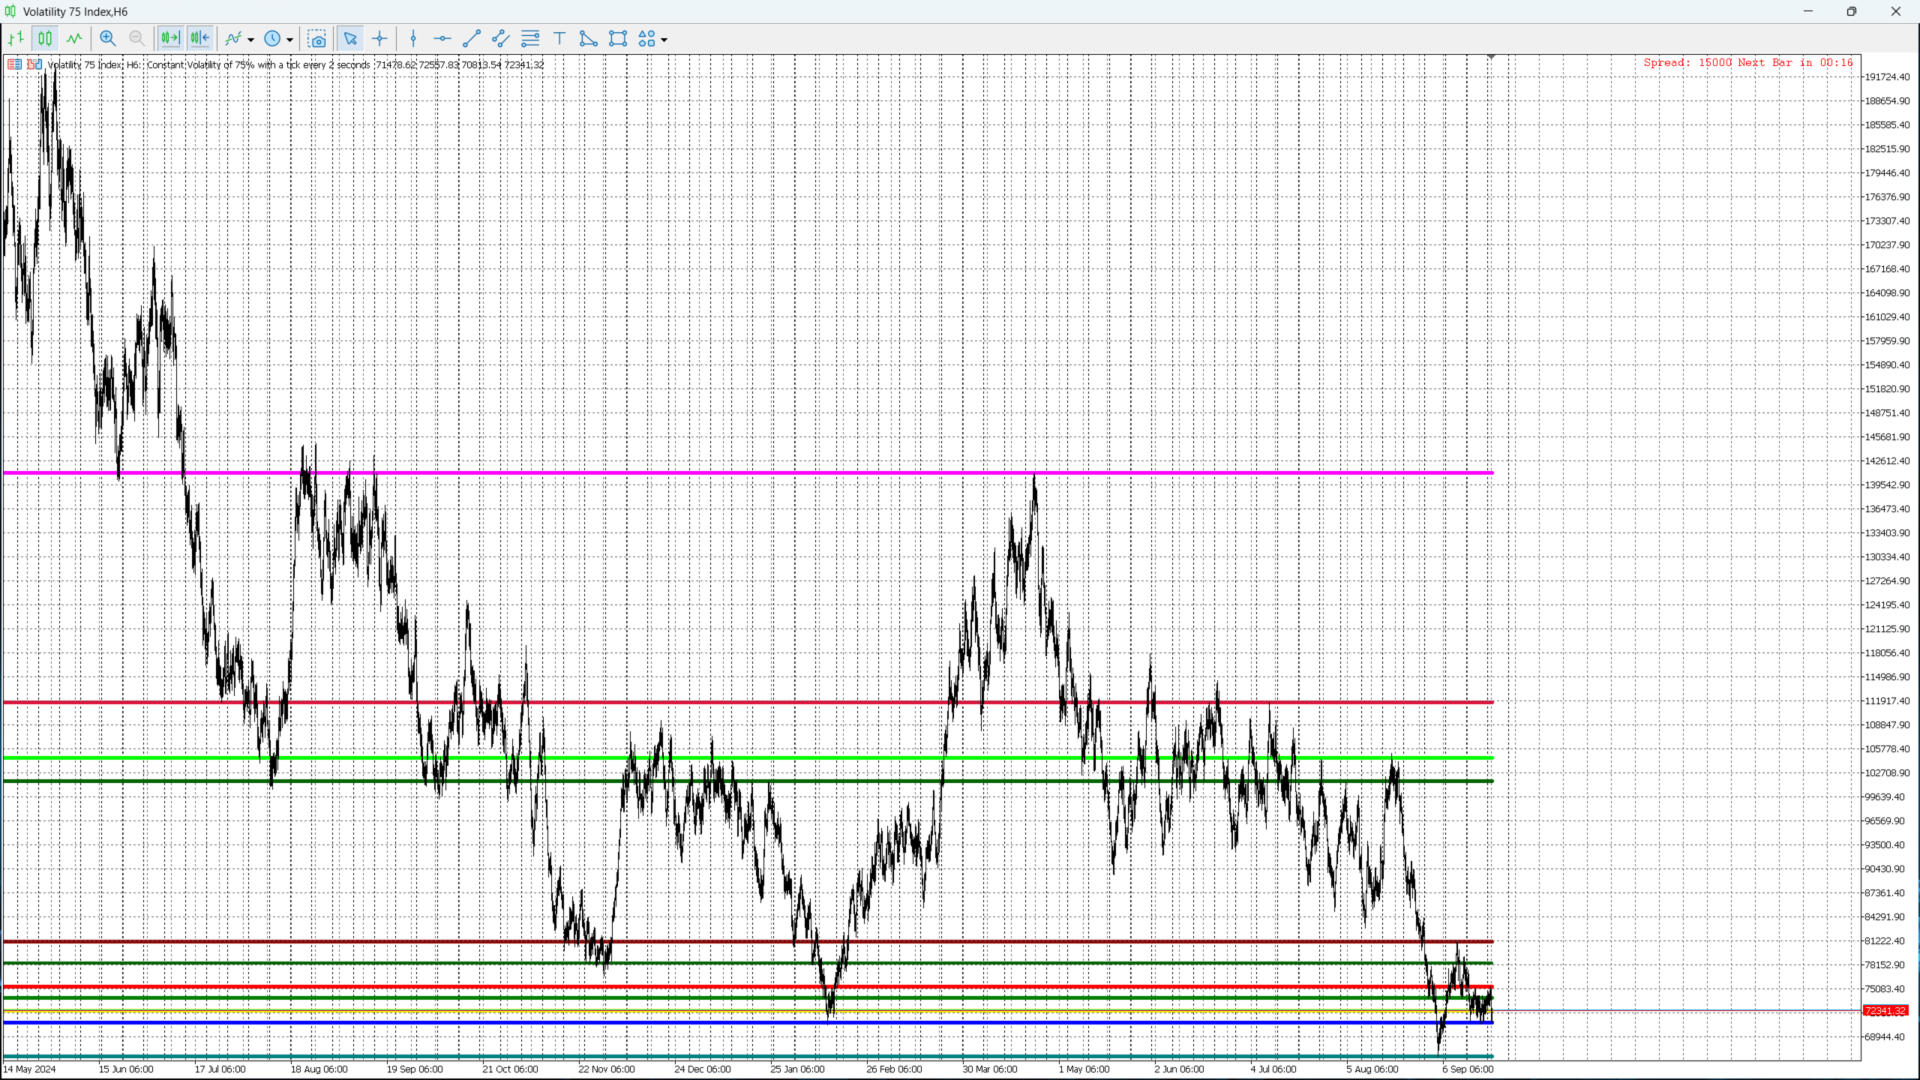
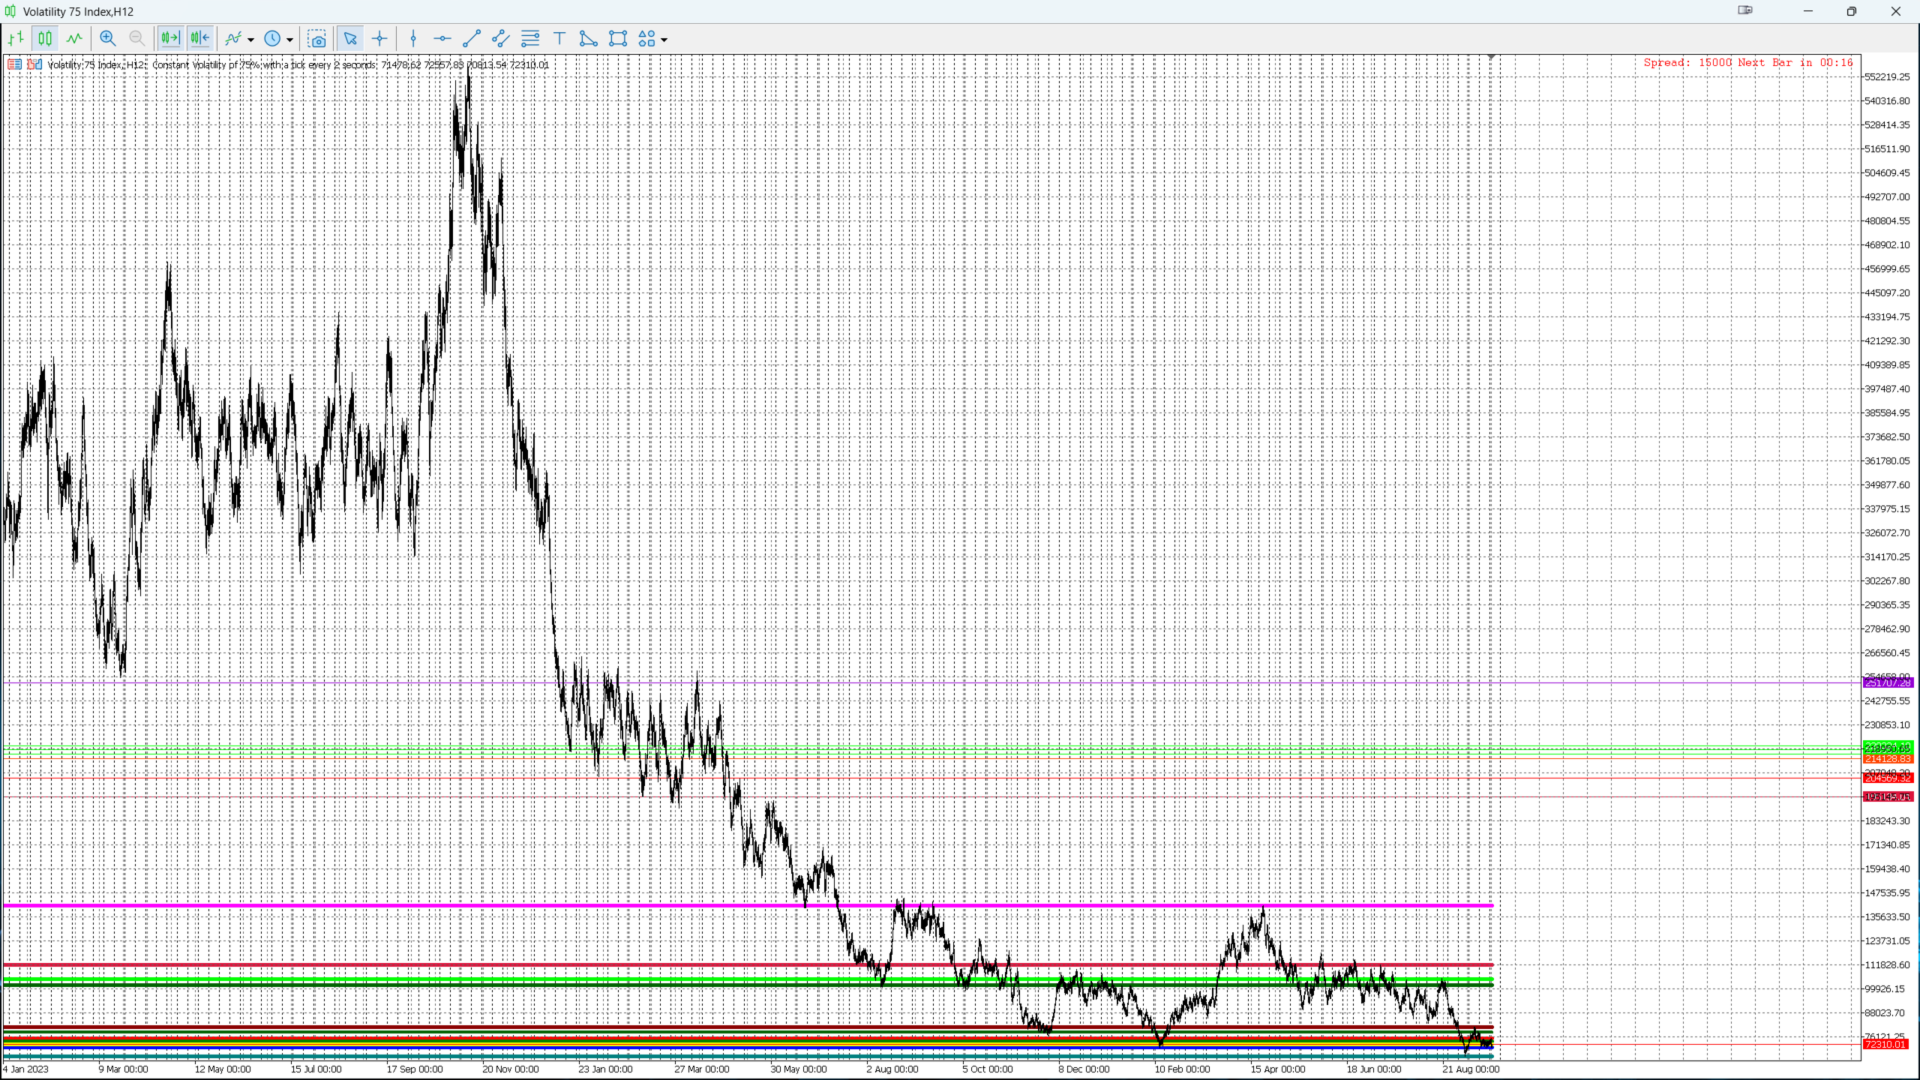
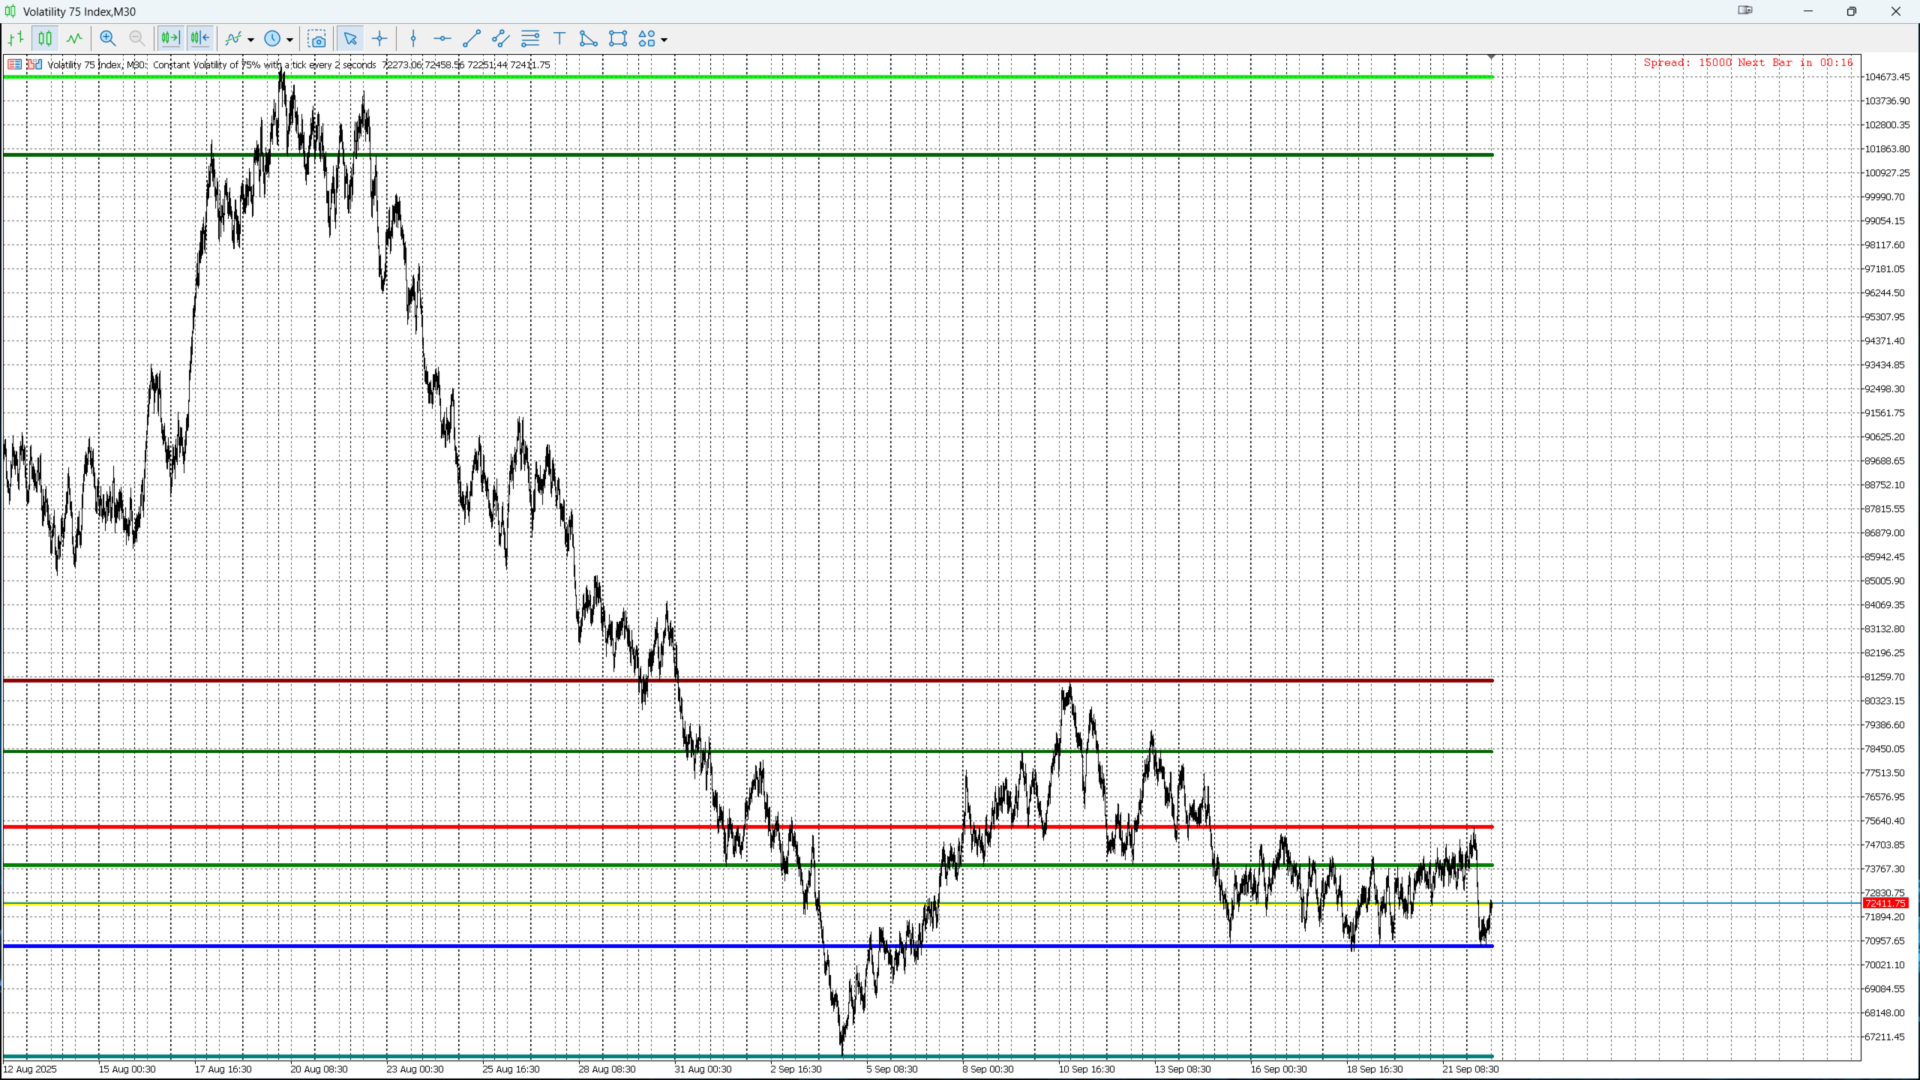
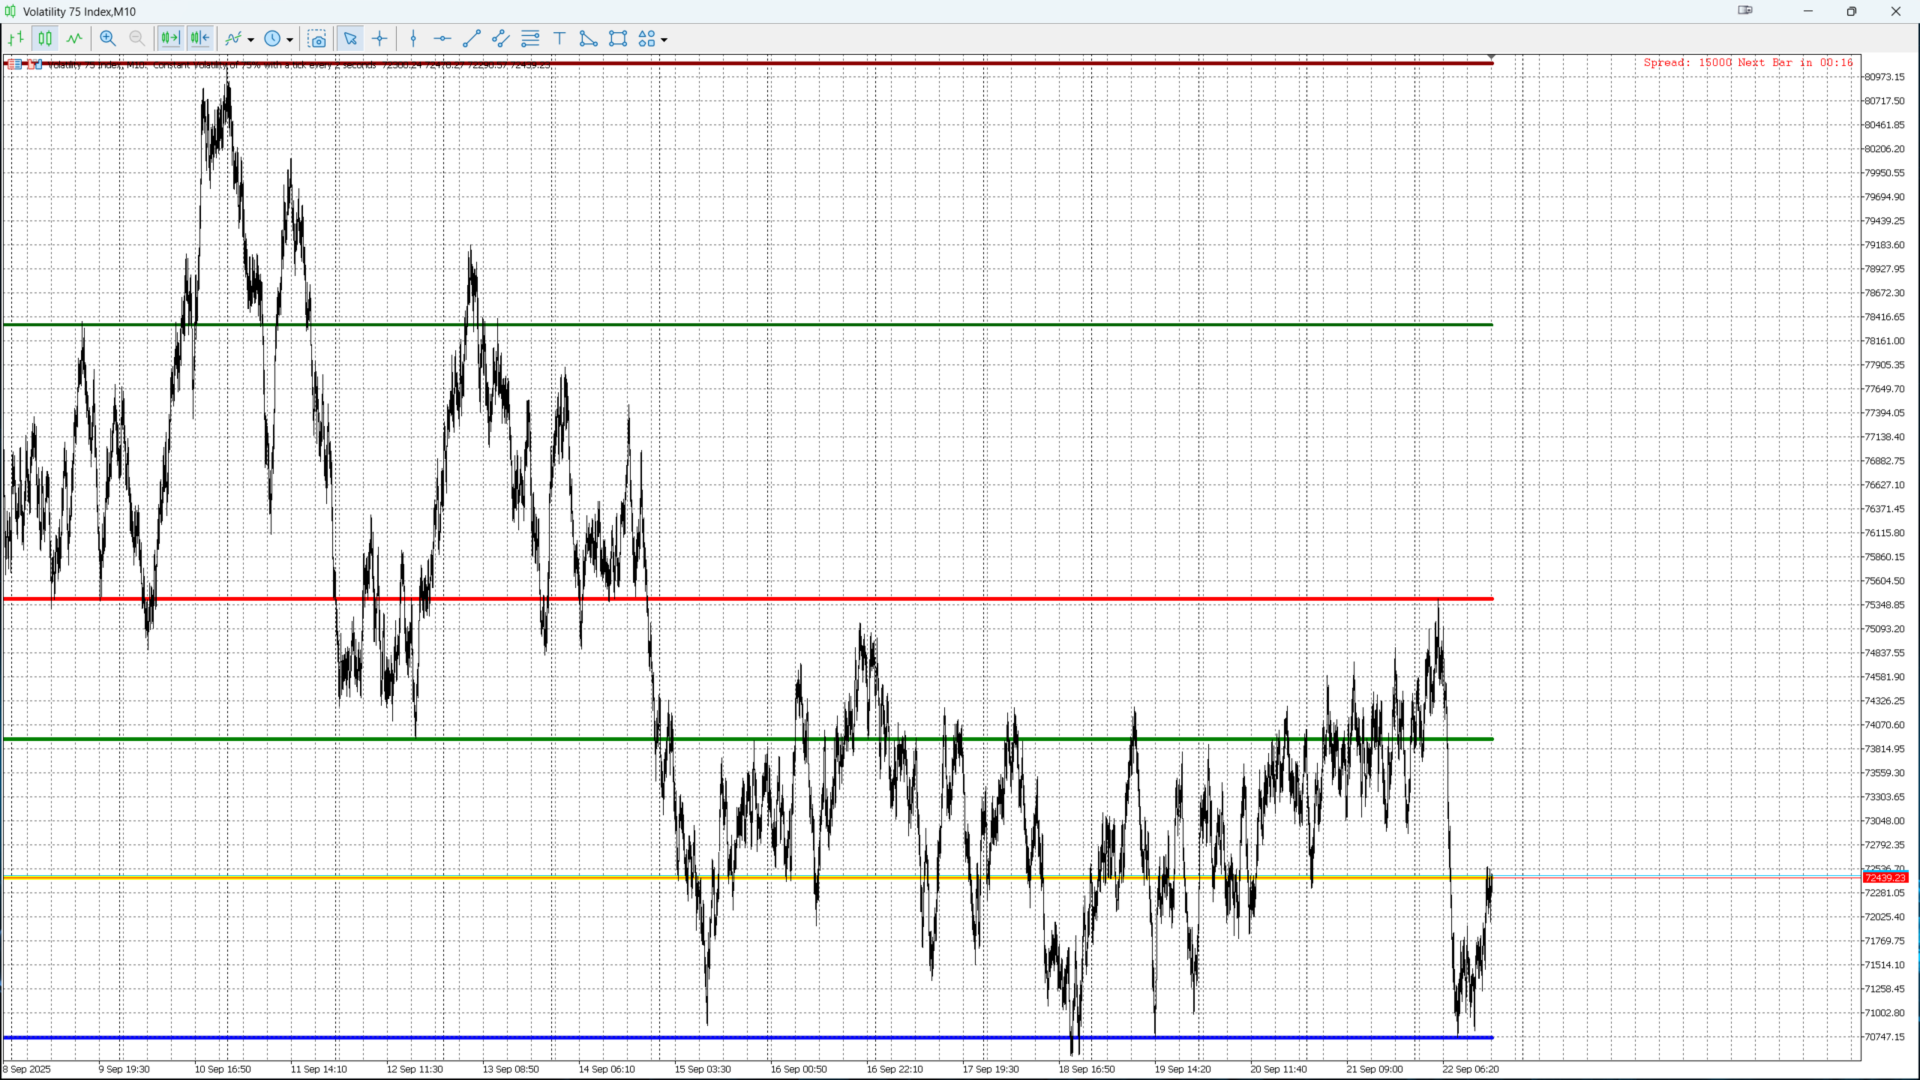
Multi-Timeframe Levels Pro v1.0 grafik üzerinde otomatik olarak Günlük, Aylık, Üç Aylık ve Yıllık seviyeleri (High, Low, Open, Close) çizer.
Destek, direnç ve breakout bölgelerini belirlemek için mükemmeldir.

Özellikler

  • Otomatik gösterim: Daily / Monthly / Quarterly / Yearly

  • High, Low, Open, Close için renkli çizgiler

  • Geçmiş dönemleri analiz etmek için Shift parametresi

  • Tüm piyasalarda çalışır: Forex, Endeksler, Emtialar, Hisseler, Kripto

  • Hafif ve hızlı – Price Action, Swing Trading, Scalping için ideal

Parametreler

  • DailyShift → Mevcut veya önceki gün

  • MonthlyShift → Mevcut veya önceki ay

  • QuarterlyShift → Mevcut veya önceki çeyrek

  • YearlyShift → Mevcut veya önceki yıl

Kullanım önerisi

Yıllık/çeyreklik seviyeleri büyük bölgeler için, günlük/aylık seviyeleri intraday işlemler için kullanın.


Önerilen ürünler
Delta Profile Volume
Teresinha Moraes Correia
Technical Description of the Indicator – Delta Profile for MetaTrader 5 The Delta Profile is an indicator developed for MetaTrader 5 focused on detailed analysis of volume flow within a defined range of candles. It organizes and displays information about the imbalance of positive volumes (associated with upward movements) and negative volumes (associated with downward movements) at different price levels. The result is a clear view of the chart points where the highest concentration of trades o
Trade smarter, not harder: Empower your trading with Harmonacci Patterns This is arguably the most complete harmonic price formation auto-recognition indicator you can find for the MetaTrader Platform. It detects 19 different patterns, takes fibonacci projections as seriously as you do, displays the Potential Reversal Zone (PRZ) and finds suitable stop-loss and take-profit levels. [ Installation Guide | Update Guide | Troubleshooting | FAQ | All Products ] It detects 19 different harmonic pri
Volume Profile V6
Andrey Kolesnik
4.67 (3)
The volume profile indicator of the market + a smart oscillator. It works on almost all instruments-currency pairs, stocks, futures, cryptocurrency, on real volumes and on tick ones. You can set both the automatic definition of the profile range, for example, for a week or a month, etc., and set the range manually by moving the boundaries (two vertical lines red and blue). It is shown as a histogram. The width of the histogram at this level means, conditionally, the number of transactions condu
L'indicatore SMC Venom Model BPR è uno strumento professionale per i trader che operano nell'ambito del concetto di Smart Money (SMC). Identifica automaticamente due modelli chiave sul grafico dei prezzi: FVG   (Fair Value Gap) è una combinazione di tre candele, in cui c'è un gap tra la prima e la terza candela. Forma una zona tra livelli in cui non c'è supporto di volume, il che spesso porta a una correzione dei prezzi. BPR   (Balanced Price Range) è una combinazione di due modelli FVG che for
Was: $249  Now: $99   Market Profile defines a number of day types that can help the trader to determine market behaviour. A key feature is the Value Area, representing the range of price action where 70% of trading took place. Understanding the Value Area can give traders valuable insight into market direction and establish the higher odds trade. It is an excellent addition to any system you may be using. Inspired by Jim Dalton’s book “Mind Over Markets”, this indicator is designed to suit the
ProEngulfing'in ücretsiz versiyonu, QualifiedEngulfing, günde bir sinyal sınırlaması ve daha az özellik sunmaktadır. Koala Trading Solution kanalına MQL5 topluluğunda katılmak için, tüm Koala ürünleri hakkında en son haberleri öğrenmek için aşağıdaki bağlantıyı kullanın: https ://www .mql5 .com /en /channels /koalatradingsolution Bu ürünün MT4 versiyonu aşağıdaki bağlantıdan indirilebilir: https ://www .mql5 .com /en /market /product /52023 ProEngulfing Tanıtımı – MT4 için Profesyonel Engulfing
Noize Absorption Index - is the manual trading system that measures the difference of pressure between bears forces and bulls forces. Green line - is a noize free index that showing curent situation. Zero value of index shows totally choppy/flat market.Values above zero level shows how powerfull bullish wave is and values below zero measures bearish forces.Up arrow appears on bearish market when it's ready to reverse, dn arrow appears on weak bullish market, as a result of reverse expectation.
Öncelikle, bu Ticaret Aracının Non-Repainting, Non-Redrawing ve Non-Lagging Gösterge olduğunu vurgulamakta fayda var, bu da onu profesyonel ticaret için ideal hale getiriyor. Çevrimiçi kurs, kullanıcı kılavuzu ve demo. Akıllı Fiyat Hareketi Kavramları Göstergesi, hem yeni hem de deneyimli tüccarlar için çok güçlü bir araçtır. İleri ticaret fikirlerini, Inner Circle Trader Analizi ve Smart Money Concepts Ticaret Stratejileri gibi 20'den fazla kullanışlı göstergeyi bir araya getirerek bir araya
Mine Farm is one of the most classic and time-tested scalping strategies based on the breakdown of strong price levels. Mine Farm is the author's modification of the system for determining entry and exit points into the market... Mine Farm - is the combination of great potential with reliability and safety. Why Mine Farm?! - each order has a short dynamic Stop Loss - the advisor does not use any risky methods (averaging, martingale, grid, locking, etc.) - the advisor tries to get the most
Moving Average Surfer – MT5 için Hassas Trend Yakalama EA’sı Moving Average Surfer, yüksek doğruluk, verimlilik ve otomatik risk yönetimi isteyen traderlar için geliştirilmiştir. Öne çıkan özellikler: Çift hareketli ortalama analizi Entegre RSI filtresi Dinamik risk yönetimi Esnek işlem yönü kontrolü ATR tabanlı SL/TP Her zaman diliminde çalışma Benzersiz Magic Number Trend tespiti, momentum doğrulaması ve akıllı risk yönetimini birleştiren tam otomatik, disiplinli bir çözüm sunar.
Overview Mirror Signals Service EA (Text only)   is a powerful monitoring Expert Advisor that automatically sends   real-time Telegram notifications   for all important trade events on your MetaTrader 5 account. It is engineered specifically for   signal providers ,   trade-copier operators ,   auditors ,   educators , and   professional trading services   that require immediate, detailed, and reliable reporting. Everything from   entries, exits, SL/TP changes, comment changes, trailing sto
Premium seviye, %80'den fazla doğru tahmin doğruluğuna sahip benzersiz bir göstergedir! Bu gösterge en iyi Ticaret Uzmanları tarafından iki aydan uzun süredir test edilmiştir! Yazarın göstergesini başka hiçbir yerde bulamazsınız! Ekran görüntülerinden bu aracın doğruluğunu kendiniz görebilirsiniz! 1, sona erme süresi 1 mum olan ikili opsiyon ticareti için harikadır. 2 tüm döviz çiftleri, hisse senetleri, emtialar, kripto para birimleri üzerinde çalışır Talimatlar: Kırmızı ok göründüğü an
Your Trend Friend
Luigi Nunes Labigalini
5 (1)
The trend is your friend! Look at the color of the indicator and trade on that direction. It does not  repaint. After each candle is closed, that's the color of the trend. You can focus on shorter faster trends or major trends, just test what's most suitable for the symbol and timeframe you trade. Simply change the "Length" parameter and the indicator will automatically adapt. You can also change the color, thickness and style of the lines. Download and give it a try! There are big movements w
Advanced Volume Profile Analysis Tool for MetaTrader 5 The Kecia Volume Profile Order Finder provides traders with volume profile analysis capabilities. This MT5 indicator combines volume profile visualization with statistical calculations to help identify potential trading opportunities and suggests entry, stop loss, and take profit levels based on market structure. Market Profile Visualization Transform your chart with customizable volume profile visualizations: Multiple visualization options
Pro Footprint & TPO - Order Flow for Standard Brokers (No DOM Required)。 Also engineered for brokers that DO NOT provide Market Depth (Level 2/DOM) data. Using a proprietary high-precision Tick reconstruction algorithm, this indicator simulates institutional Order Flow directly from standard price feeds. It allows you to visualize aggressive buying and selling pressure on any standard MT5 account (Forex, CFD, Crypto), bridging the gap between retail and professional trading. Footprint Visualizat
Gösterge, tarihsel olanlarla karşılaştırılabilecek güncel teklifler oluşturur ve bu temelde bir fiyat hareketi tahmini yapar. Gösterge, istenen tarihe hızlı navigasyon için bir metin alanına sahiptir. Seçenekler: Sembol - göstergenin göstereceği sembolün seçimi; SymbolPeriod - göstergenin veri alacağı dönemin seçimi; GöstergeRenk - gösterge rengi; Ters - doğru tırnakları tersine çevirir, yanlış - orijinal görünüm; Sonraki, tarihi girebileceğiniz ve 'enter' tuşuna basarak hemen atlayab
##   ONLY GOLD ##   Тiльки Золото ## **Mercaria Professional Trading Zones - Complete Guide** ## **Mercaria Professional Trading Zones - Повний посібник** ### **How Mercaria Zones Work / Як працюють зони Mercaria** **English:** Mercaria Zones is an advanced trading indicator that identifies high-probability support and resistance areas using ZigZag extremes combined with mathematical zone calculations. The indicator works on multiple timeframes simultaneously, providing a comprehensive view
Overview Harmonic Patterns MT5 is a technical analysis indicator designed for the MetaTrader 5 platform. It identifies and displays harmonic price patterns, such as Butterfly, Cypher, Crab, Bat, Shark, and Gartley, in both bullish and bearish directions. The indicator calculates key price levels, including entry, stop loss, and three take-profit levels, to assist traders in analyzing market movements. Visual elements and customizable alerts enhance usability on the chart. Features Detects six ha
WAPV Weis Wave Chart Forex
Eduardo Da Costa Custodio Santos
MT5 için Weis Wave Chart Forex bir Fiyat ve Hacim göstergesidir. Fiyat ve Hacim okuması, Richard Demille Wyckoff tarafından oluşturulan üç yasaya dayalı olarak geniş çapta dağıtıldı: Arz ve Talep, Neden ve Etki ve Çabaya Karşı Sonuç. 1900'de R.Wyckoff, analizlerinde dalga grafiğini zaten kullanmıştı. Yıllar sonra, 1990 civarında, David Weis Otomatikleştirilmiş R. Wyckoff'un dalga grafiği ve bugün size David Weis'in dalga grafiğinin evrimini sunuyoruz. Varlıkta üretilen dalga ile ilgili Hacim mik
KT Double Top Bottom MT5
KEENBASE SOFTWARE SOLUTIONS
1 (1)
The double top bottom pattern is arguably one of the technical analysis's most popular chart patterns. These patterns are used to capitalize on recurring patterns and identify trend reversal patterns, thereby creating well-placed entry and exit levels. The KT Double Top Bottom is based on these patterns and fine-tunes the trade signal development process for traders. Features It's based on one of the most reliable trading patterns and brings some fine-tuning and automation to the process. Also
Order Book, known also as Market Book, market depth, Level 2, - is a dynamically updated table with current volumes of orders to buy and to sell specific financial instument at price levels near Bid and Ask. MetaTrader 5 provides the means for receiving market book from your broker, but in real time only, without access to its history. The indicator OrderBook Cumulative Indicator accumulates market book data online and visualizes them on the chart. In addition, the indicator can show the market
Delta + CVD & CVD Candles Order-flow indicator combining Delta (Ask–Bid), Cumulative Volume Delta (CVD), and a unique CVD-based synthetic candle system. Shows buy/sell pressure, volume aggressiveness, and momentum shifts with optional Delta histogram, CVD line, and CVD+Delta combined candles. Useful for scalping, intraday trading, divergence detection, and understanding buyer/seller dominance. Overview The Delta + CVD & CVD Candles Indicator combines multiple order-flow tools into one clean
# DRAWDOWN INDICATOR V4.0 - The Essential Tool to Master Your Trading ## Transform Your Trading with a Complete Real-Time Performance Overview In the demanding world of Forex and CFD trading, **knowing your real-time performance** isn't a luxury—it's an **absolute necessity**. The **Drawdown Indicator V4.0** is much more than a simple indicator: it's your **professional dashboard** that gives you a clear, precise, and instant view of your trading account status. --- ## Why This Indicator
Visual CrossPulse Dynamics Indicator
AL MOOSAWI ABDULLAH JAFFER BAQER
Visual CrossPulse Dynamics: Trade with the Market's True Rhythm Unlock a new level of market insight with Visual CrossPulse Dynamics, a sophisticated trading indicator designed to adapt to ever-changing volatility and reveal the true direction of the trend. Are you tired of indicators that lag in fast-moving markets or give false signals during consolidation? The Visual CrossPulse Dynamics indicator solves this problem by using an advanced, adaptive algorithm that intelligently adjusts to the m
Golden Limit
Renato Fridschtein
There are no limits! Golden Limit is the ultimate indicator to get clear and easy readings of price movements on charts. It projects support and resistance ranges, calculated by statistical models involving Price Action and the Fibonacci sequence, revealing in advance the behavior of prices and the best places to trade and not to trade. It also has two moving averages to help choose the best entries. The Golden Limit method was created from a proven model. In summary: We use the names of precio
Check out my TRADE PLANNER MT5 – strongly recommended to anticipate account scenarios before risking any money. This is a multi-symbol, multi-timeframe, table-based indicator for MetaTrader 5 that identifies 46 types of candlestick formations. Each formation has its own image for easier recognition. The indicator includes popular patterns such as Engulfing, Hammer, Three Line Strike, Piercing, and Doji-like candles. You can check the full list of patterns in the screenshots below. Also you can
Owl Smart Levels MT5
Sergey Ermolov
4.03 (32)
MT4 versiyonu  |  FAQ Owl Smart Levels Indicator , Bill Williams'ın gelişmiş fraktalları , piyasanın doğru dalga yapısını oluşturan Valable ZigZag ve kesin giriş seviyelerini gösteren Fibonacci seviyeleri gibi popüler piyasa analiz araçlarını içeren tek gösterge içinde eksiksiz bir ticaret sistemidir. pazara ve kar elde edilecek yerlere. Stratejinin ayrıntılı açıklaması Gösterge ile çalışma talimatı Baykuş Yardımcısı ticaretinde Danışman Yardımcısı Kullanıcıların özel sohbeti -> Satın aldıktan
Introducing the Power Trade Plus indicator designed by a small group of traders with a few years of experience trading the market profitably.  The Power Trade Plus is derived from the Power Trade indicator,  the indicator strive in powerful sniper entries and take profit levels,  with an algorithm that's can determine the markets volatility and Provides entries based on the current market volatility. This indicator is much more effective in stock ,currencies and indices.
MercariaPattern1-2-3 відстежує рух ціни, знаходить трьоххвильові структури 1-2-3 та підсвічує момент, коли сценарій підтверджується пробоєм ключового рівня. MercariaPattern1-2-3 tracks price movement, detects three-leg 1-2-3 structures and highlights the moment when the scenario is confirmed by a key level breakout. Індикатор збирає локальні свінги в компактну фігуру 0–1–2–3 , чекає підтвердженого пробою та будує стрілку входу з готовими рівнями SL/TP. The indicator combines local swings into a
Key level wedge MT5
Presley Annais Tatenda Meck
The   Key level wedge MT5   indicator automatically draws rising wedge pattern and falling wedge pattern for you on the chart. This pattern is really good when used as a confirmation entry at key support & resistance, supply & demand and reversal zones. Advantages  The   Key level wedge MT5   block DOES NOT RE-PAINT, giving you confidence when a signal appears and also helps when looking back.  The   Key level wedge MT5   includes an on/off button on the chart to easily keep the charts clean
Bu ürünün alıcıları ayrıca şunları da satın alıyor
AriX
Temirlan Kdyrkhan
1 (4)
AriX Indicator for MT5 A powerful trend-following and signal-evaluation tool AriX is a custom MT5 indicator that combines Moving Averages and ATR-based risk/reward logic to generate clear buy/sell signals. It visualizes dynamic SL/TP levels, evaluates past trade outcomes, and displays win/loss statistics in a clean on-chart panel. Key features include: Buy/Sell signals based on MA crossovers ATR-based SL/TP1/TP2/TP3 levels with visual lines and labels Signal outcome tracking with real-time stat
ARICoins
Temirlan Kdyrkhan
ARICoin is a powerful trading companion designed to generate high-probability entry signals with dynamic TP/SL/DP levels based on volatility. Built-in performance tracking shows win/loss stats, PP1/PP2 hits, and success rates all updated live. Key Features: Buy/Sell signals with adaptive volatility bands Real-time TP/SL/DP levels based on ATR Built-in MA Filter with optional ATR/StdDev volatility Performance stats panel (Success, Profit/Loss, PP1/PP2) Alerts via popup, sound, push, or email Cust
TrendMaestro5
Stefano Frisetti
note: this indicator is for METATRADER4, if you want the version for METATRADER5 this is the link:  https://www.mql5.com/it/market/product/108106 TRENDMAESTRO ver 2.5 TRENDMAESTRO recognizes a new TREND from the start, he never makes mistakes. The certainty of identifying a new TREND is priceless. DESCRIPTION TRENDMAESTRO identifies a new TREND in the bud, this indicator examines the volatility, volumes and momentum to identify the moment in which there is an explosion of one or more of these da
ÜCRETSİZ AUX Göstergesi ve EA Desteğini Alın  Doğrudan indirme — Buraya tıklayın [ D.I.C.E ] The DICE Indicator  Divergence in Chaos Environment, Elliott Dalga Teorisi’ni Trading Chaos teknikleriyle birleştiren trader’lar için geliştirilmiş özel bir MT5 aracıdır. Bill Williams’ın tanımladığı kaotik piyasa ortamıyla senkronize olarak fiyat hareketlerindeki gizli ve normal uyumsuzlukları tespit eder. Ana Özellikler Elliott Dalgası Uyumlu Uyumsuzluk: Dalga yapılarıyla uyumlu boğa ve ayı uyumsuzluk
Pantera Indicator
Temirlan Kdyrkhan
5 (1)
A tool for on-chart strategy backtesting and performance analysis. A utility for developing, debugging, and testing custom trading ideas and indicator functions. An indicator designed to quickly test trading concepts and visualize the effectiveness of different input parameters. An all-in-one sandbox for testing everything from simple crossovers to complex, multi-condition trading systems.
Hello I Want to introduce The Forex Buy Sell Arrow Premium MT5 i recently release this premium indicator! its 1000% Non Repaint Indicator, It Work Perfectly Well,, i tested it day by day, Just mind blowing Result,  Including Powerful trend Algorithm! How It Work? well, it work market trend formula, when trend Bullish Or when trend Bearish,  Recommend Timeframe M30, H1 it work all timeframe, and all currency pair, 100% non repaint, How to take signal From Forex Buy Sell Arrow Premium Ind
Enigma 112
issam rahhal sabour
Enigma 112 Indicator - User Manual Enigma 112 Indicator Complete User Manual - Ultimate Trading Solution Introduction The Enigma 112 is a comprehensive multi-timeframe trading indicator that combines advanced technical analysis concepts including Tesla 3-6-9 Gates, Huddleston Theory, PO3 Dealing Ranges, and sophisticated risk management systems. Tesla 3-6-9 Gates Based on Nikola Tesla's vortex mathematics for precise support and resistance levels Huddleston Theory Volume-based market
VTrende Pro
Andrii Diachenko
5 (1)
VTrende Pro - MTF indicator for trend trading with a display panel for MT5 *** Videos can be translated into any language using subtitles (video language - Russian) Although the signals of the VTrende Pro indicator can be used as signals of a full-fledged trading system, it is recommended to use them in conjunction with the Bill Williams TS. VTrende Pro is an extended version of the VTrende indicator. Difference between Pro version and VTrende: - Time zones - Signal V - signal 1-2 waves -    S
The Second-Level Tick Candlestick Generator is a professional-grade MT5 indicator tool specifically designed for high-frequency trading and short-term scalping. It can convert raw tick data into highly customizable second-level candlestick charts in real-time, helping traders accurately capture micro-market fluctuations and optimize entry and exit timing. This tool provides clear chart displays, allowing you to more intuitively identify price action patterns and improve trading decision efficien
The Expert Advisor and the video are attached in the Discussion tab . The robot applies only one order and strictly follows the signals to evaluate the indicator efficiency. Pan PrizMA CD Phase is an option based on the Pan PrizMA indicator. Details (in Russian). Averaging by a quadric-quartic polynomial increases the smoothness of lines, adds momentum and rhythm. Extrapolation by the sinusoid function near a constant allows adjusting the delay or lead of signals. The value of the phase - wave s
Классификатор силы тренда. Показания на истории не меняет. Изменяется классификация только незакрытого бара. По идее подобен полной системе ASCTrend, сигнальный модуль которой, точнее его аппроксимация в несколько "урезанном" виде, есть в свободном доступе, а также в терминале как сигнальный индикатор SilverTrend . Точной копией системы ASCTrend не является. Работает на всех инструментах и всех временных диапазонах. Индикатор использует несколько некоррелируемых между собой алгоритмов для класси
FFx Universal Strength Meter PRO is more than a basic strength meter. Instead of limiting the calculation to price, it can be based on any of the 19 integrated strength modes + 9 timeframes. With the FFx USM, you are able to define any period for any combination of timeframes. For example, you can set the dashboard for the last 10 candles for M15-H1-H4… Full flexibility! Very easy to interpret... It gives a great idea about which currency is weak and which is strong, so you can find the best pai
The FFx Universal MTF alerter shows on a single chart all the timeframes (M1 to Monthly) with their own status for the chosen indicator. 9 indicators mode (MACD-RSI-Stochastic-MA-ADX-Ichimoku-Candles-CCI-PSAR). Each can be applied multiple times on the same chart with different settings. Very easy to interpret. Confirm your BUY entries when most of the timeframes are showing green color. And confirm your SELL entries when most of the timeframes are showing red color. 2 Alert Options : input to s
The FFx Watcher PRO is a dashboard displaying on a single chart the current direction of up to 15 standard indicators and up to 21 timeframes. It has 2 different modes: Watcher mode: Multi Indicators User is able to select up to 15 indicators to be displayed User is able to select up to 21 timeframes to be displayed Watcher mode: Multi Pairs User is able to select any number of pairs/symbols User is able to select up to 21 timeframes to be displayed This mode uses one of the standard indicators
FFx Patterns Alerter gives trade suggestions with Entry, Target 1, Target 2 and StopLoss .... for any of the selected patterns (PinBar, Engulfing, InsideBar, OutsideBar) Below are the different options available: Multiple instances can be applied on the same chart to monitor different patterns Entry suggestion - pips to be added over the break for the entry 3 different options to calculate the SL - by pips, by ATR multiplier or at the pattern High/Low 3 different options to calculate the 2 TPs -
MetaTrader 4 version available here : https://www.mql5.com/en/market/product/24881 FFx Basket Scanner is a global tool scanning all pairs and all timeframes over up to five indicators among the 16 available. You will clearly see which currencies to avoid trading and which ones to focus on. Once a currency goes into an extreme zone (e.g. 20/80%), you can trade the whole basket with great confidence. Another way to use it is to look at two currencies (weak vs strong) to find the best single pairs
MetaTrader 4 version available here: https://www.mql5.com/en/market/product/25793 FFx Pivot SR Suite PRO is a complete suite for support and resistance levels. Support and Resistance are the most used levels in all kinds of trading. Can be used to find reversal trend, to set targets and stop, etc. The indicator is fully flexible directly from the chart 4 periods to choose for the calculation: 4Hours, Daily, Weekly and Monthly 4 formulas to choose for the calculation: Classic, Camarilla, Fibonac
Pendiente de Precio
Cesar Juan Flores Navarro
Indicador en base a la pendiente de la linea de precio, dibuja una línea de color cuando sube a base de los precios que previamente has sido procesados o linealizados, y cuando baja la pendiente la linea linealizada toma otro color. En este caso se a considerado 6 lineas de diferentes procesos desde pendientes largas hacia las cortas, observándose que cuando coincidan las pendientes se produce un máximo o mínimo, lo que a simple vista nos permitirá hacer una COMPRA O VENTA.
WanaScalper
Isaac Wanasolo
1 (1)
A scalping indicator based on mathematical patterns, which on average gives signals with relatively small SL, and also occasionally helps to catch big moves in the markets (more information in the video) This indicator has three main types of notifications: The first type warns of a possible/upcoming signal on the next bar The second type indicates the presence of a ready signal to enter the market/open a position The third type is for SL and TP levels - you will be notified every time price re
Индикатор Coefficient Of Determination (COD) представляет собой значение коэффициента детерминации или квадрат коэффициента корреляции между зависимой переменной — ценой и объясняющей переменной — тиковым объемом. Что это дает нам на практике? COD отлично распознает кульминацию трендовых движений, что позволяет подбирать оптимальные точки и ловить развороты рынка. Как использовать индикатор: Наиболее популярная торговая стратегия строится совместно с трендовым индикатором Moving Average (MA), пе
Fibonacci Multiple 12
Cesar Juan Flores Navarro
Fibonacci Múltiple 12, utiliza la serie fibonacci plasmado en el indicador fibonacci, aumentadolo 12 veces según su secuencia. El indicador fibonacci normalmente muestra una vez, el presente indicador se mostrara 12 veces empezando el numero que le indique siguiendo la secuencia. Se puede utilizar para ver la tendencia en periodos cortos y largos, de minutos a meses, solo aumentado el numero MULTIPLICA.
Recommended TimeFrame >= H1. 100% Non Repainted at any moment.  Use it carefully, only with Trend Direction. Trading Usage: 2 Variants: as Range System or as BreakOut System (Both Only With Trend Direction)::: (Always use StopLoss for minimise Risk); [1] as Range System: (Recommended) in UP TREND:  - BUY in Blue Line , then if price goes down by 50 points (on H1) open Second BUY.   Close in any Profit you wish: TrailingStop(45 points) or Close when Price touches upper Gold Line. in DOWN TREND
En base a cálculos matemáticos de determino una linea Horizontal que cruza a todas las señales de trading, mostrando los máximos y mínimos. La linea horizontal parte en dos las subidas y bajadas de las señales de trading, de tan manera que es fácil identificar los máximos y mínimos, y es inteligente por que es sensible a las subidas y bajadas, afín de no quedarse en un solo lado por siempre, trabaja excelentemente con otros indicadores suavizadores ya que les garantiza que en un intervalo de tie
Spike Detector
Tete Adate Adjete
this indicator is a Spike detector indicator, it is specially designed to trade Boom 1000, Boom 500, Crash 1000 and Crash 500 We recommend using it on Deriv Boom and Crash indices only Its setting is intuitive, familiar, easy to use it has notification functions; audible notifications and push notifications. this tool is simple to use, easy to handle This update is based on different strategies for spikes
The indicator tracks the trend in 5 different chart times for the same asset, based on 6 signals for each chart time. The main objective of the indicator is to show us the majority trend of the financial asset in which it was placed. The system transmits the information of the trends in several graphical times, in this way the user is able to have a wide view of the movement of the asset, this type of tool makes the user have a higher hit rate by helping the operator to execute orders in favo
Limitless MT5
Dmitriy Kashevich
Limitless MT5 is a universal indicator suitable for every beginner and experienced trader. works on all currency pairs, cryptocurrencies, raw stocks Limitless MT5 - already configured and does not require additional configuration And now the main thing Why Limitless MT5? 1 complete lack of redrawing 2 two years of testing by the best specialists in trading 3 the accuracy of correct signals exceeds 80% 4 performed well in trading during news releases Trading rules 1 buy signal - the ap
trend view panel; AutoSignals Trend The indicator tracks the trend in 5 different chart times for the same asset, based on 6 signals for each chart time. The main objective of the indicator is to show us the majority trend of the financial asset in which it was placed. The system transmits the information of the trends in different graphic times, in this way the user is able to have a wide view of the movement of the asset, this type of tool makes the user have a higher hit rate by helping
Escalera Inteligente
Cesar Juan Flores Navarro
Indicador en MQL5, recibe la información del precio SUAVIZADO, lo procesa anulando los picos inteligentemente, y el resultado lo envía al desarrollo de la escalera que iniciara y subirá o bajara según el peldaño o INTERVALO ingresado Ingreso PERIODO = 50 (variar segun uso) Ingreso MULTIPLICA AL PERIODO = 1 (variar segun uso) Segun la configuración la escalera puede pegarse o separarse de los precios,, Se aplica toda la linea de tiempo, y a todas las divisas, etc.  
Fibonacci Suavizado
Cesar Juan Flores Navarro
Indicador en MQL5, que obtiene el promedio de 10 EMAS, que son alineadas según Fibonacci, obteniendo un promedio, que sera suavizado.  Se puede ingresar un numero desde 2 a N, que multiplica a los EMA-Fibonacci. Funciona en cualquier criptomoneda, etc. etc... pudiendo calcular el futuro segun la tendencia de las EMAS. Funciona excelentemente en tramos largos, determinando exactamente el mejor inicio/salida. El precio inicial por apertura sera por un periodo de tiempo, luego aumentará.
QuantXSTocks Trading Range Indicator for MT5: INSTRUCTIONS TO USE OUR INDICATOR:- User needs to take trade on Arrow or after an Arrow CandleStick, You can achieve up-to 35-125 pips target by this Indicator. Best Timeframes for Stocks and Indices are M30 and H1: AMAZON M30 (50 pips) TESLA M30 (50 pips) APPLE M30 (50 pips) ADOBE M30 (50 pips) NASDAQ100 H1 (125 pips) The above are the approximate amount of pips you can achieve by this Indicator, Green arrow appears to be buy arrow while the Red ar
Yazarın diğer ürünleri
Canal H Pro
N'da Lemissa Kouame
Türkçe – Canal H Pro Adı: Canal H Pro – Destek, Direnç ve Breakout Kısa Açıklama: Premium gösterge, üç dinamik çizgi (yüksek, düşük, orta) ve kırılmalarda otomatik BUY/SELL okları ile. Breakout, Range ve trend takip stratejileri için ideal. Ayrıntılı Açıklama: Kırmızı (Yüksek) → dinamik direnç Mavi (Düşük) → dinamik destek Sarı (Orta) → denge ve trend filtresi Grafik üzerinde otomatik BUY/SELL sinyalleri Periyot ve renkler özelleştirilebilir Tüm stratejiler ve zaman dilimleri ile uyumlu Cana
NuageTrend Pro
N'da Lemissa Kouame
Nuage Trend Pro – Trend Takibi & Kijun Sinyalleri Nuage Trend Pro , MetaTrader 5 için geliştirilmiş ileri düzey bir göstergedir. Güçlü piyasa trendlerini hızlıca tespit eder ve Kijun kesişimleri ile optimal giriş noktalarını belirler. Grafiklerinizi net ve görsel olarak anlaşılır haritalara dönüştürerek, doğru ve güvenli işlem yapmanızı sağlar. Temel Özellikler Otomatik Kijun kesişim algılama : fiyatın temel çizgiyi geçtiği kritik anları anında gösterir. Dinamik trend bulutu : piyasa yönün
Weekly Levels Pro
N'da Lemissa Kouame
Türkçe (Turc) – Weekly Levels Pro Weekly Levels Pro – Haftalık Ana Seviyeler MetaTrader 5 için basit ama güçlü bir göstergedir ve her haftanın en önemli dört işlem seviyesini otomatik olarak gösterir: Haftalık Zirve (Weekly High) → doğal direnç seviyesi Haftalık Dip (Weekly Low) → doğal destek seviyesi Haftalık Açılış (Weekly Open) → trend referans noktası Haftalık Kapanış (Weekly Close) → boğa veya ayı gücünün göstergesi Ana Özellikler: Yeni haftanın başında otomatik güncelleme Grafik
Pin Bar Pro v1
N'da Lemissa Kouame
Pin Bar Pro v1.0 – MQL5 Göstergesi Açıklama: Pin Bar Pro, MetaTrader 5 için profesyonel bir göstergedir ve Pin Bar mumlarını otomatik olarak tespit eder, piyasadaki dönüşleri öngörmenize yardımcı olur. Mavi ok → Alış sinyali Kırmızı ok → Satış sinyali Özellikler: Pin Bar otomatik tespiti Özelleştirilebilir oklar ( Arrow_Up_Code , Arrow_Down_Code ) Dikey offset ayarı ( Arrow_Offset_Pts ) Tüm semboller ve zaman dilimlerinde çalışır Parametreler: Parametre Açıklama Varsayılan Arrow_Up_Code Alış ok
TÜRKÇE – Monthly Levels Pro v1.0 En İyi Aylık Piyasa Seviyeleri Göstergesi Önemli piyasa bölgelerini anında takip edin. Monthly Levels Pro , uzun vadeli trendleri analiz etmenize ve aylık mumun High, Low, Open ve Close seviyelerini otomatik göstererek kritik destek ve direnç noktalarını hızlıca görmenizi sağlar. Avantajlar: Anında analiz Akıllı trading Net görselleştirme Esnek kullanım Basit ve etkili Uyumluluk: MT5, tüm zaman dilimleri
Indicator Monthly Levels + Pin Bar Pro Description The Monthly Levels + Pin Bar Pro indicator combines the power of monthly key levels (High, Low, Open, Close) with automatic detection of Price Action reversal patterns (Pin Bars) . Designed for technical and institutional traders, it helps anticipate market reaction zones and generates clear visual signals directly on the chart. Main Features Automatic monthly levels : High, Low, Open, Close. Pin Bar detection (bullish & bearish) in r
Yearly Levels Pro
N'da Lemissa Kouame
10️⃣ Türkçe (Turkish) Sürüm: 1.0 Geliştirici: KOUAME N'DA LEMISSA Platform: MetaTrader 5 (MT5) Tür: Teknik Gösterge / Yıllık Fiyat Seviyeleri Açıklama: Yearly Levels Pro v1.0, KOUAME N'DA LEMISSA tarafından geliştirilmiş güçlü bir göstergedir. Belirli bir yılın Açılış, Yüksek, Düşük ve Kapanış fiyatlarını otomatik olarak hesaplar ve bunları grafik üzerinde renkli yatay çizgilerle gösterir. Özellikler: High (Kırmızı), Low (Mavi), Open (Yeşil), Close (Turuncu) Year_Shift ile yıl seçimi Tüm enstrü
Turkish Version (Türkiye) Quarterly Levels Pro v1.0 – Ticari Bildirim Ürün Adı: Quarterly Levels Pro v1.0 Geliştirici: KOUAME N'DA LEMISSA Versiyon: 1.0 Açıklama: Quarterly Levels Pro , KOUAME N'DA LEMISSA tarafından geliştirilmiş profesyonel bir MetaTrader 5 göstergesidir ve otomatik olarak bir çeyrek dönemin High, Low, Open ve Close seviyelerini gösterir. Bu, trader’ların grafikte kritik destek ve direnç bölgelerini net bir şekilde görselleştirmelerini sağlar ve orta vadeli işlem kararları
Marubozu Pro MT5
N'da Lemissa Kouame
Commercial Description – Marubozu Pro (MT5) Description Marubozu Pro is a professional indicator for MetaTrader 5 that automatically detects Marubozu candles (bullish and bearish) directly on your chart. It helps traders identify strong market momentum where buyers or sellers take full control, by displaying clear visual arrows for buy and sell signals. This tool is designed to be simple, effective, and fast , perfect for manual trading or as a filter in automated strategies. Key Features
ETE Detector – Head & Shoulders Indicator Turn your charts into clear and actionable trading opportunities! About the Indicator The ETE Detector automatically identifies Head & Shoulders (H&S) and Inverse Head & Shoulders (IH&S) patterns — classic trend reversal formations. No more spending hours searching manually: your analysis becomes fast, accurate, and visual . What You Get Automatic detection of trend reversal patterns Colored arrows : green for buys (Inverse H&S), red for sell
Fusion Monthly Levels + PinBar + Marubozu Açıklama Bu benzersiz gösterge, üç güçlü teknik analiz aracını tek bir göstergede birleştirir: Aylık Seviyeler (High, Low, Open, Close) – önemli destek ve direnç bölgelerini belirlemek için. PinBar Tespiti – fiyat reddini gösteren güvenilir bir dönüş mum modeli. Marubozu Tespiti – güçlü trend mumları ile yönlü momentum gösterir. Bu birleşim sayesinde, görsel, kapsamlı ve hızlı tepki veren bir piyasa tahmin aracına sahip olursunuz. Avantajlar Kurum
ABCD Lemissa + Aylık Seviyeler + PinBar + Marubozu Açıklama Bu gösterge, birden fazla güçlü aracı birleştirerek piyasayı görsel olarak analiz etmenizi sağlar: ABCD Lemissa – ABCD yapısını otomatik olarak algılar ve A, B, C, D noktalarını, destek/direnç bölgelerini ve alım/satım oklarını gösterir. Aylık Seviyeler (Monthly Levels) – Aylık mumların High, Low, Open, Close seviyelerini göstererek önemli bölgeleri belirler. PinBar & Marubozu – PinBar mumları (dönüş sinyalleri) ve Marubozu mumları (
Order Block Pro (MQL5) – Sürüm 1.0 Yazar: KOUAME N'DA LEMISSA Platform: MetaTrader 5 Açıklama: Order Block Pro , grafiğinizdeki boğa ve ayı emir bloklarını (Order Blocks) otomatik olarak tespit eden gelişmiş bir göstergedir. Konsolidasyon mumlarını ve ardından gelen güçlü impuls mumlarını analiz ederek, fiyatın hızlanabileceği kritik bölgeleri belirler. Bu gösterge, şunları yapmak isteyen traderlar için idealdir: Kesin giriş ve çıkış noktalarını belirlemek Dinamik destek ve direnç bölgelerini t
ETE Detector v4.0 (Head & Shoulders) Author: KOUAME N’DA LEMISSA Version: 4.0 Platform: MetaTrader 5 Indicator Type: Chart / Visual Trading Signals Overview The ETE Detector v4.0 is a technical indicator designed to automatically detect classic and inverse Head & Shoulders patterns (H&S) on MT5 charts. These patterns are widely used to anticipate trend reversals. With this tool, traders can: Detect sell signals (classic H&S) and buy signals (inverse H&S) with accuracy. Easily visualize patterns
Avis commercial – ETE DETECTOR POWER v5.0 (Head & Shoulders Pro) Détection automatique des motifs tête et épaules ETE DETECTOR POWER v5.0 est un outil professionnel conçu pour les traders qui souhaitent anticiper les retournements majeurs du marché en utilisant l'un des modèles graphiques les plus puissants : le Head & Shoulders (H&S) et sa variation inverse. Grâce à son système de gestion d'objets optimisé (MaxObjects) , l'indicateur reste fluide et lisible, même sur des graphiques chargés
Dynamique mensuelle des plages hautes et basses v1.0 Auteur : KOUAME N'DA LEMISSA Description : L' indicateur dynamique mensuel de fourchette haute et basse affiche les niveaux mensuels clés sur votre graphique grâce à des fonctionnalités avancées de suivi dynamique. Il permet aux traders de visualiser facilement les zones de support et de résistance mensuelles, ainsi que les zones où le prix tend à dépasser ou à tester ces niveaux, offrant ainsi des opportunités de trading précises. P
Monthly High & Low Dynamic Range + Liquidity Zones v1.2 Author: KOUAME N'DA LEMISSA Description: Transform your market analysis with this powerful indicator that combines: Key Monthly Levels: High, Low, Open, and Close to identify the most important support and resistance zones. Dynamic High/Low Range: Automatically tracks extreme price movements to detect significant market shifts. Liquidity Zones: Visual rectangles showing areas where liquidity is concentrated (Buy/Sell). The thickness and c
Turc (Turc / Türkçe) Booster Trading Pro Yazar : KOUAME N'DA LEMISSA Plateforme : MetaTrader 5 Site : Çok Fonksiyonlu Teknik Gösterge Açıklama Piyasa analizini Booster Trading Pro est disponible; birden fazla temel aracı bir araya getiren hepsi bir arada bir göstergedir: Aylık temel seviyeler: yüksek, düşük, açılış e kapanış ile destek e direnç bölgelerini hızlıca belirleyin. Dinamik yüksek/düşük aralık: fiyatın aylık seviyelerin üzerinde veya altında ekstrem hareketlerini takip edin. Dinami
StructureBlocksAuto + MensuelOU La puissance de la structure rencontre la précision mensuelle Description Fusion StructureBlocksAuto + MonthlyOR est un indicateur tout-en-un avancé combinant la détection de la structure du marché (swings automatiques, plus hauts/plus bas et blocs de structure) avec le système Monthly Open Range (MOR) . Il offre une combinaison professionnelle d'analyse de la structure institutionnelle et de niveaux clés mensuels pour vous aider à détecter les zones de tradi
Channel Ultima
N'da Lemissa Kouame
Channel Ultima – Indicateur Multi-Canal Dynamique Description courte Channel Ultima est un indicateur avancé qui trace automatiquement trois canaux dynamiques du marché. Il offre une lecture claire des zones de support, de résistance et d'équilibre , idéale pour les traders techniques et structurels. Présentation détaillée Channel Ultima détecte et affiche trois canaux indépendants associés sur les pivots majeurs et mineurs du marché. Chaque canal représente une zone de pression sur le p
Carte de liquidité institutionnelle Pro Voyez ce que voient les institutions — avant tout le monde Aperçu Institutional Liquidity Map Pro est un indicateur professionnel conçu pour cartographier les zones de liquidité institutionnelle à l'aide des niveaux mensuels les plus hauts et les plus bas . Il détecte automatiquement les zones de stop-hunt , les zones de retournement potentiel et les zones d'accumulation/distribution institutionnelles . L'indicateur suit dynamiquement jusqu'à trois ni
Filtrele:
İnceleme yok
İncelemeye yanıt