MT5 Support and Resistance
- Göstergeler
-
Eslam Salman
 HELLO,
PLEASE USE 0.02 PER 1000 USD Leverage 1:400 Or Higher, Allow US 15 trades. SET UP YOUR Protection to 15%.
We have a very strict risk management of 10%, However, set up 15 % in Your settings to be higher than our max so you never get closed out.
ALL TRADES ARE EXECUTED MANUALLY. - Sürüm: 1.0
- Etkinleştirmeler: 5
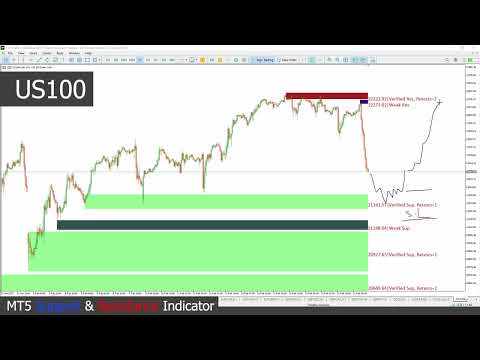
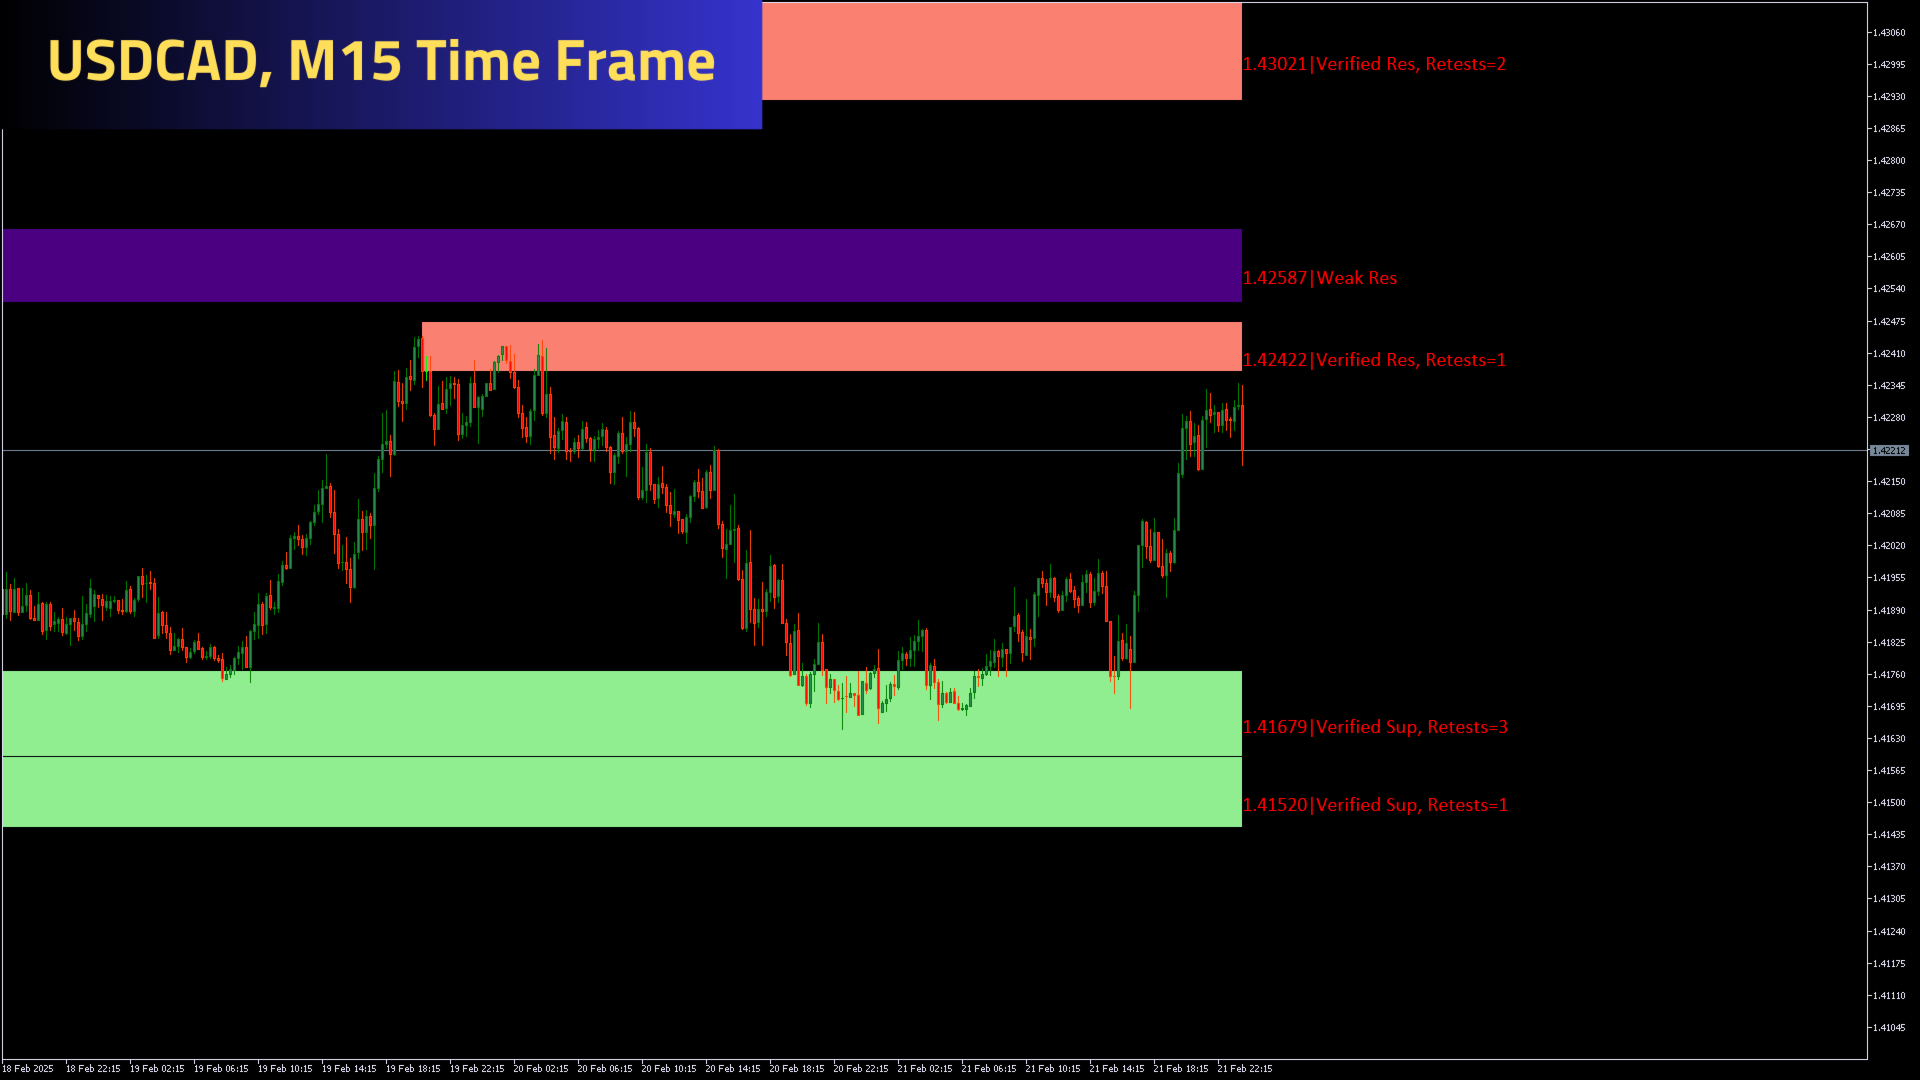
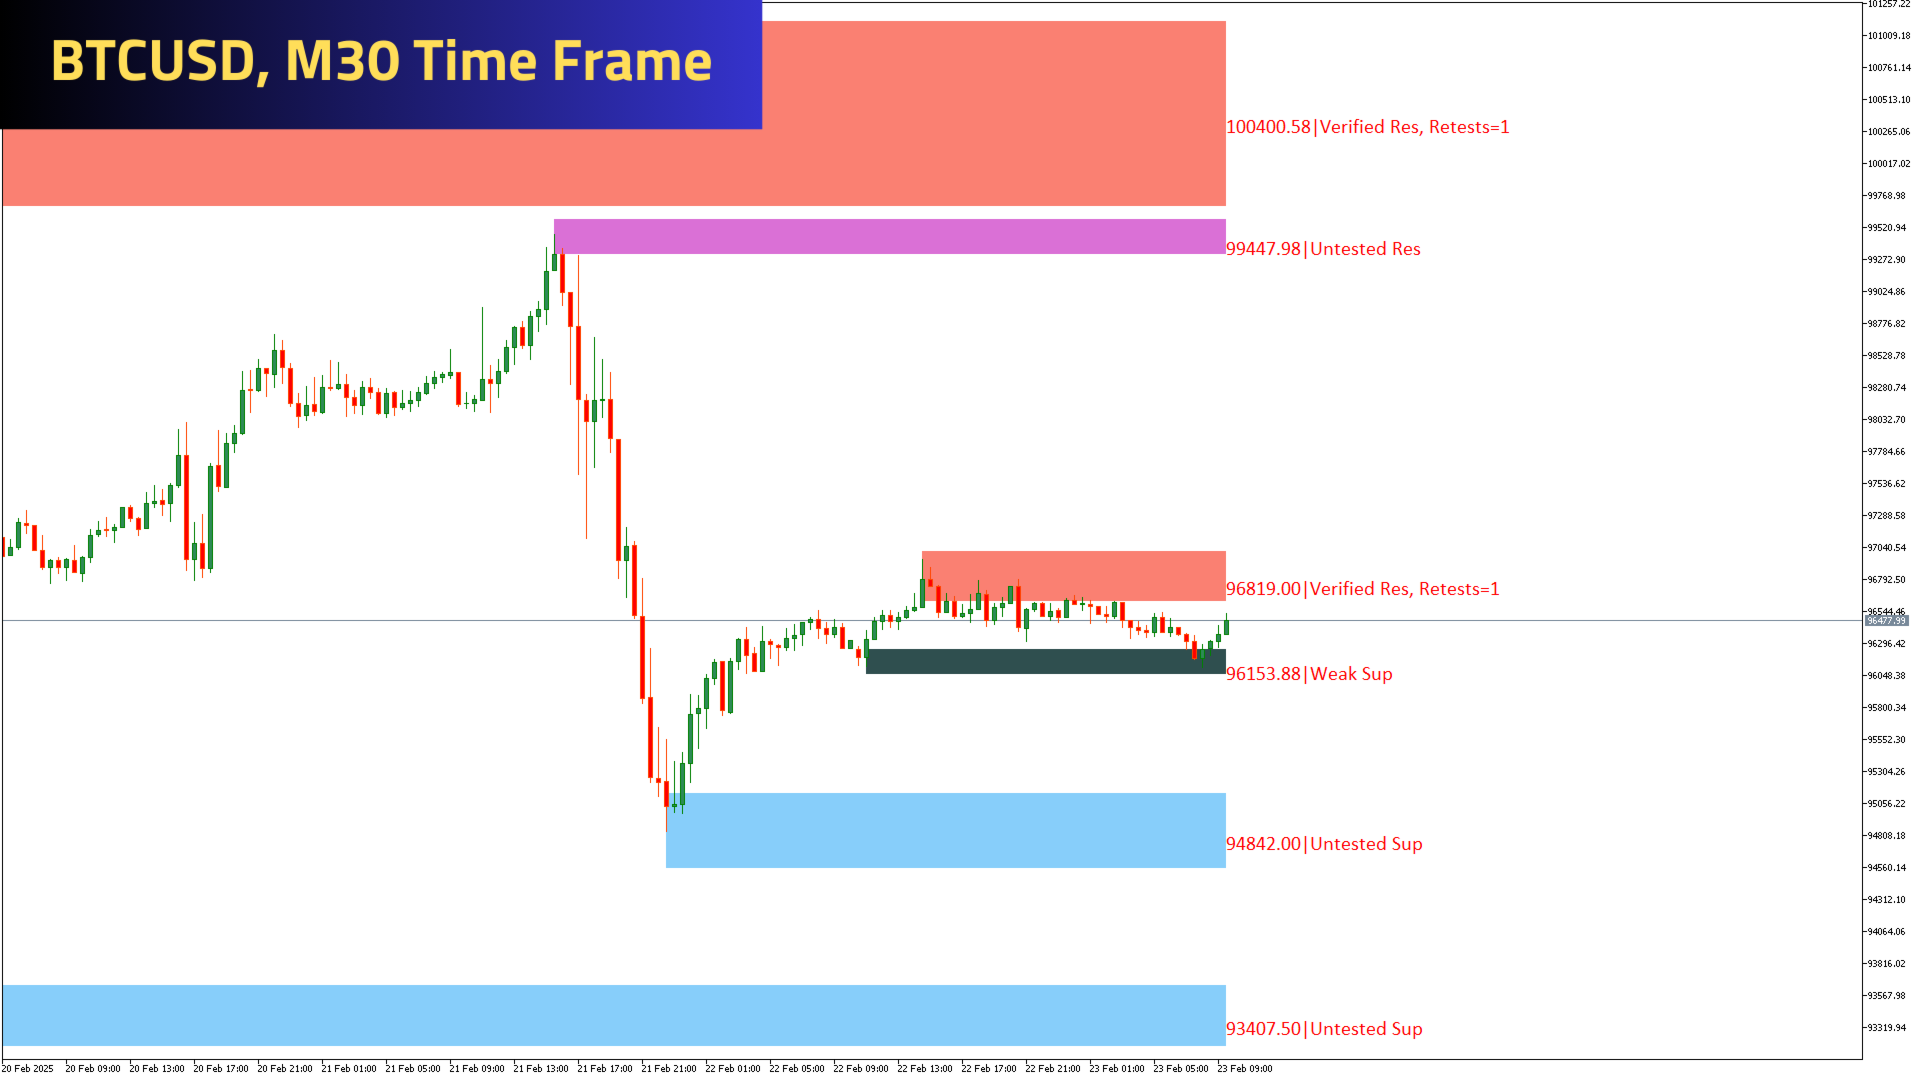
MT5 Support and Resistance Indicator
Automatic Drawing of Multiple Supports and Resistances with levels.
Supports As follow
1. Weak Support
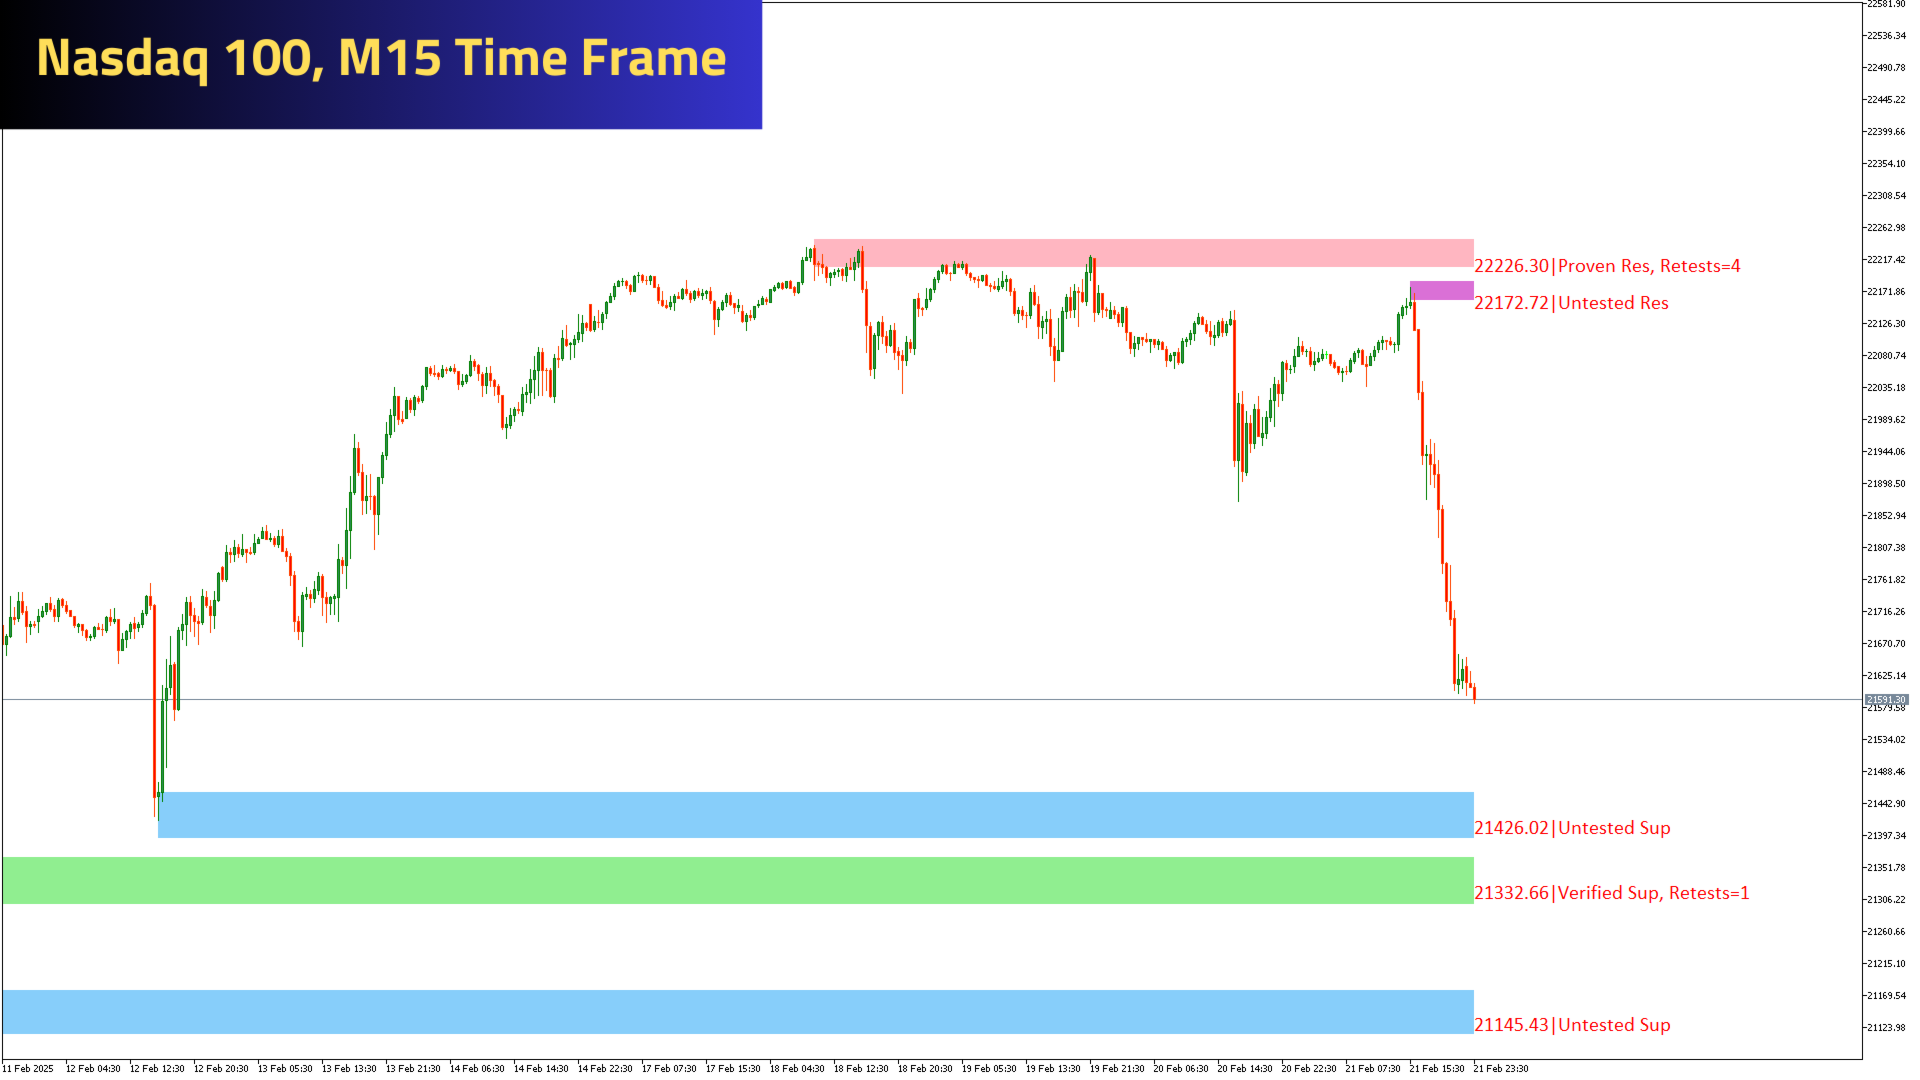
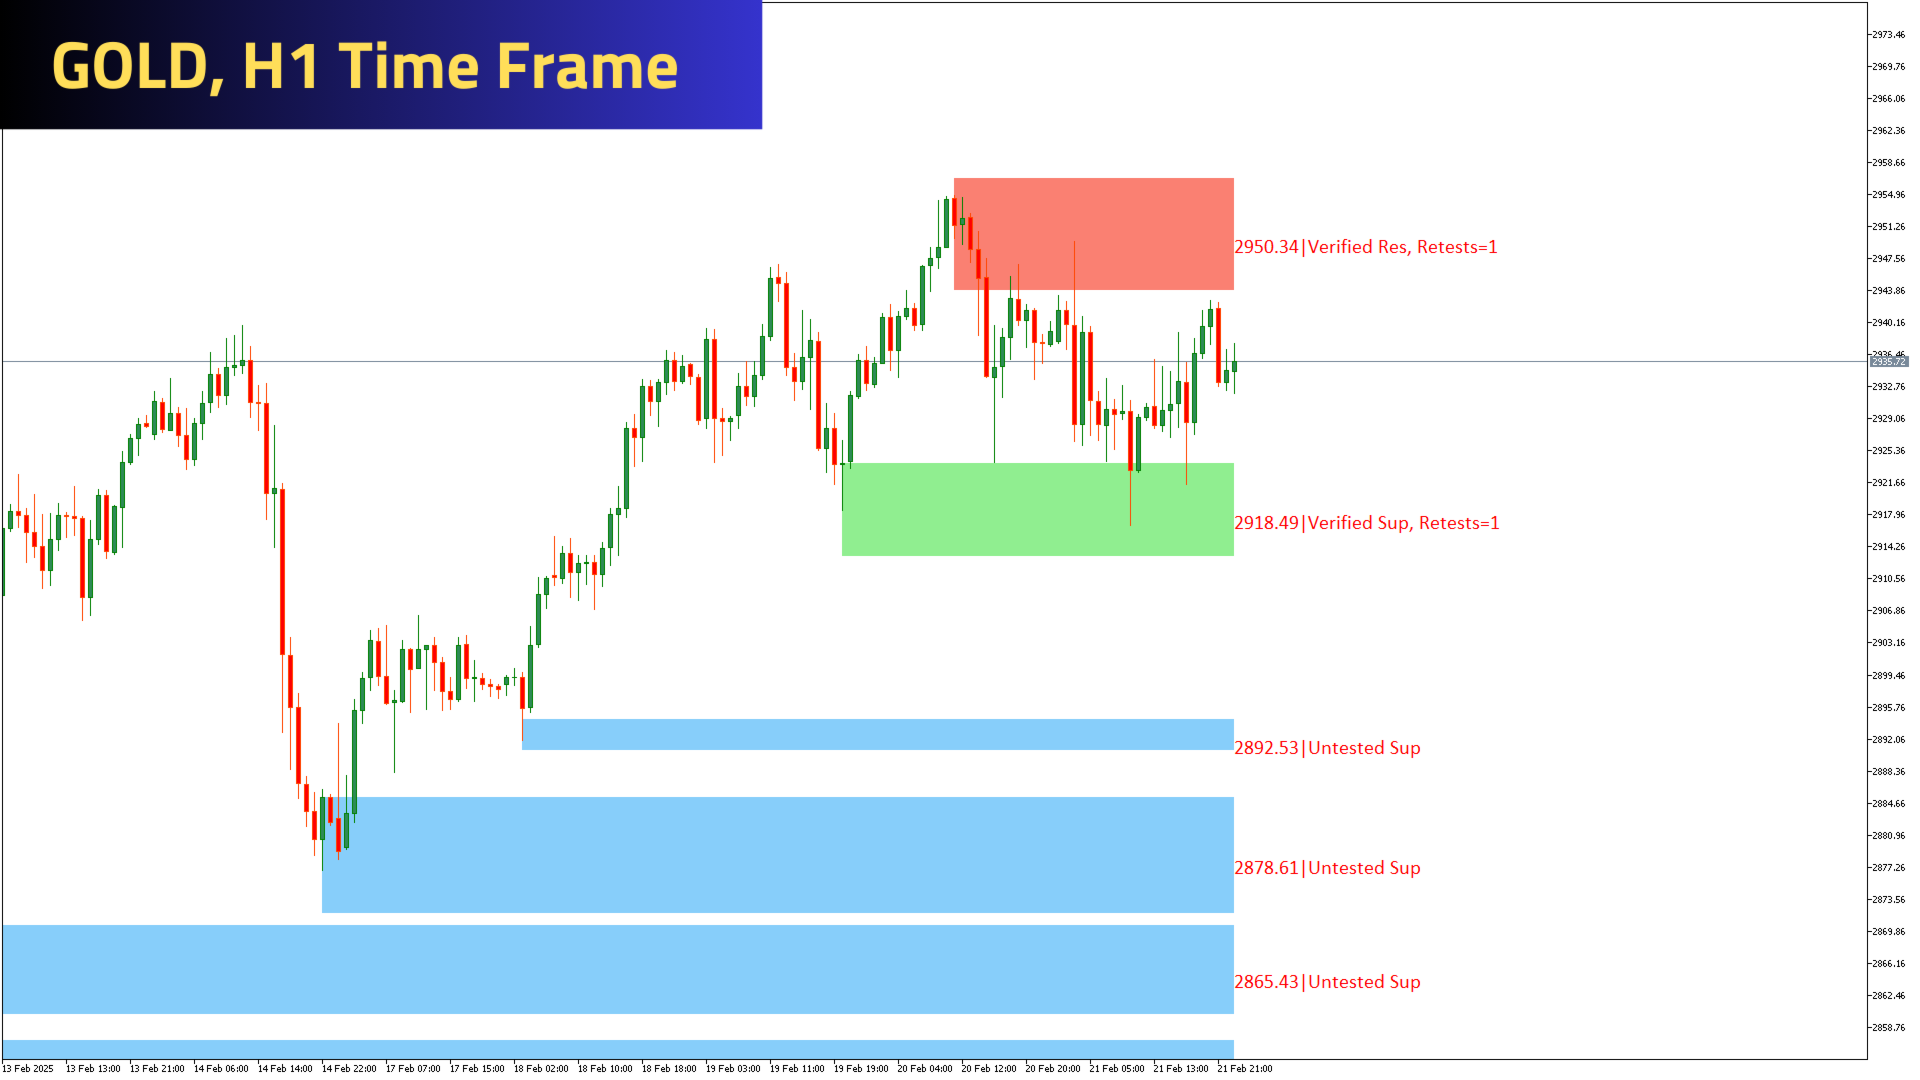
2. Untested Support
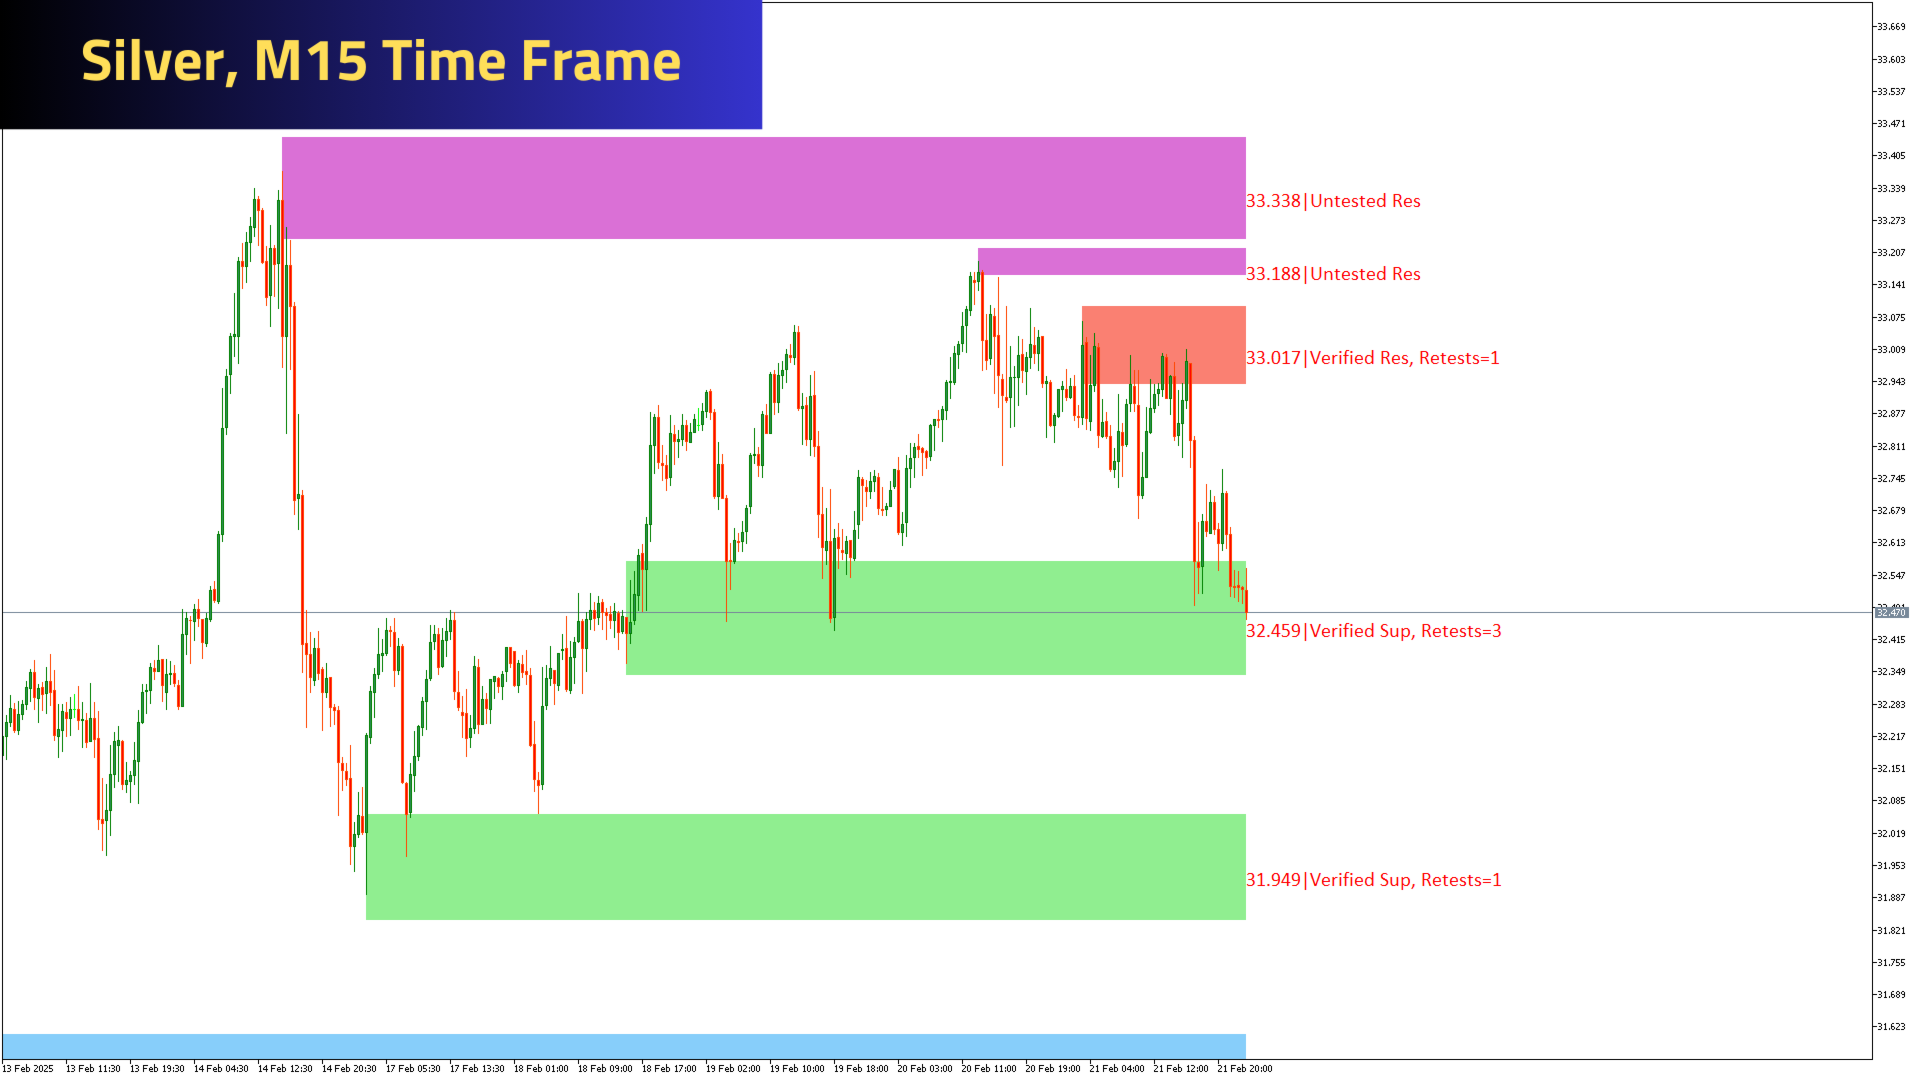
3. Verified Support
4. Proven Support
5. Turncoat Support
Resistances As follow
1. Weak Resistance
2. Untested Resistance
3. Verified Resistance
4. Proven Resistance
5. Turncoat Resistance
Best Strategy to use
1. Identify Trend Direction on Daily Time Frame, Example Gold = Up trend
2. Identify Support Zones at H1
3. Switch to M15 Time Frame, and wait price to fall to H1 Support area, then start to bounce back up.
4. Buy above the M15 Time Frame Support, place Stop loss right below the Support, and target the next Resistance level.
Combine with 5 Blocks
1. Follow Previous instructions and use the Buy signals generated from out other product the 5 Blocks Indicator.
Assistance:
Contact us for any clarification