Mtf Rsi Fusion Basic
- Göstergeler
- Sürüm: 1.0

MTF RSI Fusion Basic
MTF RSI Fusion, birden fazla RSI hesaplamasından elde edilen momentum bilgisini tek bir yapılandırılmış gösterge içerisinde birleştirmek için geliştirilmiş çoklu zaman dilimli bir RSI osilatörüdür.
Gösterge yalnızca tek bir RSI kaynağına bağlı kalmak yerine, farklı zaman dilimlerinden gelen maksimum üç RSI akışını tek bir “Fusion RSI” çizgisinde birleştirir. Adaptif aşırı alım/aşırı satım bölgeleri, trend yönü görselleştirmesi, divergence tespiti, sinyal üretimi ve isteğe bağlı VWAP filtreleme gibi ek araçlar da aynı framework içerisinde kullanılabilir.
Gösterge; momentum, trend ve doğrulama araçlarını tek bir çalışma yapısı içerisinde organize ederken grafiğin temiz kalmasını sağlamak amacıyla tasarlanmıştır.
Main Features
- Çoklu zaman dilimli RSI Fusion motoru
- Maksimum üç bağımsız RSI kaynağı
- Her RSI için ayrı timeframe, periyot ve weighting ayarları
- Birden fazla Fusion ve Combine modu
- Adaptif aşırı alım ve aşırı satım bölgeleri
- ATR tabanlı dinamik volatilite ayarı
- Trend bias renklendirmesi
- Üst zaman dilimi mum analizi
- Moving Average eğim analizi
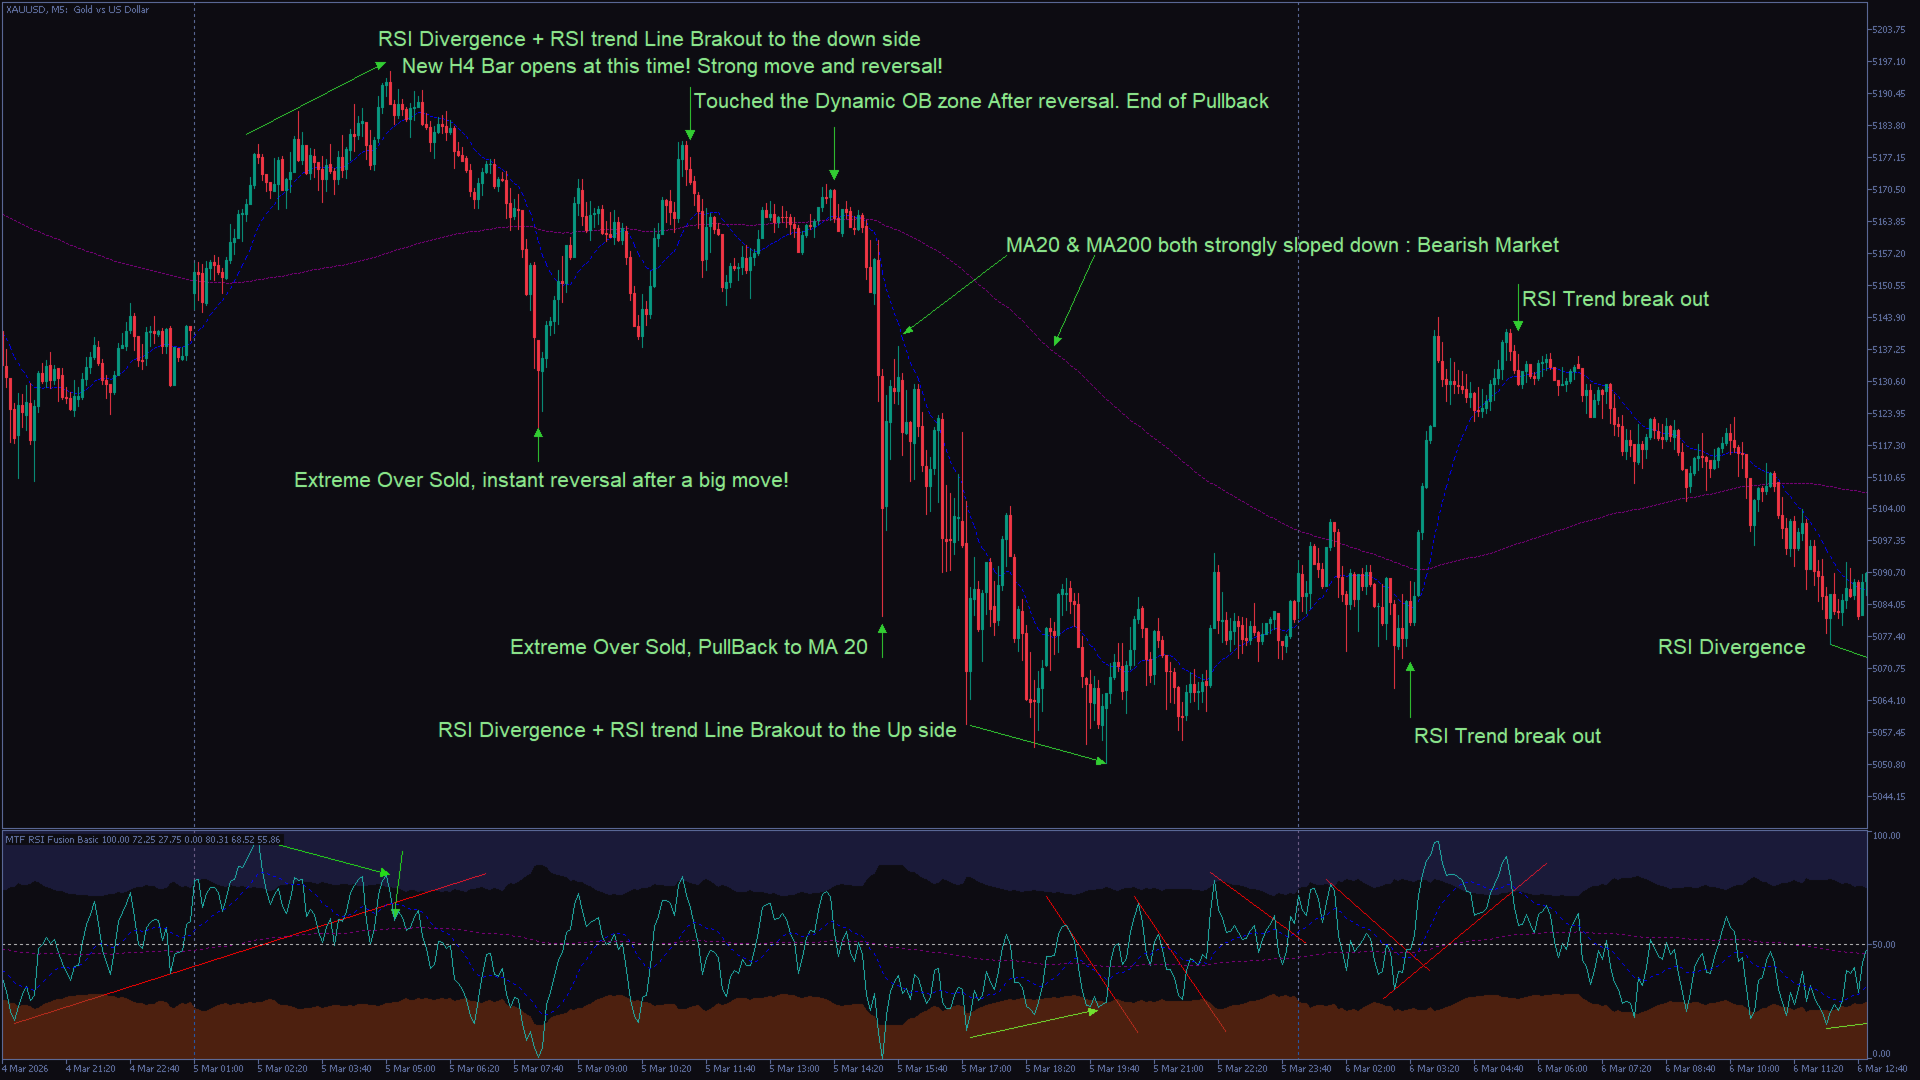
- Bullish ve bearish divergence tespiti
- Buy/Sell sinyal motoru
- İsteğe bağlı VWAP osilatörü
- İsteğe bağlı VWAP tabanlı sinyal filtreleme
- Ana grafik üzerinde divergence çizimi
- Ana grafik üzerinde sinyal çizimi
- Performans ve obje yönetim araçları
Multi-Timeframe RSI Fusion Engine
Gösterge, maksimum üç RSI hesaplamasını tek bir momentum yapısı içerisinde birleştirir.
Her RSI kaynağı şunları kullanabilir:
- bağımsız timeframe,
- ayrı RSI periyodu,
- ve bağımsız fiyat kaynağı.
Bu yapı sayesinde kısa vadeli momentum, orta vadeli piyasa yapısı ve üst zaman dilimi yönü tek bir osilatör içerisinde birleştirilebilir.
Weighting sistemi, her RSI kaynağının nihai Fusion RSI hesaplaması üzerindeki etkisinin artırılıp azaltılmasına olanak sağlar.
Fusion and Combine Modes
MTF RSI Fusion, nihai osilatör davranışını şekillendirmek için birden fazla Combine modu içerir.
Mevcut modlar:
- AVG
- ADDSUB
- SUBADD
AVG modu daha yumuşak bir yapı oluşturur.
ADDSUB ve SUBADD modları orta bölge etrafında alternatif davranışlar sunar ve yapılandırmaya bağlı olarak daha agresif veya ters momentum geçişleri oluşturabilir.
İsteğe bağlı Clamping özelliği, nihai sonucu RSI 0–100 aralığında tutabilir.
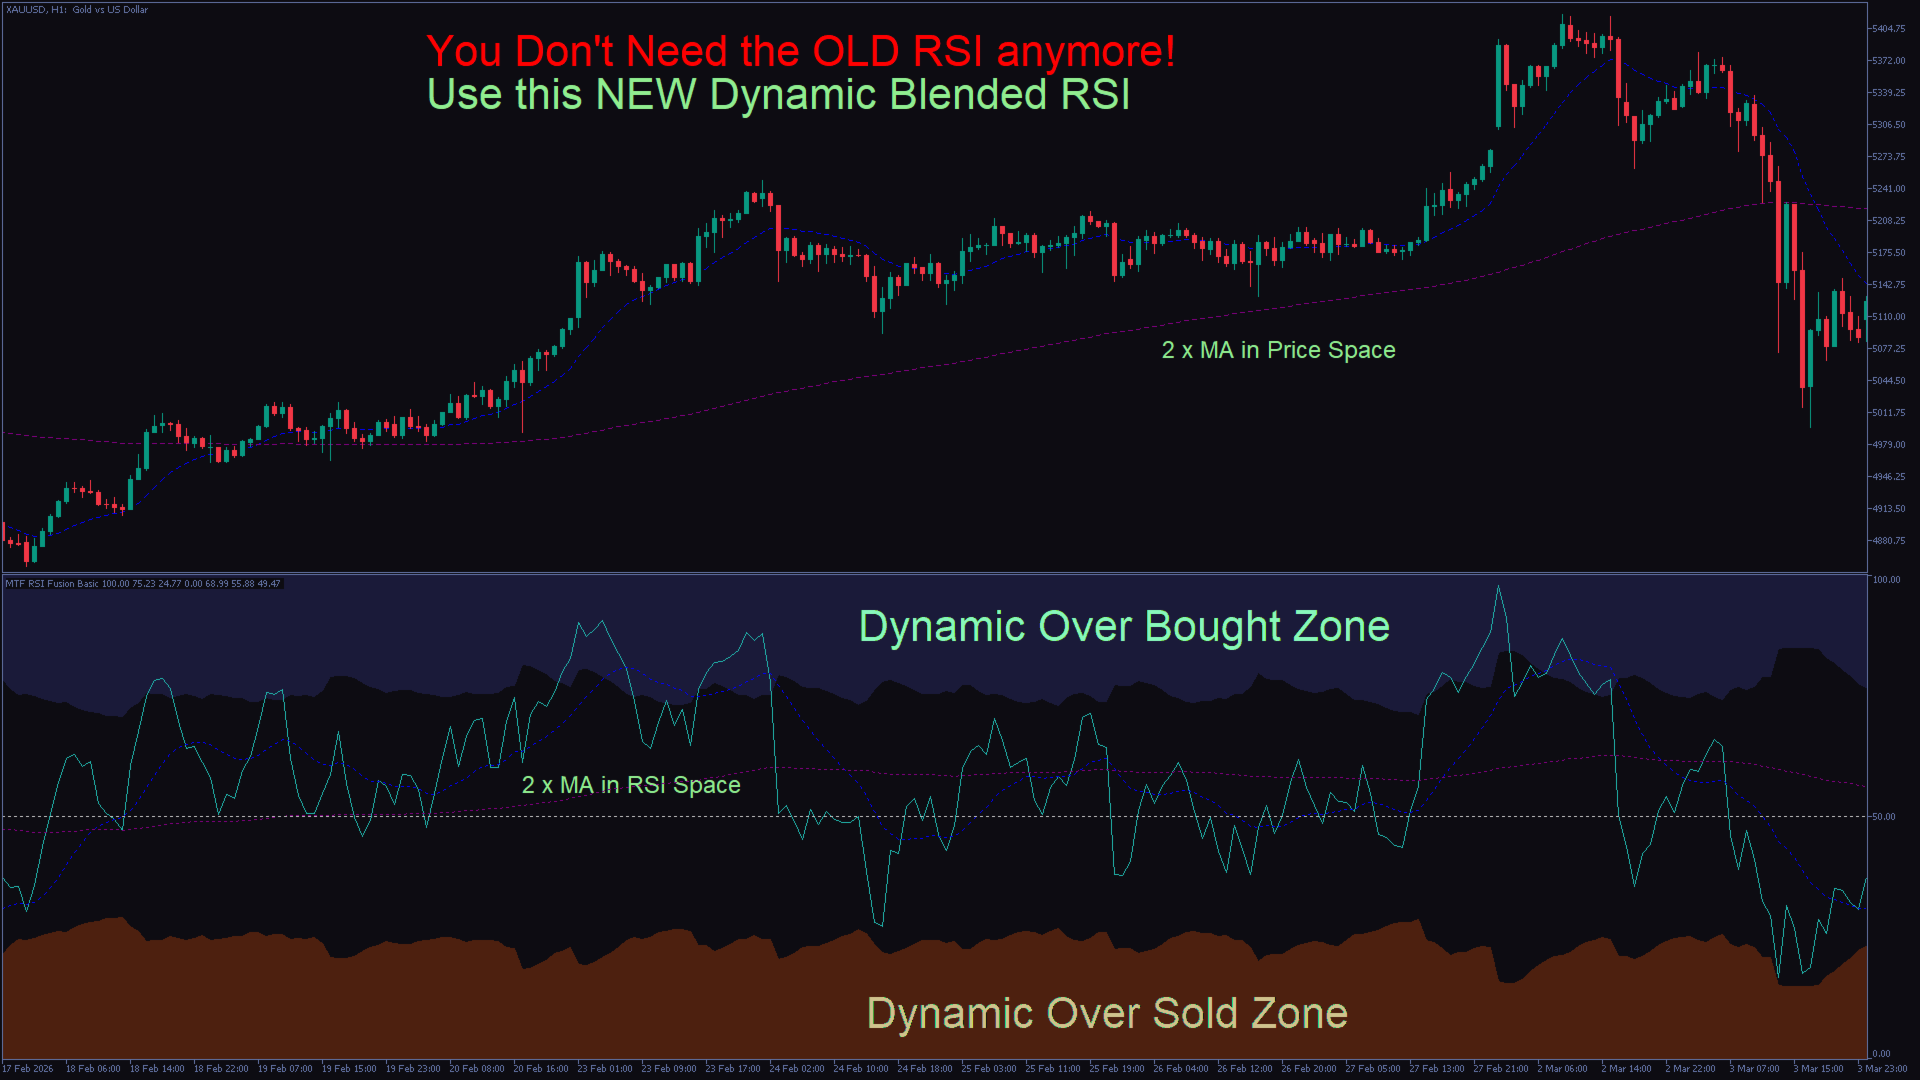
Adaptive Overbought and Oversold Zones
Gösterge, yalnızca sabit 70/30 seviyelerine bağlı kalmak yerine adaptif aşırı alım ve aşırı satım bölgeleri kullanır.
Bölge genişliği ATR tabanlı volatilite hesaplamalarıyla otomatik olarak ayarlanır.
Yüksek volatilite koşullarında bölgeler genişleyerek aşırı sinyal oluşumunu azaltabilir.
Düşük volatilite koşullarında bölgeler daralarak daha yüksek hassasiyet sağlayabilir.
Bu dinamik bölgeler; pullback analizi, momentum zayıflaması gözlemi, dönüş hareketleri ve mean reversion çalışmaları için kullanılabilir.
Bölgelerin minimum ve maksimum genişlikleri manuel olarak yapılandırılabilir.
Trend Bias and Coloring
MTF RSI Fusion, Fusion RSI çizgisine trend tabanlı renklendirme uygulayabilir.
Trend yönü şu yöntemlerden türetilebilir:
- üst zaman dilimi mum analizi,
- Moving Average eğim analizi,
- veya her iki yöntemin kombinasyonu.
Mevcut durumlar:
- Bullish
- Bearish
- Neutral
Trend framework’ü; trend devam koşullarını ayırmak, trend karşıtı kurulumları filtrelemek ve yönlü hareketler içerisindeki pullback yapılarını belirlemek için kullanılabilir.
Slope analysis eşik değerleri yapılandırılabilir.