Neuron MACD
- Индикаторы
-
Muhammad Hassaan
 I'm a quant-minded trader and developer. I build MetaTrader tools the way a quant builds models — deterministic, rules-based and non-repainting. No black boxes and no hype: every level and signal comes from defined price-structure logic you can see, tune and verify.
 - Версия: 1.10
- Активации: 5
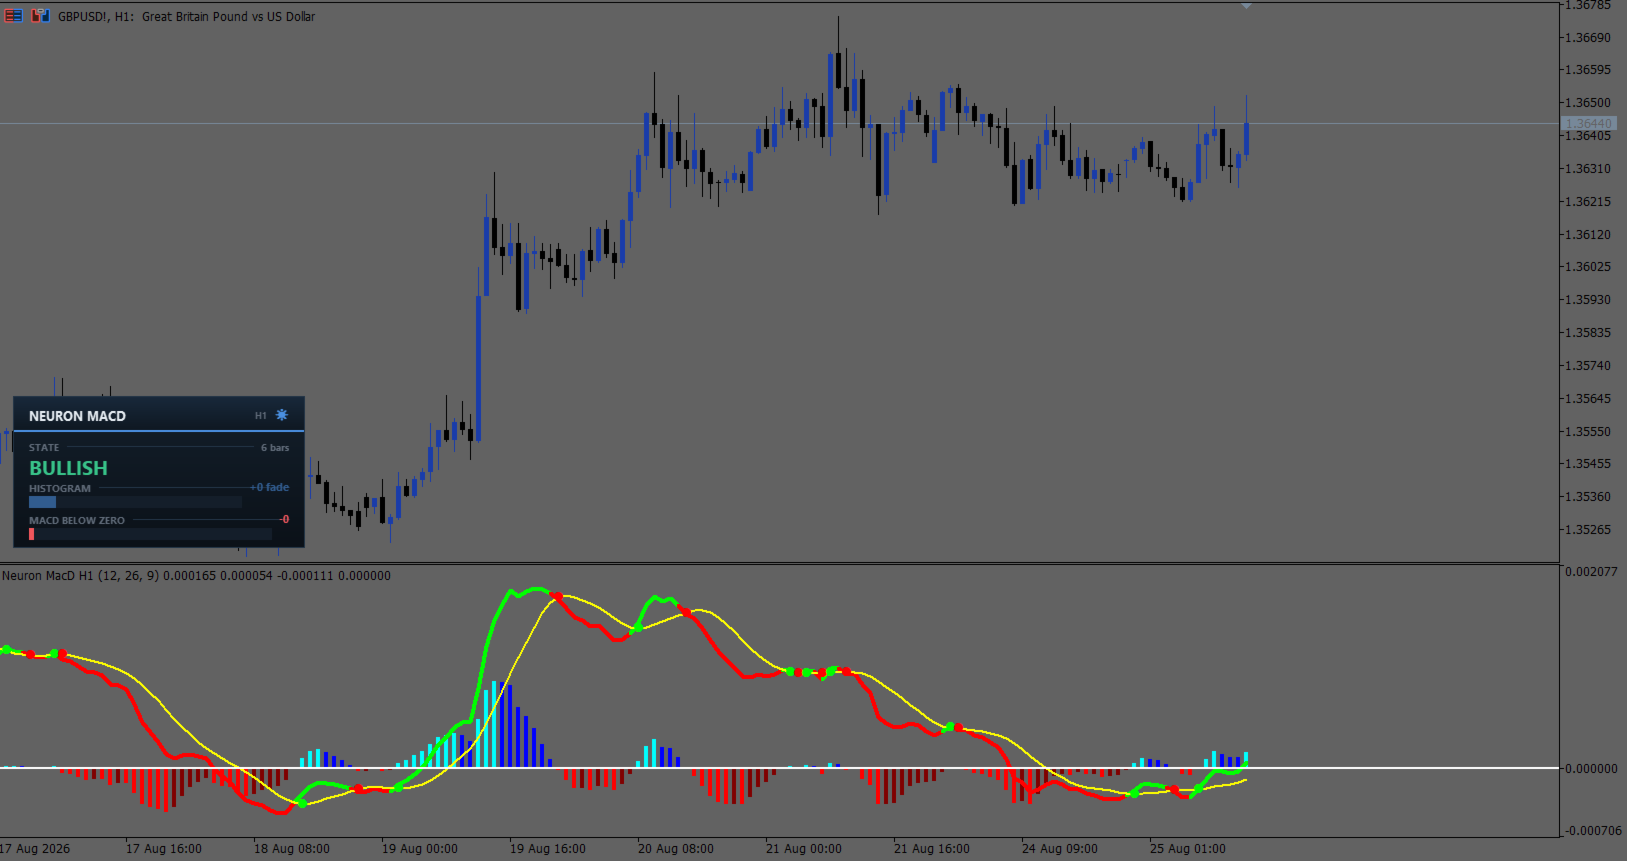
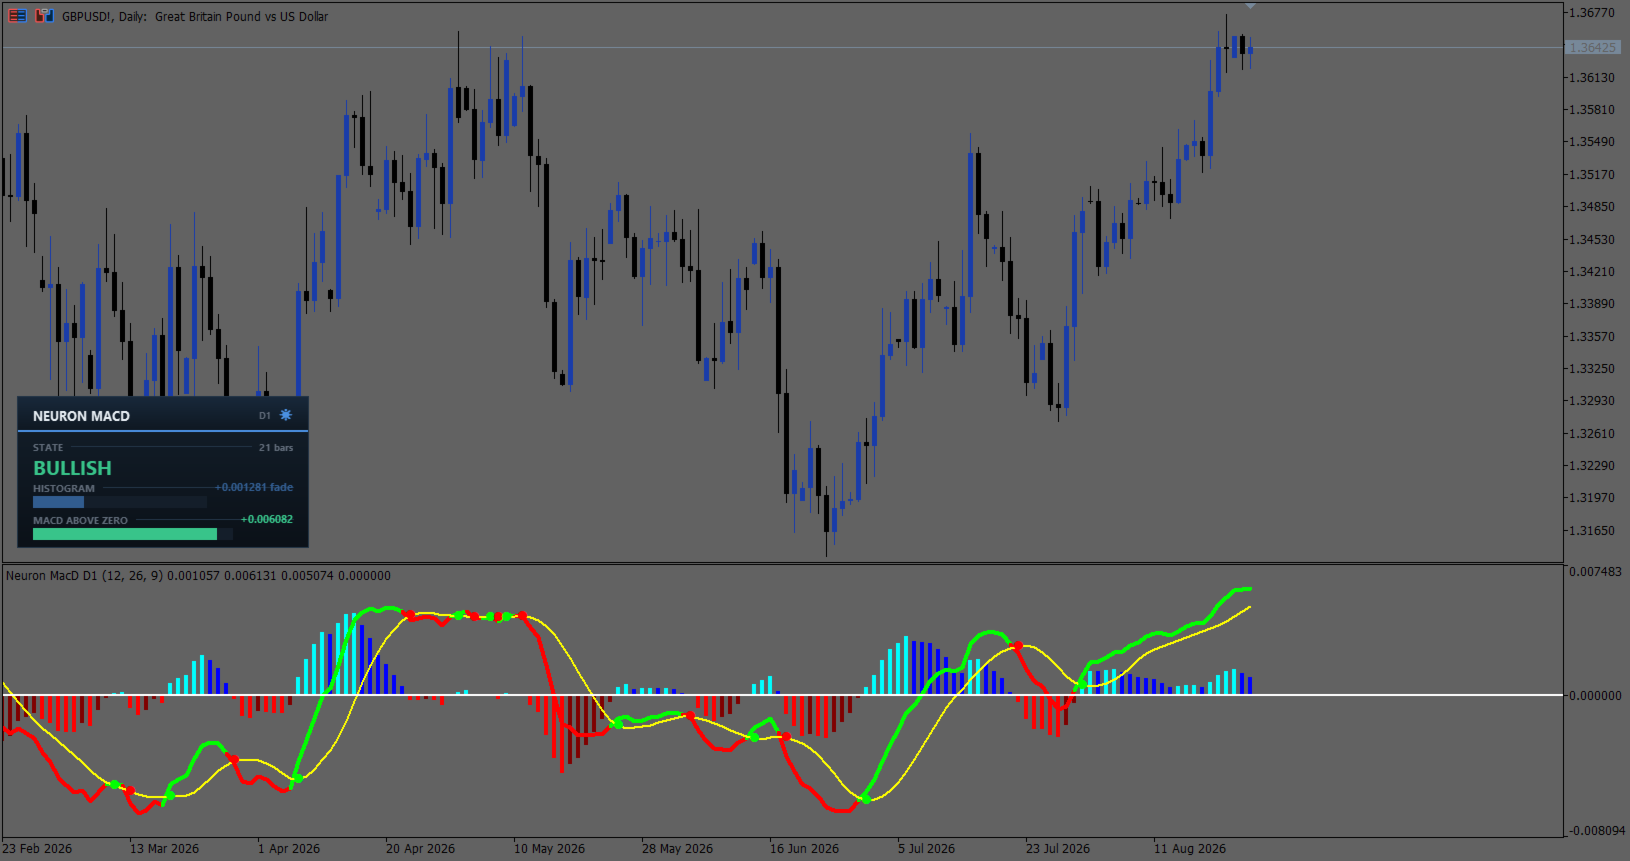
Neuron MacD is a MACD you can read at a glance instead of squinting at. The histogram is split into four colours — not two — so each bar tells you which side of zero it sits on and whether it is still growing or already shrinking. The MACD line changes colour the moment it crosses its signal, a dot marks every cross on the signal line itself, and the whole calculation can be pulled from a higher timeframe while you trade a lower one. It is an indicator for chart analysis only: it draws on the chart, it does not place, modify or close trades, it does not send orders, and it does not manage positions or accounts.
A panel on the price chart carries the state, the histogram and the MACD as live meters, so the reading is available without looking away from price. Native MQL5, no DLLs, closed bars are final, and it runs on forex, gold and metals, indices and crypto across any timeframe.
=== HOW IT WORKS ===
The core is the classic MACD: a fast exponential average minus a slow one, with a signal line and a histogram of the distance between them. Two details matter and are easy to get wrong. The signal here is a simple moving average of the MACD, not an exponential one, which is what the original rendering of this indicator uses and what gives the crosses their particular timing. And the histogram is the MACD minus that signal, so it is a measure of separation, not of the MACD itself.
The four histogram colours come from two questions asked together. Is the bar above or below zero, and is it taller or shorter than the bar before it? Above zero and growing means momentum is extending in favour of buyers. Above zero and shrinking means buyers are still ahead but losing ground — the warning that arrives while the histogram is still positive. Below zero the same pair reads for sellers. One colour, two facts, no second glance.
The MACD line is coloured by its position against the signal, so trend agreement is legible without tracing which line is on top, and a dot is printed on the signal line at every cross. Because the dot sits on the signal rather than floating above the pane, it marks the exact level the cross happened at.
Multi-timeframe is a first-class feature, not an afterthought. Leave the resolution on the chart's own and it behaves as a normal MACD. Point it at a higher timeframe and the entire calculation — both averages, the signal and the histogram — is computed on that timeframe's closes and mapped back onto your chart, so you can watch the four-hour picture while working a five-minute chart. The timeframe in use is printed on the panel so a borrowed reading is never mistaken for the chart's own.
=== WHAT IS INCLUDED ===
| Module | What it does |
|---|---|
| Four-colour histogram | Above zero growing, above zero shrinking, below zero growing, below zero shrinking — each with its own colour, so a stalling move is visible before it turns. |
| Colour-changing MACD line | The line itself carries the signal relationship, switching colour the bar the cross happens. |
| Cross dots | A dot on the signal line at every MacD/signal cross, marking the exact level rather than a generic marker floating in the pane. |
| Multi-timeframe engine | Run the whole calculation on any timeframe from any chart. The panel shows which timeframe is feeding the reading. |
| State & duration | BULLISH or BEARISH with the number of bars held since the last cross — a six-bar-old cross and a sixty-bar-old trend stop looking alike. |
| Histogram meter | The current histogram scaled against the last hundred bars, tagged fade the moment it stops growing, so strength is read in context instead of as a raw number. |
| MACD meter | Distance from the zero line, scaled the same way, with the header naming which side of zero the MACD is on. |
| Signal panel | The Neuron panel on the price chart, one of nine anchors, scalable from 70% to 250% for any screen. Reads closed bars only. |
| Light & dark themes | Two tuned palettes, not one palette dimmed. A sun/moon icon in the panel header switches between them live. |
| Alerts | Signal cross and zero-line cross, each switchable on its own, by terminal popup, phone push notification or email. Evaluated on closed bars, once per bar. |
| Display switches | Histogram, lines and dots can each be turned off, and both colour schemes can be reduced to a single colour, so the pane shows only what you use. |
| EA buffers | The raw MACD and signal are exposed as plain numeric buffers that stay filled whatever the display switches are set to, readable with a single CopyBuffer call. |
=== HOW TO READ IT ===
Start with the histogram colour, not its height. A bright bar above zero is buyers extending; a dark bar above zero is the same buyers running out of push while still ahead. That change of shade is the earliest thing the indicator gives you, and it arrives well before the histogram crosses zero or the lines cross each other.
The MACD line colour confirms it. While the line holds its bullish colour the fast average is still above the signal, and a run of darkening histogram bars under a still-bullish line is a move losing steam rather than reversing. When the dot prints, the relationship has actually changed, and the panel's bar count restarts from there.
Use the zero line for context rather than for signals. A bullish cross that happens below zero is a counter-trend bounce inside a weak market; the same cross above zero is a pullback ending inside a strong one. The panel names the side explicitly so you do not have to judge it by eye on a compressed pane.
In multi-timeframe mode, read the panel's timeframe chip first. A higher-timeframe MACD holds one value across all the chart bars inside each of its own bars, so the line steps rather than curves and the histogram bars repeat — that is the higher timeframe speaking, not a fault.
=== INPUTS ===
| Setting | Default | What it does |
|---|---|---|
| Timeframe | ||
| Use current chart resolution | true | Calculate on the chart's own timeframe. Uncheck to borrow another one. |
| Different timeframe | H1 | The timeframe to calculate on when the box above is unchecked. |
| Calculation | ||
| Fast EMA length | 12 | The faster of the two exponential averages. |
| Slow EMA length | 26 | The slower average. Must be larger than the fast one. |
| Signal SMA length | 9 | Simple moving average of the MACD, giving the signal line. |
| History bars to process | 5000 | How far back to calculate and draw. 0 processes all available history. |
| Display | ||
| Show MacD and signal line | true | Draw the two lines. Off leaves the histogram alone in the pane. |
| Show dots when MacD crosses signal | true | Print a dot on the signal line at every cross. |
| Show histogram | true | Draw the histogram. |
| Change MacD line colour on signal cross | true | Colour the line by its position against the signal. Off draws it in a single colour. |
| MacD histogram 4 colours | true | Off reduces the histogram to one neutral colour. |
| Dashboard | ||
| Show dashboard | true | Show the state, histogram and MACD panel on the price chart. |
| Dashboard position | Bottom Left | One of nine chart anchors. |
| Dark mode | true | Initial theme; the sun/moon icon in the header toggles it live. |
| Dashboard size % | 100 | 70 to 250. Scales the whole panel — text, meters and padding together — for 4K screens or small laptops. |
| Alerts | ||
| Alert on MacD / signal cross | true | Fire on the bar the lines cross, naming the direction. |
| Alert on MacD zero-line cross | false | Fire when the MACD changes side of zero. |
| Terminal popup alert | true | Popup in the terminal. |
| Push notification to phone | false | Mirror alerts to the MetaTrader app. |
| Email alert | false | Mirror alerts to the email configured in the terminal. |
| Colours | ||
| Histogram: above zero, rising / falling | Aqua / Blue | Momentum extending, then fading, above the zero line. |
| Histogram: below zero, falling / rising | Red / Maroon | Momentum extending, then fading, below the zero line. |
| Histogram: unchanged | Yellow | A bar identical to the one before it, which is common in multi-timeframe mode. |
| Histogram: single-colour mode | Gray | Used when the four-colour switch is off. |
| MacD line above / below signal | Lime / Red | The two line colours, also used for the cross dots. |
| Signal line | Yellow | The signal line colour. |
| Zero line | White | The solid level through the middle of the pane. |
| Cross dot symbol | 159 | Wingdings character code for the cross marker. |
Fixed internals, not exposed as inputs: both averages are seeded from the first available bar, the signal is a simple average of the MACD, the panel meters scale against the last hundred bars, and higher-timeframe data is read up to twenty thousand bars back.
=== GOOD TO KNOW ===
- Closed bars are final — on the chart's own timeframe, a bar's value, colour and dot are fixed once it closes and are never redrawn. The forming bar updates live as price moves, exactly as on any oscillator, so read signals from the close if you want confirmed readings only. The panel ignores the forming bar entirely.
- Multi-timeframe behaves like every MTF tool — while a higher-timeframe bar is still forming, its value moves, and the chart bars inside it hold whatever it read as they closed. Reloading the chart recalculates them from the completed higher-timeframe bar, so a reloaded chart can differ from what you watched live. This is inherent to reading one timeframe on another, and the panel names the timeframe so it is never a surprise.
- Indicator, not an EA — Neuron MacD analyses and draws. It does not place, modify or close orders, and it makes no forecast of price. The decision, the risk and the sizing are yours.
- Alerts behave — each event is evaluated once per closed bar and never fires twice for the same bar, loading history never produces a burst of stale alerts, and everything is muted inside the Strategy Tester and during optimization.
- For EA developers — buffer 0 is the histogram, 2 the MACD line, 4 the signal, and buffers 7 and 8 carry the raw MACD and signal. The raw pair stays filled no matter which display switches are off, so an EA is never starved by a cosmetic setting. All are readable with iCustom and CopyBuffer.
- Platform — MetaTrader 5, any symbol and any timeframe. The oscillator plots in its own sub-window; the panel is drawn through the built-in Canvas on the price chart. No DLLs, no file access, no network calls.
- Light & dark — one click re-themes the panel, each mode with its own palette rather than a dimmed copy of the other. Every plot colour is a separate input, so the pane can be matched to any chart scheme.