Neuron MACD

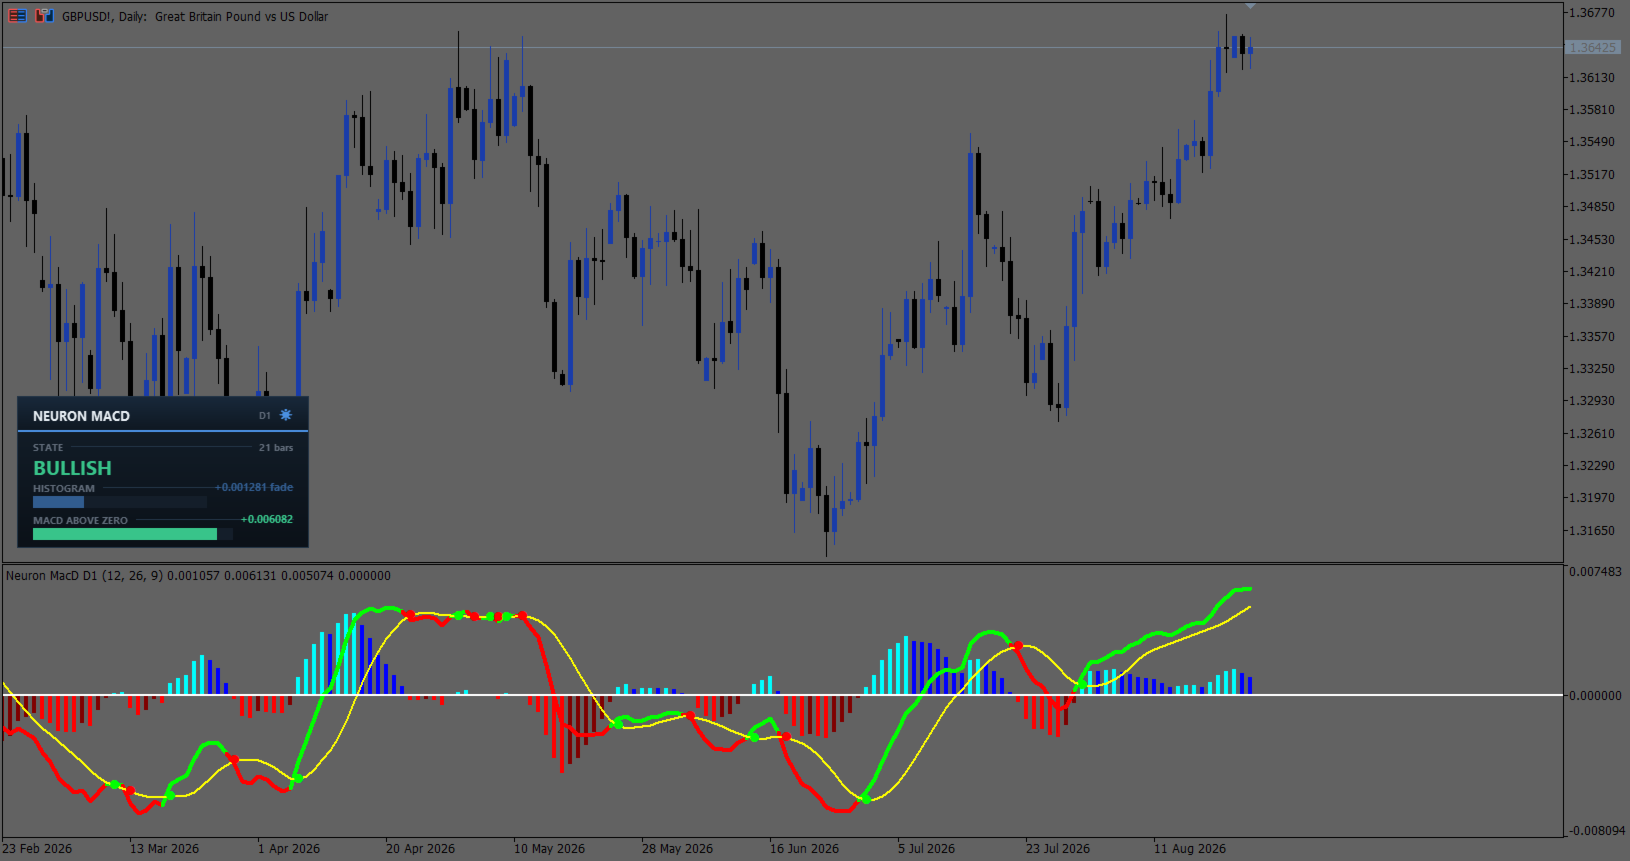
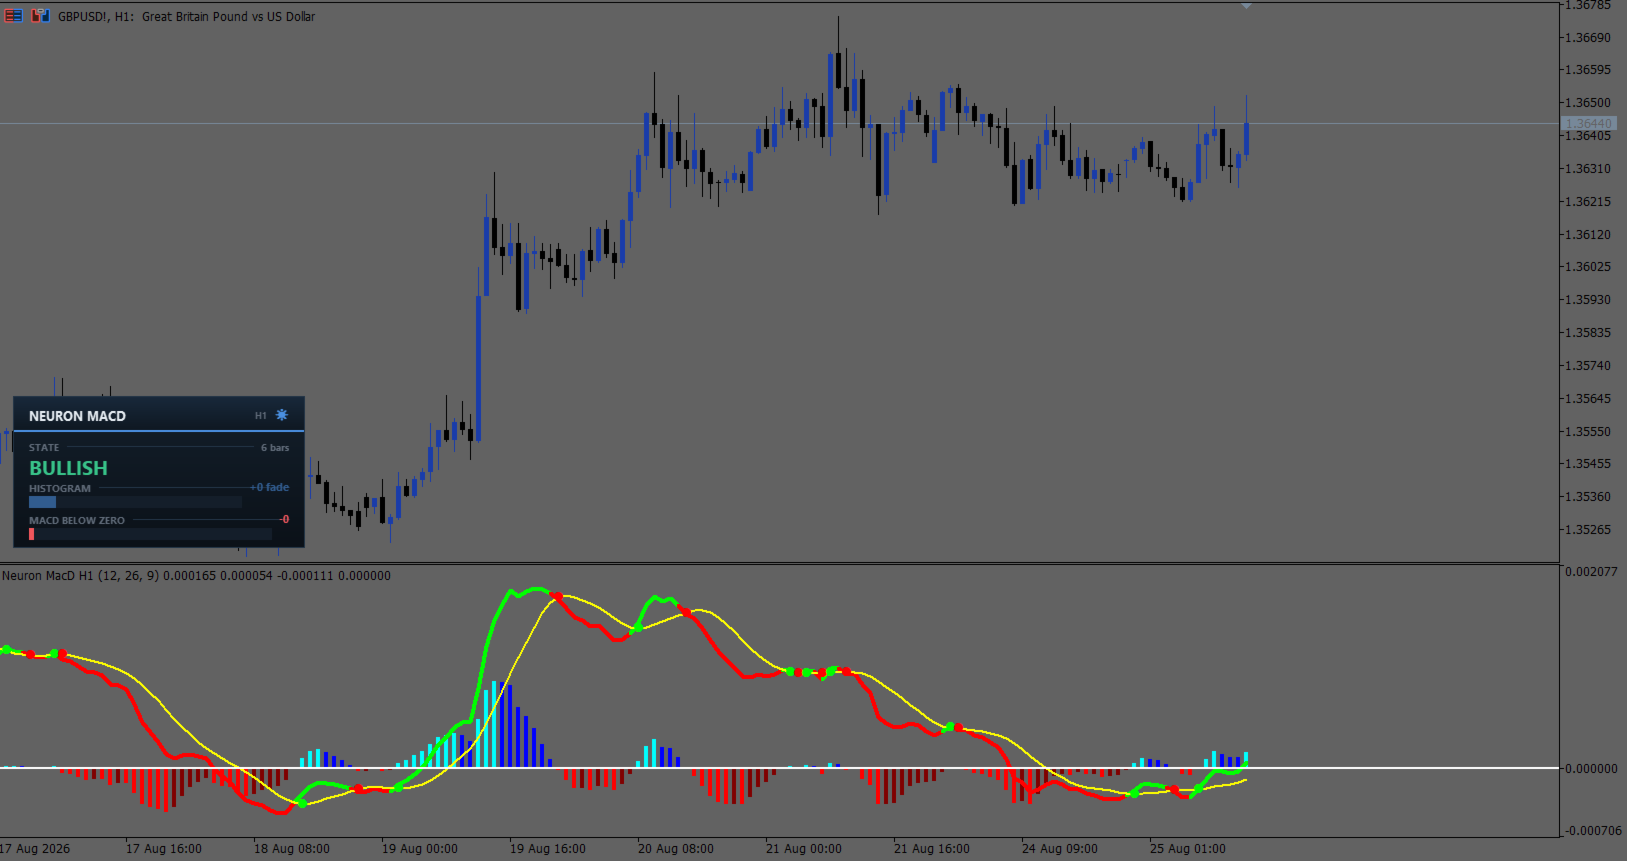
Neuron MacD is a MACD you can read at a glance instead of squinting at. The histogram is split into four colours — not two — so each bar tells you which side of zero it sits on and whether it is still growing or already shrinking. The MACD line changes colour the moment it crosses its signal, a dot marks every cross on the signal line itself, and the whole calculation can be pulled from a higher timeframe while you trade a lower one. It is an indicator for chart analysis only: it draws on the chart, it does not place, modify or close trades, it does not send orders, and it does not manage positions or accounts.

A panel on the price chart carries the state, the histogram and the MACD as live meters, so the reading is available without looking away from price. Native MQL5, no DLLs, closed bars are final, and it runs on forex, gold and metals, indices and crypto across any timeframe.

=== HOW IT WORKS ===

The core is the classic MACD: a fast exponential average minus a slow one, with a signal line and a histogram of the distance between them. Two details matter and are easy to get wrong. The signal here is a simple moving average of the MACD, not an exponential one, which is what the original rendering of this indicator uses and what gives the crosses their particular timing. And the histogram is the MACD minus that signal, so it is a measure of separation, not of the MACD itself.

The four histogram colours come from two questions asked together. Is the bar above or below zero, and is it taller or shorter than the bar before it? Above zero and growing means momentum is extending in favour of buyers. Above zero and shrinking means buyers are still ahead but losing ground — the warning that arrives while the histogram is still positive. Below zero the same pair reads for sellers. One colour, two facts, no second glance.

The MACD line is coloured by its position against the signal, so trend agreement is legible without tracing which line is on top, and a dot is printed on the signal line at every cross. Because the dot sits on the signal rather than floating above the pane, it marks the exact level the cross happened at.

Multi-timeframe is a first-class feature, not an afterthought. Leave the resolution on the chart's own and it behaves as a normal MACD. Point it at a higher timeframe and the entire calculation — both averages, the signal and the histogram — is computed on that timeframe's closes and mapped back onto your chart, so you can watch the four-hour picture while working a five-minute chart. The timeframe in use is printed on the panel so a borrowed reading is never mistaken for the chart's own.

=== WHAT IS INCLUDED ===

Module What it does
Four-colour histogram Above zero growing, above zero shrinking, below zero growing, below zero shrinking — each with its own colour, so a stalling move is visible before it turns.
Colour-changing MACD line The line itself carries the signal relationship, switching colour the bar the cross happens.
Cross dots A dot on the signal line at every MacD/signal cross, marking the exact level rather than a generic marker floating in the pane.
Multi-timeframe engine Run the whole calculation on any timeframe from any chart. The panel shows which timeframe is feeding the reading.
State & duration BULLISH or BEARISH with the number of bars held since the last cross — a six-bar-old cross and a sixty-bar-old trend stop looking alike.
Histogram meter The current histogram scaled against the last hundred bars, tagged fade the moment it stops growing, so strength is read in context instead of as a raw number.
MACD meter Distance from the zero line, scaled the same way, with the header naming which side of zero the MACD is on.
Signal panel The Neuron panel on the price chart, one of nine anchors, scalable from 70% to 250% for any screen. Reads closed bars only.
Light & dark themes Two tuned palettes, not one palette dimmed. A sun/moon icon in the panel header switches between them live.
Alerts Signal cross and zero-line cross, each switchable on its own, by terminal popup, phone push notification or email. Evaluated on closed bars, once per bar.
Display switches Histogram, lines and dots can each be turned off, and both colour schemes can be reduced to a single colour, so the pane shows only what you use.
EA buffers The raw MACD and signal are exposed as plain numeric buffers that stay filled whatever the display switches are set to, readable with a single CopyBuffer call.

=== HOW TO READ IT ===

Start with the histogram colour, not its height. A bright bar above zero is buyers extending; a dark bar above zero is the same buyers running out of push while still ahead. That change of shade is the earliest thing the indicator gives you, and it arrives well before the histogram crosses zero or the lines cross each other.

The MACD line colour confirms it. While the line holds its bullish colour the fast average is still above the signal, and a run of darkening histogram bars under a still-bullish line is a move losing steam rather than reversing. When the dot prints, the relationship has actually changed, and the panel's bar count restarts from there.

Use the zero line for context rather than for signals. A bullish cross that happens below zero is a counter-trend bounce inside a weak market; the same cross above zero is a pullback ending inside a strong one. The panel names the side explicitly so you do not have to judge it by eye on a compressed pane.

In multi-timeframe mode, read the panel's timeframe chip first. A higher-timeframe MACD holds one value across all the chart bars inside each of its own bars, so the line steps rather than curves and the histogram bars repeat — that is the higher timeframe speaking, not a fault.

=== INPUTS ===

Setting Default What it does
Timeframe
Use current chart resolution true Calculate on the chart's own timeframe. Uncheck to borrow another one.
Different timeframe H1 The timeframe to calculate on when the box above is unchecked.
Calculation
Fast EMA length 12 The faster of the two exponential averages.
Slow EMA length 26 The slower average. Must be larger than the fast one.
Signal SMA length 9 Simple moving average of the MACD, giving the signal line.
History bars to process 5000 How far back to calculate and draw. 0 processes all available history.
Display
Show MacD and signal line true Draw the two lines. Off leaves the histogram alone in the pane.
Show dots when MacD crosses signal true Print a dot on the signal line at every cross.
Show histogram true Draw the histogram.
Change MacD line colour on signal cross true Colour the line by its position against the signal. Off draws it in a single colour.
MacD histogram 4 colours true Off reduces the histogram to one neutral colour.
Dashboard
Show dashboard true Show the state, histogram and MACD panel on the price chart.
Dashboard position Bottom Left One of nine chart anchors.
Dark mode true Initial theme; the sun/moon icon in the header toggles it live.
Dashboard size % 100 70 to 250. Scales the whole panel — text, meters and padding together — for 4K screens or small laptops.
Alerts
Alert on MacD / signal cross true Fire on the bar the lines cross, naming the direction.
Alert on MacD zero-line cross false Fire when the MACD changes side of zero.
Terminal popup alert true Popup in the terminal.
Push notification to phone false Mirror alerts to the MetaTrader app.
Email alert false Mirror alerts to the email configured in the terminal.
Colours
Histogram: above zero, rising / falling Aqua / Blue Momentum extending, then fading, above the zero line.
Histogram: below zero, falling / rising Red / Maroon Momentum extending, then fading, below the zero line.
Histogram: unchanged Yellow A bar identical to the one before it, which is common in multi-timeframe mode.
Histogram: single-colour mode Gray Used when the four-colour switch is off.
MacD line above / below signal Lime / Red The two line colours, also used for the cross dots.
Signal line Yellow The signal line colour.
Zero line White The solid level through the middle of the pane.
Cross dot symbol 159 Wingdings character code for the cross marker.

Fixed internals, not exposed as inputs: both averages are seeded from the first available bar, the signal is a simple average of the MACD, the panel meters scale against the last hundred bars, and higher-timeframe data is read up to twenty thousand bars back.

=== GOOD TO KNOW ===

  • Closed bars are final — on the chart's own timeframe, a bar's value, colour and dot are fixed once it closes and are never redrawn. The forming bar updates live as price moves, exactly as on any oscillator, so read signals from the close if you want confirmed readings only. The panel ignores the forming bar entirely.
  • Multi-timeframe behaves like every MTF tool — while a higher-timeframe bar is still forming, its value moves, and the chart bars inside it hold whatever it read as they closed. Reloading the chart recalculates them from the completed higher-timeframe bar, so a reloaded chart can differ from what you watched live. This is inherent to reading one timeframe on another, and the panel names the timeframe so it is never a surprise.
  • Indicator, not an EA — Neuron MacD analyses and draws. It does not place, modify or close orders, and it makes no forecast of price. The decision, the risk and the sizing are yours.
  • Alerts behave — each event is evaluated once per closed bar and never fires twice for the same bar, loading history never produces a burst of stale alerts, and everything is muted inside the Strategy Tester and during optimization.
  • For EA developers — buffer 0 is the histogram, 2 the MACD line, 4 the signal, and buffers 7 and 8 carry the raw MACD and signal. The raw pair stays filled no matter which display switches are off, so an EA is never starved by a cosmetic setting. All are readable with iCustom and CopyBuffer.
  • Platform — MetaTrader 5, any symbol and any timeframe. The oscillator plots in its own sub-window; the panel is drawn through the built-in Canvas on the price chart. No DLLs, no file access, no network calls.
  • Light & dark — one click re-themes the panel, each mode with its own palette rather than a dimmed copy of the other. Every plot colour is a separate input, so the pane can be matched to any chart scheme.
추천 제품
TriYep Indicador
Miguel Jose Yepez
Indicador TriYep v1.02 – Más del 70% de señales precisas Indicador TriYep v1.02 – Más del 70% de señales precisas Presentación El indicador TriYep v1.02 se creó con un único propósito: ofrecer señales totalmente fiables. Esta versión gratuita está calibrada y optimizada específicamente para el par USD/JPY en el marco temporal M15 , donde su lógica alcanza su máximo rendimiento. Mientras que otros indicadores inundan tu gráfico con señales falsas y te hacen perder operación tras operación, hemos
FREE
Trend Quorum MT5
Kestutis Balciunas
5 (2)
Trend Quorum   은 동적 SuperTrend 엔진과 독자적인 트렌드 품질 지수(TQI) 및 3가지 선택적 컨플루언스 필터를 결합한 적응형 추세 추종 지표입니다. 충분한 수의 독립적인 요소들이 일치하여 "투표"할 때만 신호가 발동됩니다——마치 정족수처럼. MT5 버전 보기:  Trend Quorum MT5 더 많은 제품 보기:   전체 제 품 목록 라이브 예시와 새로운 도구를 확인하시려면 프로필을 방문하시고 업데이트를 놓치지 않도록 친구 요청을 보내주세요! 작동 원리 적응형 SuperTrend 엔진 고정 ATR 승수를 사용하는 표준 SuperTrend 지표와 달리, Trend Quorum은 트렌드 품질 지수(TQI)를 사용하여 실시간으로 밴드 폭을 동적으로 조절합니다. TQI는 4가지 가중 요소로부터 계산된 0에서 1까지의 연속 점수입니다: 효율성 비율   — 방향성 움직임의 순수도를 측정합니다(가격 움직임 중 방향성 성분 대 노이즈의 비율) 변동성 체제   — 확장 또는
FREE
Panel Indicator For MT5 Panel Indicator For MT5는 MetaTrader 5를 위해 설계된 시각적 인디케이터로, 스프레드와 시장 세션에 관한 모든 핵심 정보를 하나의 간결한 패널에 통합합니다. 차트 위에 직접 표시되어 추가 창을 열거나 외부 소스를 참조할 필요 없이 실시간으로 업데이트되는 정보를 트레이더에게 즉각적으로 제공합니다. 실시간 스프레드 모니터링 패널은 차트에 로드된 종목의 현재 스프레드 값을 지속적으로 표시합니다. 순간 값과 함께 인디케이터는 활성 세션 동안 누적된 평균 스프레드와 동일한 시간대에 기록된 최대값을 자동으로 계산합니다. 세션이 바뀌는 즉시 카운터가 초기화되고 계산이 새로 시작되어, 항상 현재 운영 상황에 관련된 통계를 보장합니다. 스프레드 값은 색상으로 구분됩니다. 녹색은 계산된 평균 대비 정상 범위 내의 스프레드를 나타내고, 노란색은 약간 높은 스프레드를 알리며, 빨간색은 비정상적이거나 범위를 벗어난 스프레드를 강조합니다.
FREE
Stamina HUD
Michele Todesco
STAMINA HUD – Advanced Market & Trend Dashboard (MT5) STAMINA HUD   is a professional   market information panel   designed for traders who want   clarity, speed, and control   directly on the chart. It provides a   clean heads-up display (HUD)   with essential market data and   multi-timeframe trend direction , without cluttering the chart or generating trading signals. What STAMINA HUD Shows   Current Price   Spread (in real pips)   Today High–Low range (pips)   Average D
FREE
Friend of the trend
Anderson De Assis
Friend of the Trend: Your Trend Tracker Master the market with Friend of the Trend , the indicator that simplifies trend analysis and helps you identify the best moments to buy, sell, or wait. With an intuitive and visually striking design, Friend of the Trend analyzes price movements and delivers signals through a colorful histogram: Green Bars : Signal an uptrend, indicating buying opportunities. Red Bars : Alert to a downtrend, suggesting potential selling points. Orange Bars : Represent cons
FREE
VFI Quantum
Nikita Berdnikov
5 (1)
Introducing VFI (Volume Flow Indicator) – a trading indicator that analyzes the relationship between volume and price movement to identify key trading opportunities. The indicator displays the strength and direction of volume flow, providing clear signals about potential entry and exit points. Signals are formed based on zero line crossovers, crossovers between the VFI line and its exponential moving average (EMA), and when the indicator exits overbought and oversold zones. Attention! This stra
FREE
The CV MACD Indicator is a modern and professional momentum indicator designed to analyze trend strength, market direction and potential reversals. By combining the MACD line, signal line and histogram, the indicator helps traders identify market momentum and high-quality trading opportunities with clarity and precision. Features: Precise MACD momentum analysis Early trend reversal detection Clear histogram for market strength visualization Adjustable Fast, Slow and Signal periods Visual Buy & S
FREE
SuperTrend for MT5
Ulises Calderon Bautista
4.44 (9)
인기 있는 "슈퍼트렌드" 지표는 테크니컬 분석 도구로, 금융 시장에서의 트렌드 방향과 가능한 진입 또는 청산 지점을 식별하는 데 도움을 줍니다. 이 지표는 평균 실 범위 (ATR)를 기반으로 하며, 이는 가격 범위를 기반으로 시장 변동성을 측정합니다. 다른 플랫폼에서는 무료로 제공되며, 여기서도 마찬가지입니다! 일반적으로 세 가지 방법으로 사용됩니다: 현재 트렌드 식별: 가격이 이 라인 위에 있는 경우 상승 트렌드로 간주되며, 가격이 이 라인 아래에 있는 경우 하락 트렌드로 간주됩니다. 손실 제한 수준으로 사용됩니다. 동적 지지/저항으로: 상승 트렌드에서 이 라인은 가격 아래에 위치하며 동적 지지 수준으로 작용합니다. 하락 트렌드에서는 이 라인이 가격 위에 위치하며 동적 저항 수준으로 작용합니다.
FREE
Basic Theme Builder MT5
Mehran Sepah Mansoor
5 (2)
Basic Theme Builder: 차트 맞춤화를 간편하게 Basic Theme Builder 지표로 거래 경험을 혁신하세요. 이 다용도 도구는 MetaTrader 5 에서 차트의 외관을 간편하게 사용자 맞춤화할 수 있도록 설계된 직관적인 패널을 제공합니다. 다양한 테마와 색상 스킴을 간단히 전환하여 거래 환경의 시각적 매력과 기능성을 향상시킬 수 있습니다. Free MT4 version Basic Theme Builder 지표는 MetaTrader 5 차트를 손쉽게 개인화하려는 거래자에게 최적의 도구입니다. 간단한 패널 인터페이스와 다양한 테마 프리셋을 통해 거래 스타일이나 기분에 맞게 차트의 외관을 빠르게 조정할 수 있습니다. 클래식한 룩부터 현대적인 미학까지, Basic Theme Builder는 시각적 경험을 향상시키고 집중력을 높이는 데 도움이 되는 다양한 옵션을 제공합니다. 오늘 이 실용적이고 사용하기 쉬운 지표로 거래 환경을 최적화하세요. 주요 기능: 간편한 테마 관
FREE
Line Master
Ahmad Bin Fawzi Bin Al-akhdar Al-fazai
Line Master – Trend Lines & Direction Arrows Line Master is a professional trend indicator for MetaTrader 5. It helps traders identify market direction by combining fast and slow trend lines and generating arrows at trend change points. Features: Slow Trend Line: Represents the overall market trend. Fast Trend Line: Responds quickly to short-term price changes. Color-Coded Lines: Uptrend: DodgerBlue Downtrend: Crimson Trend Arrows: Signals appear when the trend changes. Adjustable Inputs: Fast l
FREE
As traders, we all know that risk management is the most important aspect of profitable trading. So, we need to determine the lot size, every time we need to open a new trade. The FX lot size calculator is a simple tool that will help you to determine your lot size easily without using any third-party service but you will be able to do that by your MetaTrader terminal. LIMITED TIME OFFER: 30$ FOR 10 ACTIVATION. Inputs: Maximum_Risk_Prc: To determine your preferred risk%. For example, if your ris
FREE
Market Time
Kaan Caliskan
3 (1)
MarketTime - 전문 다중 시간대 시계 및 세션 지표 다시는 거래 세션을 놓치지 마세요 - 글로벌 시장 시간을 실시간으로 모니터링 MarketTime은 MetaTrader 5 차트에 여러 시간대, 라이브 세션 카운트다운 및 시각적 거래 세션 영역을 직접 표시하는 전문가급 지표입니다. 외환 거래에서 타이밍이 전부입니다 - 주요 금융 센터가 언제 활성화되고 세션이 언제 겹치는지 아는 것은 거래 성공에 크게 영향을 미칠 수 있습니다. 이 포괄적인 도구는 여러 브라우저 탭이나 외부 애플리케이션의 필요성을 제거합니다. 글로벌 시장 시간을 모니터링하는 데 필요한 모든 것이 차트에 바로 있으며, 작업 공간을 어지럽히지 않는 깔끔하고 사용자 정의 가능한 인터페이스로 실시간 업데이트됩니다. 자세히 보기: 전체 문서 및 설정 가이드 (English) 한정 제공: 첫 50개 다운로드는 무료입니다! 그 후 이 제품은 유료가 됩니다. 지금 다운로드하여 무료 사본을 확보하세요. 주요 기능 다중 시간대
FREE
DC Indicator
Lamont Simone Reynecke
The donchian channel indicator might just be the best fit for you Trading in derivative products such as futures, options, CFD's, forex and certificates contains significant risk. These products are not suitable for every investor. Investors could potentially lose all or more than the original investment. If anything, only money equal to personal risk capital should be used and can be lost without jeopardizing financial security or lifestyle. Partially or fully automated trading programs can
FREE
Have you ever wondered which currency is the strongest at any particular time? Or which currency pair is trending the most. Well, the currency strength meter helps with just that.  It compares  USD ,  EUR ,  AUD ,  CHF ,  GBP ,  CAD  and  NZD  depending on the timeline you have chosen in settings, and ranks them on the number of pips each has moved compared to the rest. N/B: All currency charts of the above pairs must have loaded. You can do this by highlighting all major and minor currencies in
FREE
Lot Calculator MT5
Ibrahim Olalekan Ganiu
메타트레이더에서 바로 랏사이즈를 계산하세요!!! 안녕하세요, 트레이더 여러분. 위험 관리에 중점을 두시는 트레이더이신가요? 그렇다면 바로 이 기능이 도움이 될 것입니다. 저는 이브라힘입니다. 계좌 잔액 대비 위험 비율을 기반으로 랏사이즈를 계산하는 도구를 개발했습니다. 위험 비율을 %로 지정하는 대신 절대값을 지정하여 랏사이즈를 계산할 수도 있습니다. 예를 들어, 잔액에서 $100를 위험에 빠뜨리고 싶다고 지정할 수 있습니다. MT4 버전: https://www.mql5.com/en/market/product/155026 무료입니다. 꼭 확인해 보세요. 댓글로 추가했으면 하는 기능이나 커뮤니티를 위해 개발했으면 하는 다음 도구에 대한 의견을 남겨주세요. 즐거운 트레이딩, 즐거운 자동화 되세요!!!
FREE
Strifor Lot Calculator — MetaTrader 5용 인디케이터로, 트레이더가 설정한 리스크와 스톱로스 기반으로 최적의 로트 크기를 계산할 수 있습니다. 더 의식적인 거래, 리스크 관리, 수동 계산 시간 절약에 유용합니다. 장점 정확한 리스크 관리 — 선택한 리스크 비율에 따라 로트 크기 자동 계산 두 가지 모드 — 수동 입력 또는 차트 라인 기반 계산 인기 상품 지원 — 통화쌍, 금(XAUUSD), 원유(USOIL/WTI), 지수(US500 등) 차트에서 빠른 시각적 거래 계획 실제 계좌 잔액 기반 로트 계산 입력 파라미터 Deposit — 수동 입금액 (또는 0 = 현재 계좌 잔액 사용) RiskPercent — 거래당 리스크 (%) StopLossPips — 스톱로스 (수동 모드만) Mode — true = 수동 모드, false = 라인 모드 작동 모드 수동 모드 Deposit, Risk, Stop-Loss 입력 → 최적 로트 계산 라인 모드 차트에 수평선
FREE
Enhanced Volume Profile: The Ultimate Order Flow & Liquidity Analysis Tool Overview Enhanced Volume Profile is an indicator for MetaTrader 5 that displays the traded volume at specific price levels over a defined period. It separates the total volume into buy and sell components, presenting them as a side-by-side histogram on the chart. This allows users to observe the volume distribution and the proportion of buy and sell volumes at each price level. Graphics Rendering The indicator uses the
FREE
Price Momentum
Flavio Javier Jarabeck
4.92 (12)
Value Chart indicator presents the Price evolution in a new form. This indicator, Price Momentum , was developed taking all the calculations presented in the book " Dynamic Trading Indicators " by Mark W. Helweg and David Stendahl (2002). The technique involves de-trended Prices from a user-defined Period of analysis and the addition of a Volatility index correction. The result is an Oscillator with 3 zones: Fair Price Value, Overbought/Oversold and Extremely Overbought/Oversold zones. Adding th
FREE
Calmer chart context, kept practical Northstar Flow Candles MT5 is a chart-window indicator that presents Heikin Ashi candles with a five-state trend context. It is designed for traders who want a quieter view of price while keeping the native chart available as an optional reference. Visual-only indicator: Northstar Flow Candles MT5 does not place trades and does not send popup, push, or email notifications. What appears on the chart Five candle states: strong bullish, bullish, balanced, bearis
FREE
Ultimate MACD MTF Pro 는 고전적인 MACD의 강력한 업그레이드 버전으로, 현대 트레이딩을 위해 재설계되었습니다. 이 지표는 멀티 타임프레임(MTF) MACD, 다이내믹 히스토그램 색상, 신호 교차 마커, 모멘텀 기반의 스마트 라인 색상 변경 기능을 제공합니다. 깔끔한 신호, 조기 추세 감지 및 전문적인 시각적 명확성을 원하는 트레이더를 위해 제작되었습니다. 주요 기능 멀티 타임프레임 MACD (MTF) 현재 차트 타임프레임 또는 상위 타임프레임(H1, H4, D1 등) 간에 쉽게 전환할 수 있습니다. 탑다운(Top-down) 추세 확인에 매우 적합합니다. 깔끔한 MACD 및 신호선 – 라인 두께 조절 가능 – MACD가 신호선을 교차할 때 자동 색상 변경 – 부드럽고 시각적으로 명확한 디자인 5가지 색상 스마트 히스토그램 히스토그램은 다음 조건에 따라 5가지 색상으로 변경됩니다: 모멘텀 증가 모멘텀 감소 0선 위 또는 아래 추세 전
FREE
Automatic Trendlines
Pasi Hakamaki
4.68 (50)
The indicator draws trendlines on chart. This indicator has six inputs. User can specify alternative labels for both lines. If multiple instances of the indicator are used, the labels must differ. User can set width and color of the lines and depth which specifies what significant peaks should be used. For example, Depth=10 sets trendlines using the current peaks and valleys that have at least 10 bars to the right and to the left and that have highs/lows less/greater than the peak's high/low. In
FREE
The idea behind this indicator is to find all currency pairs that are over-bought or over-sold according to the RSI indicator at one go. The RSI uses the default period of 14 (this can be changed in the settings) and scans all symbols to find the RSI level you will have specified. Once currency pairs that meet the specification are found, the indicator will open those charts for you incase those charts aren't open and proceed to write the full list of currencies on the experts tab.
FREE
LT Donchian Channel
Thiago Duarte
4.86 (7)
Donchian Channel is an indicator created by Richard Donchian. It is formed by taking the highest high and the lowest low of the last specified period in candles. The area between high and low is the channel for the chosen period. Its configuration is simple. It is possible to have the average between the upper and lower lines, plus you have alerts when price hits one side. If you have any questions or find any bugs, please contact me. Enjoy!
FREE
Live Sup Res MT5
Claudia Ramona Angerer
4.89 (9)
Identification of support and resistance areas A useful indicator for traders completely free Can be used in all symbols Can be used in all time frames It has three different trends: short term, medium term, long term Settings: Clr1,2: You can change the color of the lines Type Trend: You can determine the trend Message me for questions, criticism and suggestions
FREE
Kiwi Multi Pairs Indicator MT5 v1.01 Kiwi Multi Pairs Indicator MT5 is a multi-market and multi-timeframe confirmation dashboard for MetaTrader 5. Instead of opening many charts and checking indicators individually, Kiwi Multi Pairs Indicator brings 9 markets, 5 technical indicators and 7 timeframes together in one easy-to-read dashboard. The indicator is designed to help traders quickly identify bullish, bearish and mixed market conditions and compare confirmation across different symbols and t
FREE
TradeVision Pro
Ian Nganga Comba
TradeVisonPro Forex Analyzer Pro MT5 거래 계좌 분석 및 모니터링 대시보드 TradeVisonPro Forex Analyzer Pro는 MetaTrader 5 사용자를 위해 설계된 거래 분석 및 계좌 모니터링 솔루션입니다. 본 제품은 MT5 거래 데이터를 구조화된 웹 기반 대시보드에 정리하여 사용자가 계좌 정보를 확인하고, 오픈 포지션을 모니터링하고, 거래 내역을 분석하고, 전략을 추적하고, 거래 일지를 작성하고, 성과 통계를 검토할 수 있도록 합니다. TradeVisonPro Forex Analyzer Pro는 거래 정보를 체계적으로 관리하고 지원되는 데스크톱 및 모바일 웹 브라우저를 통해 접근할 수 있도록 설계되었습니다. 주요 기능 • MT5 계좌 대시보드 • 오픈 포지션 모니터링 • 거래 내역 분석 • 거래 캘린더 • 전략 추적 • 거래 일지 • 계좌 성과 통계 • 성과 보고서 • 거래 알림 • 다중 계좌 지원 • 공유 가능한 읽기 전용 보고서 MT
FREE
Session Range Boxes
Krzysztof Karleszko
1. What Is SessionsScope? SessionsScope is a professional trading indicator for MetaTrader 5 that maps every major trading session directly onto your chart — and tells you, at a glance, exactly where each session started, ended, and how far price moved inside it. Every day the forex market moves through four distinct windows: Asia, Frankfurt, London, and New York. Each session has its own character, its own range, and its own relationship to the sessions that came before it. The high of the A
FREE
Key Price Levels MT5
Wafa Mohammed Omar Abou Alwafa
5 (3)
Key Price Levels Indicator Indicator that shows the highs and lows for the significant price levels for past periods that could be potentially considered as reaction levels. The indicator displays the following price levels: Yesterday high and low The day before yesterday high and low Two days back high and low Last week high and low Last month high and low Last three month high and low (Quarter) Last year high and low
FREE
Rainbow MT5
Jamal El Alama
4 (1)
Description : Rainbow MT5 is a technical indicator based on Moving Average with period 34 and very easy to use. When price crosses above MA and MA changes color to green, then this is a signal to buy. When price crosses below MA and MA changes color to red, then this is a signal to sell. The Expert advisor ( Rainbow EA MT5 ) based on Rainbow MT5 indicator is now available here . MT4 version is available here .
FREE
Double Correlation indicator (free) plots two windowed correlations in a separate window.  the size of window is taken as input before the two symbols to correlate to. Two symbols are taken as an input parameters as well as period length. and the two correlations are computed with the currently shown symbol ex: input GBPJPY and AUDNZD.  current symbol EURUSD then the following will be computed corr(EURUSD,GBPJPY) and corr(EURUSD,AUDNZD) The indicator can be useful to run a multi-symbol pair trad
FREE
이 제품의 구매자들이 또한 구매함
이 제품은 2026년 시장에 맞게 업데이트되었으며 최신 MT5 빌드에 최적화되었습니다. 가격 업데이트 안내: Smart Trend Trading System은 현재 $99 에 제공됩니다. 다음 30회 구매 후 가격은 $199 로 인상됩니다. 특별 혜택: Smart Trend Trading System 구매 후 저에게 개인 메시지를 보내시면 Smart Universal EA를 무료 로 받을 수 있으며, Smart Trend 신호를 자동 거래로 전환할 수 있습니다. Smart Trend Trading System은 리페인트 없음, 재그리기 없음, 지연 없음의 완전한 트레이딩 시스템으로, 더 깨끗한 신호, 더 나은 추세 방향, 그리고 더 체계적인 시장 거래 방식을 원하는 트레이더를 위해 제작되었습니다.   [User Manual]   ,  [PDF]  ,   [Installation manual]   and  [Online course] 이 시스템은 추세 감지, 반전 구간, Smart
Trend Sniper X
Sarvarbek Abduvoxobov
5 (11)
Trend Sniper X 는 MetaTrader 5용 멀티 타임프레임 추세 추종 지표로, 트레이더가 추세 방향과 잠재적 반전 지점을 명확하고 정확하게 식별하도록 돕습니다. 가격 정보: 현재 가격은 프로모션 가격이며, 향후 업데이트 및 새로운 기능 출시 시 변경될 수 있습니다. Code2Profit 채널 멀티 타임프레임 분석으로 시장을 마스터하세요! Trend Sniper X로 승률을 극대화하는 방법: 핵심 규칙 및 세션 팁 기술 사양 플랫폼 MetaTrader 5 지표 유형 멀티 타임프레임 추세 지표 운용 타임프레임 모든 차트 타임프레임 지원, 독립적으로 선택 가능한 상위 타임프레임(M1–MN1) 주요 상품 외환, 금(XAUUSD) 및 기타 CFD 권장 계좌 모든 계좌 유형 시각화 색상별 추세 캔들(매수/매도/약세/변경) + 매수/매도 화살표 추가 모듈 세션 시장 박스(시드니, 도쿄, 런던, 뉴욕) 주요 기능 멀티 타임프레임 추세 분석: 상위 타임프레임의 추세 방향을 현재 차트에
Welcome to ENTRY IN THE ZONE AND SMC MULTI TIMEFRAME Entry In The Zone and SMC Multi Timeframe is a real-time market analysis tool based on Smart Money Concepts (SMC), designed to analyze market structure, price direction, and key trading zones. It supports both Single-Timeframe Analysis and Multi-Timeframe Analysis, providing a clearer view of the overall market structure across multiple timeframes, with real-time BUY / SELL signals that do not repaint. It is designed to help filter trading opp
SMC Intraday Formula
Kareem Abbas
5 (22)
먼저 솔직하게 말하겠습니다. 어떤 인디케이터도 단독으로 당신을 수익성 있게 만들어주지 않습니다. 누군가 그렇게 말한다면, 그는 당신에게 꿈을 파는 것입니다. 완벽한 매수/매도 화살표를 보여주는 모든 인디케이터는 완벽하게 보이도록 만들 수 있습니다 — 단지 올바른 과거 구간을 확대하고 승리한 거래만 캡처하면 됩니다. 우리는 그렇게 하지 않습니다.  SMC Intraday Formula는 도구입니다. 시장 구조를 읽고, 가장 높은 확률의 가격 구간을 표시하며, 현재 스마트 머니의 흐름이 어떻게 보이는지 아주 단순한 언어로 보여줍니다. 최종 결정은 여전히 당신이 합니다. 실행도 당신이 합니다. 하지만 이제는 희망이 아니라 정확성으로 거래하게 됩니다. 우리는 이 인디케이터를 지난 약 3년 동안 골드(XAUUSD) 및 주요 외환 통화쌍의 데이 트레이딩 스캘핑에 사용해 왔습니다. M1, M5, M15, M30에서 우리의 핵심 도구입니다. 이 도구는 미래를 예측하려 하지 않습니다 — 지금 형성
SuperScalp Pro
Van Minh Nguyen
4.63 (32)
SuperScalp Pro – 전문 멀티 레이어 컨플루언스 스캘핑 시스템 SuperScalp Pro 는 다중 컨플루언스를 기반으로 한 전문 스캘핑 시스템으로, 트레이더가 더 높은 확률의 매매 기회를 식별할 수 있도록 설계되었습니다. 명확한 진입 신호 확인, ATR 기반 손절(Stop Loss) 및 목표가(Take Profit), 그리고 XAUUSD, BTCUSD 및 주요 외환 통화쌍에 대한 유연한 신호 필터링 기능을 제공합니다. 전체 문서는 제품 블로그에서 확인할 수 있습니다: [User Guide] SuperScalp Pro Auto Trader EA를 통해 자동 매매를 지원합니다:   [Auto Trader] 제품 업데이트, 뉴스 및 공지사항을 확인하려면 SuperScalp Pro 공식 MQL5 채널을 팔로우하세요: [Official Channel] SuperScalp Pro 는 Supertrend, VWAP, EMA, RSI, ADX, 거래량 분석, 볼린저 밴드 및 MAC
Neuro Poseidon MT5
Daria Rezueva
4.85 (54)
Neuro Poseidon is a new indicator by Daria Rezueva. It combines precise trading signals with adaptive TP/SL levels - creating best possible trades as a result! Message me and get  Neuro Poseidon Assistant  as a gift to automize your trading process! What makes it stand out? 1. Proven profitability on all assets and timeframes 2. Only confirmed BUY and SELL signals present on the chart 3. Adaptive TP & SL levels generated by the software for each trade 4. Easy to understand - suitable for al
Divergence Bomber
Ihor Otkydach
4.89 (94)
가끔은 제가 직접 이 시스템을 이용해 거래를 하곤 합니다. 실계좌에서 제가 직접 수행하는 BOMBER 트레이딩을 확인해 보세요 - LIVE SIGNAL 이 지표를 구매하신 분께는 다음과 같은 혜택이 무료로 제공됩니다: 각 거래를 자동으로 관리하고, 손절/익절 수준을 설정하며, 전략 규칙에 따라 거래를 종료하는 전용 도우미 툴 "Bomber Utility" 다양한 자산에 맞게 지표를 설정할 수 있는 셋업 파일(Set Files) "최소 위험", "균형 잡힌 위험", "관망 전략" 모드로 설정 가능한 Bomber Utility의 셋업 파일 이 전략을 빠르게 설치, 설정, 시작할 수 있도록 돕는 단계별 영상 매뉴얼 주의: 위의 모든 보너스를 받기 위해서는 MQL5 개인 메시지 시스템을 통해 판매자에게 연락해 주세요. 독창적인 커스텀 지표인 “Divergence Bomber(다이버전스 봄버)”를 소개합니다. 이 지표는 MACD 다이버전스(괴리) 전략을 기반으로 한 올인원(All-in-On
Atomic Analyst MT5
Issam Kassas
4.44 (54)
이 제품은 2026년 시장에 맞게 업데이트되었으며 최신 MT5 빌드에 최적화되었습니다. 가격 업데이트 안내: Atomic Analyst는 현재 $99 에 제공됩니다. 다음 30회 구매 후 가격은 $199 로 인상됩니다. 특별 혜택: Atomic Analyst 구매 후 저에게 개인 메시지를 보내시면 Smart Universal EA를 무료 로 받을 수 있으며, Atomic Analyst 신호를 자동 거래로 전환할 수 있습니다. Atomic Analyst는 리페인트 없음, 재그리기 없음, 지연 없음의 Price Action 거래 인디케이터로, 수동 거래, 신호 명확성, EA 자동화를 위해 설계되었습니다. User manual: settings, inputs and strategy.   &   User Manual PDF . 가격 움직임, 강도, 모멘텀, 다중 시간대 방향 및 고급 필터를 분석하여 트레이더가 노이즈를 줄이고 약한 세팅을 피하며 더 체계적인 거래 결정을 내릴 수 있도록
Entry Points Pro for MT5
Yury Orlov
4.51 (148)
전설이 돌아왔습니다: Entry Points Pro 10. MQL5 마켓 Top-3 자리를 3년간 지켜온 전설적인 지표의 재출시입니다. 수백 개의 호평 리뷰(두 버전 합산 589개), 매일 이 지표로 거래하는 수천 명의 트레이더, 31,000회 이상의 데모 다운로드   MT4+MT5 . 지난 5년간 여러분이 남긴 리뷰를 하나도 빠짐없이 읽었고, 약속 대신 그 답을 버전 10에 담았습니다. 1999년부터 시장에서 활동하며 정직함과 자신의 평판, 그리고 고객을 소중히 여기는 개발자가 만들었습니다. Entry Points Pro의 진입 시그널은 절대 리페인팅되지 않습니다. 그리고 이번에는 개발자의 말뿐이 아니라 검증 가능한 사실입니다: 확정 시그널은 캔들 종가에서만 표시되며, 자동화 테스트에서 리페인팅 0건 이 확인되었습니다(EURUSD, XAUUSD, BTCUSD에서 2,486,568회의 불변조건 검사 — 위반 0건). 검증 방법은 공개되어 있으니 전략 테스터에서 직접 재현해 보실 수
M1 Sniper MT5
Oleg Rodin
5 (6)
M1 SNIPER 는 사용하기 쉬운 거래 지표 시스템입니다. M1 시간대에 맞춰 설계된 화살표 지표입니다. 이 지표는 M1 시간대 스캘핑을 위한 단독 시스템으로 사용할 수 있으며, 기존 거래 시스템의 일부로도 사용할 수 있습니다. 이 거래 시스템은 M1 시간대 거래용으로 특별히 설계되었지만, 다른 시간대에도 사용할 수 있습니다. 원래는 XAUUSD와 BTCUSD 거래를 위해 이 방법을 설계했지만, 다른 시장 거래에도 유용하다는 것을 알게 되었습니다. 이 지표의 신호는 추세 방향과 반대로 거래될 수 있습니다. 저는 지표의 신호를 활용하여 양방향으로 거래할 수 있도록 돕는 특별한 거래 기법을 알려드립니다. 이 방법은 특별한 동적 지지선과 저항선 가격 영역을 활용하는 것을 기반으로 합니다. 구매하시면 M1 SNIPER 화살표 지표를 바로 다운로드하실 수 있습니다. 또한, 아래 스크린샷에 표시된 Apollo Dynamic SR 지표는 M1 SNIPER 도구를 사용하는 모든 사용자에게 무료로
Zoryk Gold
Reda El Koutbane
5 (6)
ZORYK — MetaTrader 5용 XAUUSD 전문 신호 및 트레이드 플래닝 시스템 이런 경험이 있을 것입니다. 골드를 분석하고 진입을 기다린 뒤 마침내 포지션을 열었지만 가격이 곧바로 반대 방향으로 움직입니다. 너무 일찍 청산하거나 Stop Loss를 옮기거나 몇 초 동안 망설입니다. 그 후 시장은 내가 없이도 처음 예상했던 목표까지 정확히 움직입니다. 문제는 항상 방향이 아니었습니다. 진짜 문제는 불확실성이었습니다. 정확한 진입 위치를 몰랐습니다. 어느 지점에서 원래의 트레이드 아이디어가 무효가 되는지 몰랐습니다. 가까운 수익을 확보해야 할지 더 큰 움직임을 기다려야 할지 판단하기 어려웠습니다. 현재 setup이 정말 강한지 아니면 단지 새로운 거래를 억지로 찾고 있는지도 확신하기 어려웠습니다. 골드는 매우 빠르게 움직입니다. 명확한 계획이 없다면 좋은 분석도 몇 초 만에 나쁜 결정으로 바뀔 수 있습니다. ZORYK는 이 문제를 해결하기 위해 개발되었습니다.
GoldenX Entry MT5
Kareem Abbas
5 (16)
GoldenX Entry는 MT5용 인디케이터로, 적응형 Smart Entry Trend 알고리즘, 신호 스코어링 시스템, 시장 레짐 감지 기능, 그리고 변동성 필터를 포함합니다. 각 신호에는 계산된 진입 레벨, 3개의 익절(TP1, TP2, TP3) 레벨, 그리고 손절(Stop-Loss) 레벨이 포함됩니다. 이 인디케이터는 다양한 시장 환경에 적응하도록 설계된 다중 분석 레이어 구조 위에 구축되어 있으며, 내장 최적화기와 통계 추적 시스템을 결합합니다. 또한 Risk-to-Reward(RR) 지표와 과거 거래 행동 기반의 정량 분석을 제공합니다. 시작은 간단합니다 — 선택한 타임프레임에서 최적화기를 실행한 뒤 차트에서 바로 인디케이터를 사용하면 됩니다. 핵심 기능 GoldenX Entry는 하나의 차트에서 신호 엔진, 트레이드 관리 기능, 그리고 과거 통계 추적을 통합합니다: - 내장 최적화기: 최적화기는 차트에서 원클릭으로 실행됩니다. 200개의 파라미터 조합을 두 단계 탐색
Gold Entry Sniper
Tahir Mehmood
5 (19)
Gold Entry Sniper – 골드 스캘핑 & 스윙 트레이딩을 위한 전문 다중 시간 프레임 ATR 대시보드 Gold Entry Sniper 는 XAUUSD 및 기타 종목에 대해 정확한 매수/매도 신호 를 제공하는 고급 MetaTrader 5 지표입니다. ATR 트레일링 스톱 로직 과 다중 시간 프레임 분석 을 기반으로 설계되어 스캘핑과 스윙 트레이딩 모두에 적합합니다. 주요 기능 및 장점 다중 시간 프레임 분석 – M1, M5, M15 추세를 한눈에 확인. ATR 기반 트레일링 스톱 – 변동성에 따라 자동 조정. 전문 차트 대시보드 – 신호 상태, ATR 레벨, 회귀선, 매매 방향 표시. 명확한 매수/매도 마커 – 자동 화살표와 텍스트 라벨. 종료 알림 & 거래 관리 – 수익 보호를 위한 자동 종료 감지. 완전 사용자 설정 가능 – 대시보드 위치, 색상, ATR/회귀선 파라미터 조정. 골드(XAUUSD) 최적화 – M1~M15 스캘핑에 완벽, 외환/지수/암호화폐에도 적용 가능.
Superhero
Ihor Otkydach
5 (2)
SUPERHERO 지표는 “올인원” 방식으로 설계된 다중 통화 거래 시스템입니다. 이 지표는 시장을 독자적으로 분석하여 포지션을 개설하고 청산할 시점에 대한 신호를 제공합니다. 손절매(Stop Loss) 및 익절(Take Profit) 주문을 활용하며, 위험 대비 수익 비율(R:R)은 1:1입니다. 가끔 저는 이 시스템의 신호를 바탕으로 직접 거래를 하는데, 그 결과는 다음과 같습니다— 실시간 신호 이 시스템은 스마트폰으로 푸시 알림을 전송할 수 있으므로, PC에 묶여 있을 필요 없이 “이동 중에도” 매매를 할 수 있습니다. 이는 자체 거래 전문 회사에 안성맞춤입니다. 모든 고객님께 드리는 특별 혜택: 이 지표를 구매하시는 모든 분께는 제가 특별히 준비한 유틸리티를 선물로 드릴 예정이며, 이 유틸리티는 다음과 같은 기능을 제공합니다: 손절매 및 익절 주문을 자동으로 설정합니다 가격이 목표 수준에 도달하면 자동으로 포지션을 청산합니다 미결제 주문 거래를 지원합니다 평균화 거래 모드를
UZFX {SSS} 스캘핑 스마트 시그널 v4.0 MT5는 급변하는 시장에서 정확한 실시간 시그널을 필요로 하는 스캘퍼, 데이 트레이더, 스윙 트레이더를 위해 설계된 리페인팅이 없는 고성능 트레이딩 지표입니다. (UZFX-LABS)에서 개발한 이 지표는 가격 움직임 분석, 추세 확인 및 스마트 필터링을 결합하여 모든 통화 쌍과 시간대에서 높은 확률의 매수 및 매도 신호, 경고 신호, 추세 지속 기회를 생성합니다. 거래에 대한 의구심을 떨쳐버리고, 명확성, 정밀성, 그리고 규율 있는 시장 실행을 원하는 트레이더를 위해 설계된 체계적인 신호 시스템을 따르기 시작하세요. 제 추천* 최적의 시간대: 15분 이상. {H1}이 제가 가장 선호하는 시간대입니다. 그리고 그 결과는 정말 놀라울 정도입니다...!! 주요 기능 업데이트 • 자동 매수 및 매도 신호 감지 • 고급 반전 인식 로직 • 잠재적인 시장 반전 전 조기 경고 신호 • 추세 지속 확인 신호 • 진입, 손절, TP1, TP2,
Gann Made Easy MT5
Oleg Rodin
5 (9)
Gann Made Easy 는 mr.의 이론을 사용하여 최고의 거래 원칙을 기반으로 하는 전문적이고 사용하기 쉬운 Forex 거래 시스템입니다. W.D. 간. 이 표시기는 Stop Loss 및 Take Profit Levels를 포함하여 정확한 BUY 및 SELL 신호를 제공합니다. PUSH 알림을 사용하여 이동 중에도 거래할 수 있습니다. 구매 후 거래 방법 안내 및 유용한 추가 지표를 무료로 받으시려면 저에게 연락주세요! 아마도 Gann 거래 방법에 대해 이미 여러 번 들었을 것입니다. 일반적으로 Gann의 이론은 초보자 거래자뿐만 아니라 이미 거래 경험이 있는 사람들에게도 매우 복잡한 것입니다. Gann의 거래 방식은 이론적으로 적용하기 쉽지 않기 때문입니다. 나는 그 지식을 연마하고 Forex 지표에 최고의 원칙을 적용하기 위해 몇 년을 보냈습니다. 표시기는 적용하기가 매우 쉽습니다. 차트에 첨부하고 간단한 거래 권장 사항을 따르기만 하면 됩니다. 지표는 지속적으로 시장 분석
Axiom Matrix
Issam Kassas
5 (6)
AXIOM MATRIX MT5 출시 가격: $99 Axiom Matrix는 출시 가격 $99에 제공됩니다. 첫 30회 구매 이후 가격은 $199로 인상됩니다. 구매 후, 안내 사항을 받고 독점 선물 보너스를 받기 위해 저에게 직접 DM을 보내주세요. Axiom Matrix는 MetaTrader 5용 전문 멀티 심볼, 멀티 타임프레임 시장 스캐너이자 의사결정 대시보드입니다. Axiom Matrix는 사용자의 Market Watch를 스캔하고, 여러 타임프레임을 분석하며, 여러 근거 엔진을 읽고, 가장 강한 기회를 비교하여 하나의 깔끔한 매트릭스 대시보드 안에서 최적의 BUY, SELL, WAIT 또는 차단 상태를 보여줍니다. 저는 무거운 시장 스캔 작업을 대신 처리해 줄 수 있는 하나의 도구가 필요했기 때문에 Axiom Matrix를 만들었습니다. 저는 RSI만 따로 확인하고 싶지 않았습니다. 그다음 MACD만 따로 확인하고. 그다음 이동평균. 그다음 거래량. 그다음 변동성. 그다음
FiboSniper Pro
Van Minh Nguyen
5 (2)
FiboSniper Pro – 전문 멀티 필터 Fibonacci Grid 트레이딩 시스템 FiboSniper Pro는 Fibonacci Envelopes와 ADX, EMA, RSI, ATR 및 Time Filter를 포함한 다중 필터를 결합한 고급 기술 분석 지표 시스템입니다. 이를 통해 필터링된 진입 기회를 식별하고 ATR 변동성을 기반으로 Stop Loss 및 Take Profit 수준을 자동으로 계산할 수 있습니다. 특히 M5 스캘핑 전략을 사용하는 트레이더를 위해 설계되었습니다. 구매 후 Auto Trader X를 사용하여 FiboSniper Pro 신호를 자동으로 거래하는 방법에 대한 안내가 필요하시면 저에게 문의해 주세요. Auto Trader X를 통한 자동 매매 지원: [Auto Trader X] 사용자 가이드 및 권장 설정 파일 보기: [Click here] 업데이트 및 뉴스를 확인하려면 FiboSniper Pro MQL5 공개 채널에 참여하세요: [Click her
Power Candles MT5
Daniel Stein
5 (9)
Power Candles V3 - 자체 최적화 강도 지표 파워 캔들 V3는 적용된 모든 차트에서 통화 및 상품의 강세를 실행 가능한 거래 계획으로 전환합니다. 단순히 캔들에 색상을 입히는 대신, 백그라운드에서 실시간 자동 최적화를 수행하여 현재 보고 있는 종목에 대한 최적의 손절매, 익절 및 신호 임계값을 제공합니다. 한 번의 클릭으로 실시간 거래에 적용할 수 있으며, 진입점, 손절매 및 익절 선이 정확한 가격에 맞춰 차트에 표시되고, 방향과 함께 알림이 발령됩니다. 이 도구는 Stein Investments 에코시스템의 일부입니다. 18개 이상의 도구와 함께 당신의 1대1 AI 트레이딩 멘토 Max.  항상 대기 중, 모든 인디케이터를 깊이 있게 이해, 무언가를 차근차근 생각해보고 싶은 순간에 도움을 줍니다.  https://stein.investments 에서 만나보세요 매 종가 바마다 3,000회 이상의 트레이딩 시뮬레이션. 9가지 강도 상태. 2가지 전략을 병렬로 테스트.
Trend Catcher ind mt5
Ramil Minniakhmetov
5 (18)
트렌드 캐처 인디케이터 트렌드 캐처 인디케이터는 개발자가 자체 개발한 맞춤형 적응형 트렌드 분석 지표들을 조합하여 시장 가격 움직임을 분석합니다. 단기적인 노이즈를 제거하고 근본적인 모멘텀 강도, 변동성 확대, 가격 구조 움직임에 집중하여 진정한 시장 방향을 파악합니다. 또한 이동 평균, RSI, 변동성 필터와 같은 맞춤형 지표들을 활용하여 가격을 평활화하고 트렌드를 필터링합니다. 실제 운영 모니터링 및 기타 제품은 다음 링크에서 확인하실 수 있습니다:   https://www.mql5.com/en/users/mechanic/seller 텔레그램에서는 EA나 설정 파일을 판매하지 않습니다. 사기이니 주의하세요. 모든 설정 파일은 블로그에서 무료로 제공됩니다. 중요! 구매 후 즉시 연락 주시면 사용 방법 및 보너스를 드립니다!
SkyHammer Signal Pro
Shengzu Zhong
5 (4)
SkyHammer Signal Pro Entry, SL, TP 레벨이 고정되는 전문 No-Repaint 추세 신호 인디케이터 SkyHammer Signal Pro는 명확하고 고정되며 검증 가능한 신호를 원하는 트레이더를 위해 설계된 구조적인 추세 및 모멘텀 신호 인디케이터입니다. 특히 M1 및 M5 같은 낮은 시간대에서 가장 효과적으로 작동합니다. 이 인디케이터는 시장의 고점이나 저점을 예측하려고 하지 않습니다. 대신 신호를 생성하기 전에 확인된 시장 구조, 추세 방향, 모멘텀 강도, 건강한 변동성, 그리고 목표까지의 충분한 공간을 기다립니다. 주요 기능 고정 신호 메커니즘 신호가 확인되면 화살표, Entry, Stop Loss, TP1, TP2 레벨이 차트에 영구적으로 고정됩니다. 이후 캔들 움직임 때문에 신호가 사라지거나, 이동하거나, 변경되지 않습니다. 이를 통해 트레이더는 각 신호를 명확하게 검토할 수 있으며, 실시간 시장에서 신호가 사라지는 일반적인 문제를 피할 수 있습니다
Crystal Heikin Ashi Signals
Muhammad Jawad Shabir
5 (3)
Crystal Heikin Ashi Signals - Professional Trend & Signal Detection Indicator Advanced Heikin Ashi Visualization with Intelligent Signal System for Manual & Automated Trading Final Price: $149 ---------> Price goes up $10 after every 10 sales . Limited slots available — act fast . Overview Crystal Heikin Ashi Signals is a professional-grade MetaTrader 5 indicator that combines pure Heikin Ashi candle visualization with an advanced momentum-shift detection system. Designed for both manual traders
Gem SIGNAL
Shengzu Zhong
5 (1)
GEM Signal Pro GEM Signal Pro는 MetaTrader 5용 추세추종형 지표로, 차트에서 더 명확한 신호, 더 구조적인 트레이드 설정, 그리고 더 실용적인 리스크 관리를 원하는 트레이더를 위해 설계되었습니다. 단순한 화살표만 표시하는 것이 아니라, GEM Signal Pro는 전체 트레이드 아이디어를 더 깔끔하고 읽기 쉬운 방식으로 보여줍니다. 조건이 확인되면 진입가, 손절가, 목표가를 차트에 표시하여 트레이더가 설정을 더 효율적으로 검토할 수 있도록 도와줍니다. 작동 방식 이 지표는 먼저 내부 로직에 따라 유효한 초기 신호를 식별합니다. 확인 조건이 충족되면, GEM Signal Pro는 차트에 전체 설정을 표시합니다. 이를 통해 트레이더는 거래 구조를 더 명확하게 보고, 수동 분석 작업을 줄일 수 있습니다. 차트에 표시되는 거래 레벨 확인된 신호에 대해, GEM Signal Pro는 다음을 표시할 수 있습니다. 진입가 손절가 목표가 1 목표가 2 목표가 3 손
The Oracle Pro
Ottaviano De Cicco
5 (1)
The Oracle Pro: Synthetic Multi-Timeframe Bias Engine for MT5 ️ Summer Launch Offer — Get The Oracle Pro for USD 199 (early buyers). Price rises with traction; final price USD 399. The Oracle Pro is a premium multi-timeframe bias engine for MetaTrader 5, built for demanding and professional traders. It answers one question with discipline: what is the directional bias on each timeframe right now, how strong is it, and how much do the timeframes agree? Everything is computed on closed bars only
Azimuth Pro
Ottaviano De Cicco
5 (7)
Azimuth Pro V2: Synthetic Fractal Structure and Confirmed Entries for MT5 Overview Azimuth Pro is a multi-level swing structure indicator by Merkava Labs . Four nested swing layers, swing-anchored VWAP, ABC pattern detection, three-timeframe structural filtering, and closed-bar confirmed entries — one chart, one workflow from micro-swings to macro-cycles. This is not a blind signal product. It is a structure-first workflow for traders who care about location, context, and timing. ️ Summer Sale
이 제품은 2026년 시장에 맞게 업데이트되었으며 최신 MT5 빌드에 최적화되었습니다. 가격 업데이트 안내: Smart Price Action Concepts는 현재 $200 에 제공됩니다. 다음 30회 구매 후 가격은 $299 로 인상됩니다. 특별 혜택: 구매 후 저에게 개인 메시지를 보내시면 무료 보너스 + 선물 을 받을 수 있습니다. 먼저, 이 트레이딩 도구는 리페인트 없음, 재그리기 없음, 지연 없음의 인디케이터이므로 전문적인 트레이딩에 적합하다는 점을 강조하고 싶습니다. [Online course] ,   [User Manual]  ,  [How to Install]  ,   [PDF] Smart Price Action Concepts Indicator는 초보자와 경험 많은 트레이더 모두에게 매우 강력한 도구입니다. 20개 이상의 유용한 인디케이터를 하나로 결합하고, Inner Circle Trader Analysis와 Smart Money Concepts Trading
ARICoins
Temirlan Kdyrkhan
ARICoin is a powerful trading companion designed to generate high-probability entry signals with dynamic TP/SL/DP levels based on volatility. Built-in performance tracking shows win/loss stats, PP1/PP2 hits, and success rates all updated live. Key Features: Buy/Sell signals with adaptive volatility bands Real-time TP/SL/DP levels based on ATR Built-in MA Filter with optional ATR/StdDev volatility Performance stats panel (Success, Profit/Loss, PP1/PP2) Alerts via popup, sound, push, or email Cust
Reversion King Indicator
Eugen-alexandru Zibileanu
5 (6)
새로운 왕의 등장 - 인디케이터 + 주문 관리 표시(TP1 + TP2 + TP3) + 선택형 텔레그램 시그널 전송 기능 포함 (무료) (완전한 트레이딩 및 시그널 시스템) 골드를 위한 최고의 EA: Gold Slayer 이 인디케이터는 고급 전략, 사용자 지정 가능한 주문 관리 시스템, 그리고 엔벨로프 확장을 결합한 평균 회귀(mean reversion) 시스템을 포함하고 있습니다. 또한 RSI와 같은 여러 지능형 확인 필터를 통해 높은 확률의 반전 진입 구간을 포착하여 BUY 및 SELL 시그널을 제공합니다. 단순히 거래 방법만 배우는 것이 아니라, 여러 포지션을 효과적으로 관리하고 이전에 수익 중인 오픈 포지션으로 손실 거래를 커버하는 방법까지 익힐 수 있습니다. M5 전용으로 설계 및 최적화되었으며, 유동성이 풍부해 시그널이 더 깔끔하고 신뢰도 높은 BTCUSD와 XAUUSD에서 뛰어난 성능을 발휘합니다. 이 인디케이터는 ATR 기반으로 자동 계산된 진입가, 손절가, 익절가와
Ace Trend
Mikhail Sergeev
5 (3)
우리는 당신에게 트렌드 거래의 세계에서 게임의 규칙을 변경하는 혁신적인 지표를 제시한다. 이 표시기는 성능을 재고하고 거래 경험을 전례없는 높이로 높이도록 설계되었습니다. 우리의 표시기는 경쟁 업체와 차별화 된 고급 기능의 고유 한 조합을 자랑합니다. "실제 가격 요인"의 첨단 기술은 가장 어렵고 휘발성 시장 상황에서도 탁월한 안정성을 보장합니다. 불안정한 패턴,깨진 지표 및 의식적이고 통제 된 거래에 작별 인사를하십시오. 표시기는 단지 아름다운 그림이 아닙니다! 지표는 거래자의 편으로 확률을 이동시켜 이익을 얻어야 합니다. 표시 신호(완전 자동 모드)에 따라 거래 결과에 익숙해: https://www.mql5.com/ko/signals/2339244 표시기는 형성된 막대에 다시 그리지 않습니다. 막대가 형성된 경우 표시기 판독 값은 변경되지 않습니다. 이 표시기는 모든 시간대에 작동합니다. 표준은 시간대입니다. 귀하의 의견은 매우 중요합니다! 당신은 어떤 질문,제안이,또는 당신의
Quant Direction MT5
Georgios Kalomoiropoulos
Quant Direction 은 3D 시장 분석 도구입니다. 다양한 매개변수에 걸쳐 정확한 백분율 편차를 계산하면서 완벽하게 객관적인 알고리즘 기반 시장 분석을 제공합니다. 첨단 AI 기반 모델링 도구와 엄격한 테스트를 거쳐 개발된 이 알고리즘은 타의 추종을 불허하는 정확도로 시장을 분석합니다. 플랫폼에서 모든 통화쌍 또는 금융 상품을 분석할 수 있습니다. 단기 거래, 데이 트레이딩, 스윙 트레이딩 등 어떤 유형의 거래를 하든 Quant Direction은 최적의 선택입니다. 운영자가 되는 것의 진정한 이점 퀀트 디렉션의 진정한 장점은 감정, 눈의 피로, 과도한 분석을 완전히 배제한다는 점입니다. 더 이상 수십 개의 차트를 일일이 살펴보며 방향을 찾거나 자신의 판단에 끊임없이 의문을 품을 필요가 없습니다. 이 시스템은 8개의 시간 간격(5개월에서 수개월까지)을 밀리초 단위로 처리합니다. 특정 시점의 주요 시장 참여자를 정확하게 식별하여 항상 성공 확률이 가장 높은 방향으로 거래할
제작자의 제품 더 보기
Breakout Target
Muhammad Hassaan
NeuronBreakout identifies volatility compression before the market expands. It waits for price to contract, anchors a breakout range to the most recent confirmed swing, tracks that range until price closes beyond it, then projects a complete trade with entry, ATR-based stop loss, and three R-multiple profit targets. Every completed breakout remains frozen on the chart, allowing you to review past setups exactly as they formed. It is an indicator for chart analysis only: it draws on the chart, it
Cardwell Range
Muhammad Hassaan
Cardwell Range Analyze reads trend from the range the RSI holds, not from a fixed overbought or oversold line. Andrew Cardwell's observation was that in a genuine uptrend the RSI oscillates inside a higher band and rarely breaks below it, while in a downtrend it works a lower band and rarely breaks above — so the band the RSI is respecting is itself the trend signal. This indicator turns that reading into a confirmed regime, colours the chart by it, and projects a full ATR trade the moment the r
SMC Flow Cloud
Muhammad Hassaan
SMF Cloud is a clean, lightweight chart indicator that visualizes directional market flow using an adaptive trend “cloud”, dynamic volatility bands, retest markers, and a TradingView-style strength gauge. It is designed for fast decision-making: identify trend shifts, measure trend strength, and spot pullback/retest opportunities at a glance. Key Features Smart Money Flow Trend Cloud Smooth trend baseline (EMA or ALMA) with optional additional smoothing. Clear bullish/bearish flow visualization
NeuronLiquidity is a chart-overlay indicator for MetaTrader 5 from Neuron Systems that maps where liquidity rests and marks the exact bar where it is taken. It is an indicator only: it draws on your chart and raises alerts. It does not place trades, it does not send buy or sell orders, and it does not manage positions or accounts. Native MQL5, no DLLs, no external dependencies. Works on any symbol (forex, gold and metals, indices, crypto) and any timeframe. === HOW IT FINDS LIQUIDITY POOLS === A
Chandelier Exit Pro
Muhammad Hassaan
Chandelier Exit PRO A precise and reliable trend-following indicator for MetaTrader 5 Chandelier Exit PRO is a professionally engineered implementation of the Chandelier Exit indicator, designed to closely match the original version in both logic and signal behavior. It provides clear trend direction, dynamic stop levels, and well-timed reversal signals, making it suitable for traders who require consistency and accuracy in their decision-making. Core Features Accurate Logic This indicator repli
FREE
SuperTrend V
Muhammad Hassaan
*This is TradingView indicator converted to mql4* The SuperTrend V indicator is a popular technical analysis tool used to identify trends and potential trend reversals in financial markets. It is based on the concept of the SuperTrend indicator but incorporates additional features and variations. The SuperTrend V indicator uses a combination of price action and volatility to determine the trend direction and generate trading signals. Here are the key components and features of the indicator: Ca
FREE
Trade. Allows you to perform basic trading operations in one click directly from the chart. Trading operations: Open Buy and Sell market positions with one click. Specify lot size manually before opening a trade. Set Stop Loss and Take Profit as price levels . Stop Loss and Take Profit are automatically initialized at a fixed distance from the current market price (default: ±50 pips , symbol-aware). Fully supports Forex, Metals (XAUUSD), Indices, and other MT5 symbols with correct price formatti
FREE
Trend Magicc
Muhammad Hassaan
*This is tradingview indicator converted to mql5* The Trend Magic Indicator is a popular technical analysis tool used to identify the direction of a market trend and potential trend reversals. It is a versatile indicator that can be applied to various financial instruments and timeframes. The Trend Magic Indicator consists of a combination of moving averages and a volatility-based filter. It aims to smooth out price fluctuations and provide a clearer visualization of the underlying trend. Here
FREE
CM SlingShot System
Muhammad Hassaan
*This is tradingview indicator converted to mql4* The CM Slingshot System Indicator is a trading tool that aims to identify potential trade setups based on market volatility and price action. It is designed to help traders spot entry and exit points in trending markets. The CM Slingshot System Indicator combines multiple indicators and techniques to generate trading signals. Here are the key features and components of the indicator: Bollinger Bands: The indicator incorporates Bollinger Bands, w
Chandelier Exits
Muhammad Hassaan
*This is tradingview indicator converted to mql4* The Chandelier Exit Indicator is a popular technical analysis tool developed by Chuck LeBeau. It is designed to help traders identify potential exit points for their trades based on market volatility and the concept of trailing stops. The Chandelier Exit Indicator consists of three main components: Average True Range (ATR): The indicator utilizes the Average True Range, which measures market volatility. The ATR calculates the average range betwe
UT bot alerts
Muhammad Hassaan
*This is tradingview bot converted to mql4* The UT Bot Alert Indicator is an advanced technical analysis tool designed to help traders optimize their trading performance. This innovative indicator is based on the proven UT Bot system, which utilizes multiple indicators to deliver accurate signals that can help traders make better decisions. The UT Bot Alert Indicator provides a range of features that can help you stay on top of market trends and capitalize on opportunities. Here are some of its
UT bot alert
Muhammad Hassaan
UT Bot Alerts is a technical indicator for MetaTrader 5 that highlights potential directional changes based on momentum conditions. The indicator marks signal points directly on the chart and can generate optional notifications for convenience. The signal generation logic can operate in two modes: Closed-bar mode: signals are confirmed only after the bar closes. Live-bar mode: signals are displayed during the formation of the current bar. Both modes are available depending on the user's preferr
HA Market Bias
Muhammad Hassaan
*This is trading view indicator converted in mql5* The HA Market Bias Indicator is a popular tool used in trading and technical analysis, designed to help traders identify market bias and potential trend reversals. It is commonly used in conjunction with candlestick charts and provides valuable insights into market sentiment. The indicator is based on the Heiken Ashi (HA) candlestick charting technique, which aims to filter out market noise and provide a smoother representation of price action.
The trendlines with breaks indicator return pivot point based trendlines with highlighted breakouts. Users can control the steepness of the trendlines as well as their slope calculation method. Trendline breakouts occur in real-time and are not subject to backpainting. Trendlines can however be subject to repainting unless turned off from the user settings. The indicator includes integrated alerts for trendline breakouts. Any valid trendlines methodology can be used with the indicator, users
AI Range Breaker
Muhammad Hassaan
Note: Kindly inbox me for setfile AI Range Breaker watches a time window you choose each day, marks that session’s high and low , then automatically places pending buy/sell orders just outside the range. If price breaks out, the EA manages the trade with breakeven, candle-based trailing, optional partial close, and a single scale-in once price moves in your favor. If nothing happens, the pending orders are removed after a set number of candles—keeping your chart and account clean. Best use Work
This indicator builds a Pivot Anchored Volume Profile (VAP/VPOC approximation using tick volume) and automatically splits the profile into pivot-to-pivot segments , giving you a clean, TradingView-like view of where volume concentrated during each swing. It draws a horizontal histogram for every segment and highlights the Value Area and key levels, making it easy to spot acceptance/rejection zones, high-volume nodes, and potential support/resistance. Key Features Segmented Volume Profile (Pivot-
NeuronScanner - Multi-Symbol Multi-Timeframe Confluence Scanner for MetaTrader 5 NeuronScanner is an on-chart scanner and dashboard for MetaTrader 5. It shows a colour-coded grid of confluence scores across many symbols and timeframes on one panel, so you can review a whole watchlist at once. Works on any symbol: forex, metals, gold, indices and crypto. HOW IT WORKS For every symbol and timeframe in the grid, NeuronScanner reads eight indicators and turns each into a simple vote - bullish, be
NeuronStructure reads market structure the way a desk does and labels every event on the exact closed bar that confirmed it, so what you see now is what you would have seen then. It is an indicator for chart analysis only: it draws on the chart, it does not place, modify or close trades, it does not send orders, and it does not manage positions or accounts. It is the market-structure companion to NeuronLiquidity, built to sit alongside it: structure tells you the framework and bias, liquidity te
Neuron Sessions
Muhammad Hassaan
NeuronSessions maps the four trading sessions, Sydney, Tokyo, London and New York, directly on your chart and keeps the read honest: a completed session is frozen and never redrawn, only the live one develops. It is an indicator for chart analysis only: it draws on the chart, it does not place, modify or close trades, it does not send orders, and it does not manage positions or accounts. It is the sessions companion to NeuronLiquidity and NeuronStructure, and is built to sit alongside them: stru
Neuron Sniper ICT
Muhammad Hassaan
NeuronSniper is a complete ICT (Inner Circle Trader / smart-money) workspace and setup engine for MetaTrader 5 from Neuron Systems. It maps the whole picture, market structure, liquidity, order blocks, fair value gaps and premium/discount, and then marks one strict, high-quality reversal setup with a fixed risk:reward plan. It is an indicator for chart analysis only: it draws on the chart, it does not place, modify or close trades, it does not send orders, and it does not manage positions or acc
Neuron Flow SMC
Muhammad Hassaan
NeuronFlow is a smart-money trend-continuation toolkit for MetaTrader 5 from Neuron Systems. It reads market structure and then, on every confirmed break, marks a continuation setup, a pullback into the fresh order block or fair value gap left by the move, in the direction of the trend, with a fixed risk:reward plan. It is an indicator for chart analysis only: it draws on the chart, it does not place, modify or close trades, it does not send orders, and it does not manage positions or accounts.
Neuron Super Trend
Muhammad Hassaan
NeuronTrend is a premium adaptive trend engine for MetaTrader 5 from Neuron Systems. It draws one clean, non-repainting baseline that colours the trend blue (up) or red (down), surrounds it with a translucent neon trend cloud, and reads the trend across timeframes in a live dashboard. It is an indicator for chart analysis only: it draws on the chart, it does not place, modify or close trades, it does not send orders, and it does not manage positions or accounts. Native MQL5, no DLLs, non-repaint
NeuronCloud is a premium moving-average cloud for MetaTrader 5 from Neuron Systems. A fast and a slow moving average fill a translucent neon cloud behind the candles and colour it blue (up) or red (down), while a multi-MA ribbon between them shows when a trend is fanning out or compressing into a squeeze. It is an indicator for chart analysis only: it draws on the chart, it does not place, modify or close trades, it does not send orders, and it does not manage positions or accounts. Native MQL5,
NeuronIchimoku is a premium Ichimoku Kinko Hyo indicator for MetaTrader 5 from Neuron Systems. It draws the full classic Ichimoku system, projects the cloud forward of price, and scores every Tenkan/Kijun cross with a transparent five-factor confidence engine so you can see, at a glance, which crosses agree with the bigger picture and which do not. It is an indicator for chart analysis only: it does not place, modify or close trades, it does not send orders, and it does not manage positions or a
NeuronQuant is a premium quant analytics indicator for MetaTrader 5 from Neuron Systems. It reads the chart with the kind of statistical tools common in quantitative analysis: a forward expected-move range, realized volatility, a market-regime read and a standardized z-score. It is an indicator for chart analysis only: it does not place, modify or close trades, it does not send orders, and it does not manage positions or accounts. Native MQL5, no DLLs, non-repainting closed-bar logic. Works on a
NeuronPropGuard — prop-firm rule compliance & trade management for MT5 Most funded accounts are not lost on bad entries — they are lost on a single trade that crosses the daily-loss line or the max-drawdown floor. NeuronPropGuard keeps those rules in front of you in real time, sizes every trade against the room you actually have left, and can step in before a buffer is breached. It reads only your own MetaTrader 5 account — no external feed, no signals, no profit promises. It cannot guarantee co
NeuronDivergence — multi-oscillator confluence divergence engine for MT5 A single oscillator showing divergence is a hint; three agreeing at once is a setup. NeuronDivergence reads RSI, MACD and Stochastic together, finds regular and hidden divergence on each, and only marks a signal when enough of them agree — then scores that agreement 0–100 with a confidence engine and draws it on your chart with entry, stop and target levels, a command dashboard and alerts. It is non-repainting and closed-ba
NeuronCopier — a local MT5 trade copier that actually thinks Most copiers blindly mirror lots. NeuronCopier verifies the symbol by price, sizes each trade by risk, scores the master it is copying, protects the receiving account against prop-firm and drawdown breaches, and ships with a full on-chart trade manager. It mirrors trades from one MetaTrader 5 account to one or many others running on the same PC , instantly and reliably, through the shared terminal data folder. 100% native MQL5 — no DLL
NeuronReplay — replay each of your closed trades one by one, bar-by-bar, and analyze exactly what happened Your trade history is just a list of numbers. NeuronReplay turns it into film. It lists every closed trade in a dashboard; click any one and it re-plays that single trade candle-by-candle on its own chart , exactly like stepping through the MetaTrader 5 Strategy Tester — but scoped to a real trade you already took. You see the entry, the stop, the target and the exit drawn in, a floating P&
NeuronJournal - Trading Journal and Analytics Dashboard for MetaTrader 5 NeuronJournal reads your own MetaTrader 5 closed-trade history and presents it as an analytics dashboard inside the terminal. It shows your performance metrics, a calendar of daily results, a quant-style score of your trading, and a detailed breakdown of every trade and every day, with a built-in notes journal. It is an analytics and journaling tool only. It reads your account and draws. It does not give trading signals and
필터:
리뷰 없음
리뷰 답변