Neuron MACD

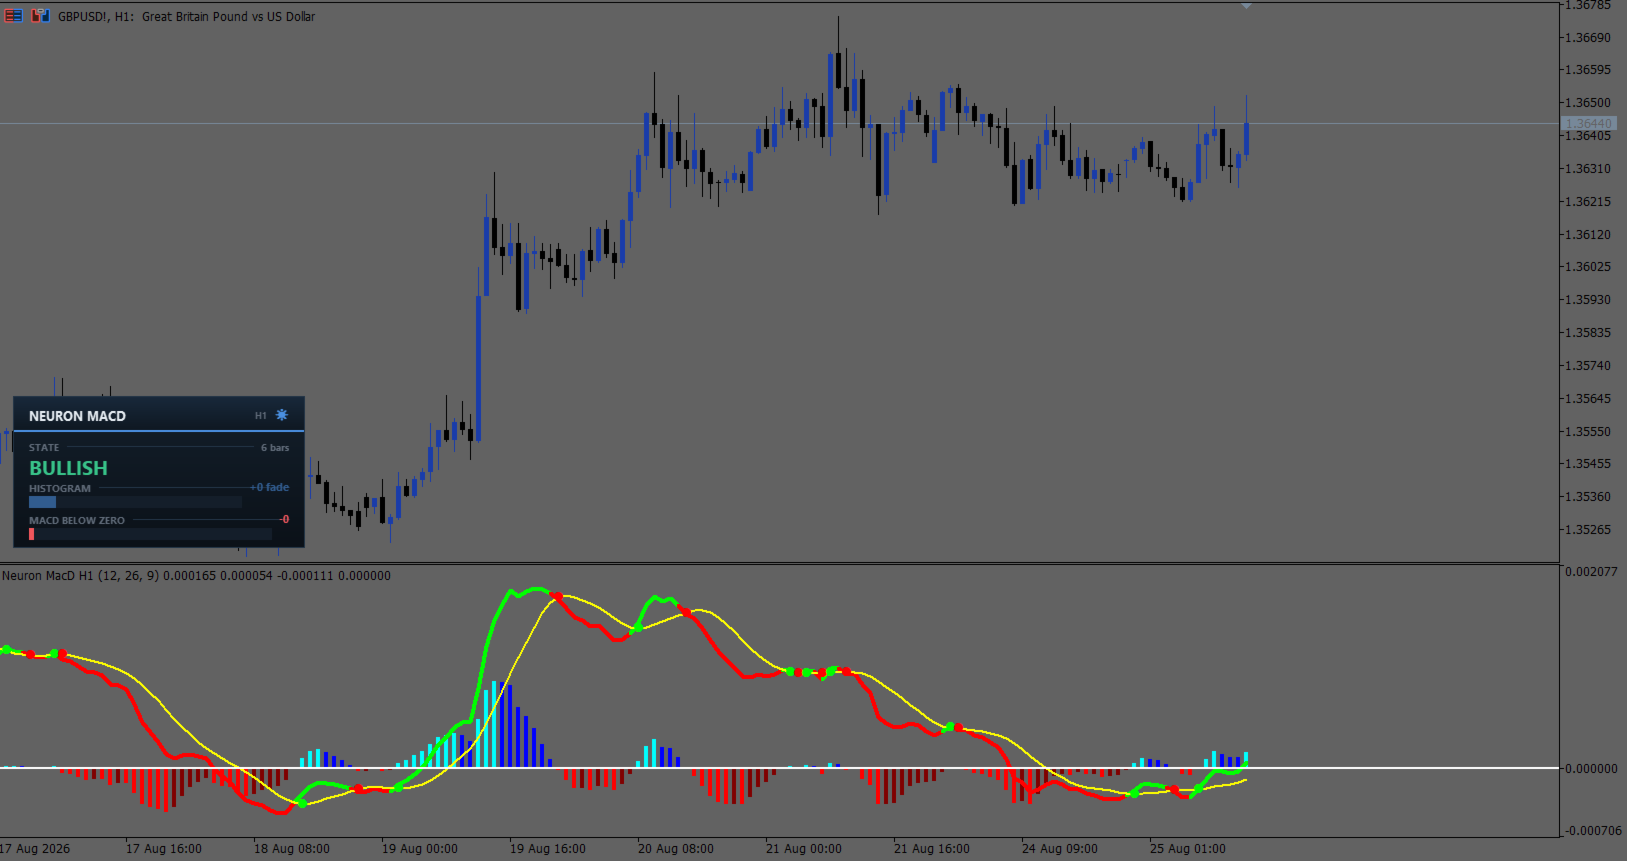
Neuron MacD is a MACD you can read at a glance instead of squinting at. The histogram is split into four colours — not two — so each bar tells you which side of zero it sits on and whether it is still growing or already shrinking. The MACD line changes colour the moment it crosses its signal, a dot marks every cross on the signal line itself, and the whole calculation can be pulled from a higher timeframe while you trade a lower one. It is an indicator for chart analysis only: it draws on the chart, it does not place, modify or close trades, it does not send orders, and it does not manage positions or accounts.

A panel on the price chart carries the state, the histogram and the MACD as live meters, so the reading is available without looking away from price. Native MQL5, no DLLs, closed bars are final, and it runs on forex, gold and metals, indices and crypto across any timeframe.

=== HOW IT WORKS ===

The core is the classic MACD: a fast exponential average minus a slow one, with a signal line and a histogram of the distance between them. Two details matter and are easy to get wrong. The signal here is a simple moving average of the MACD, not an exponential one, which is what the original rendering of this indicator uses and what gives the crosses their particular timing. And the histogram is the MACD minus that signal, so it is a measure of separation, not of the MACD itself.

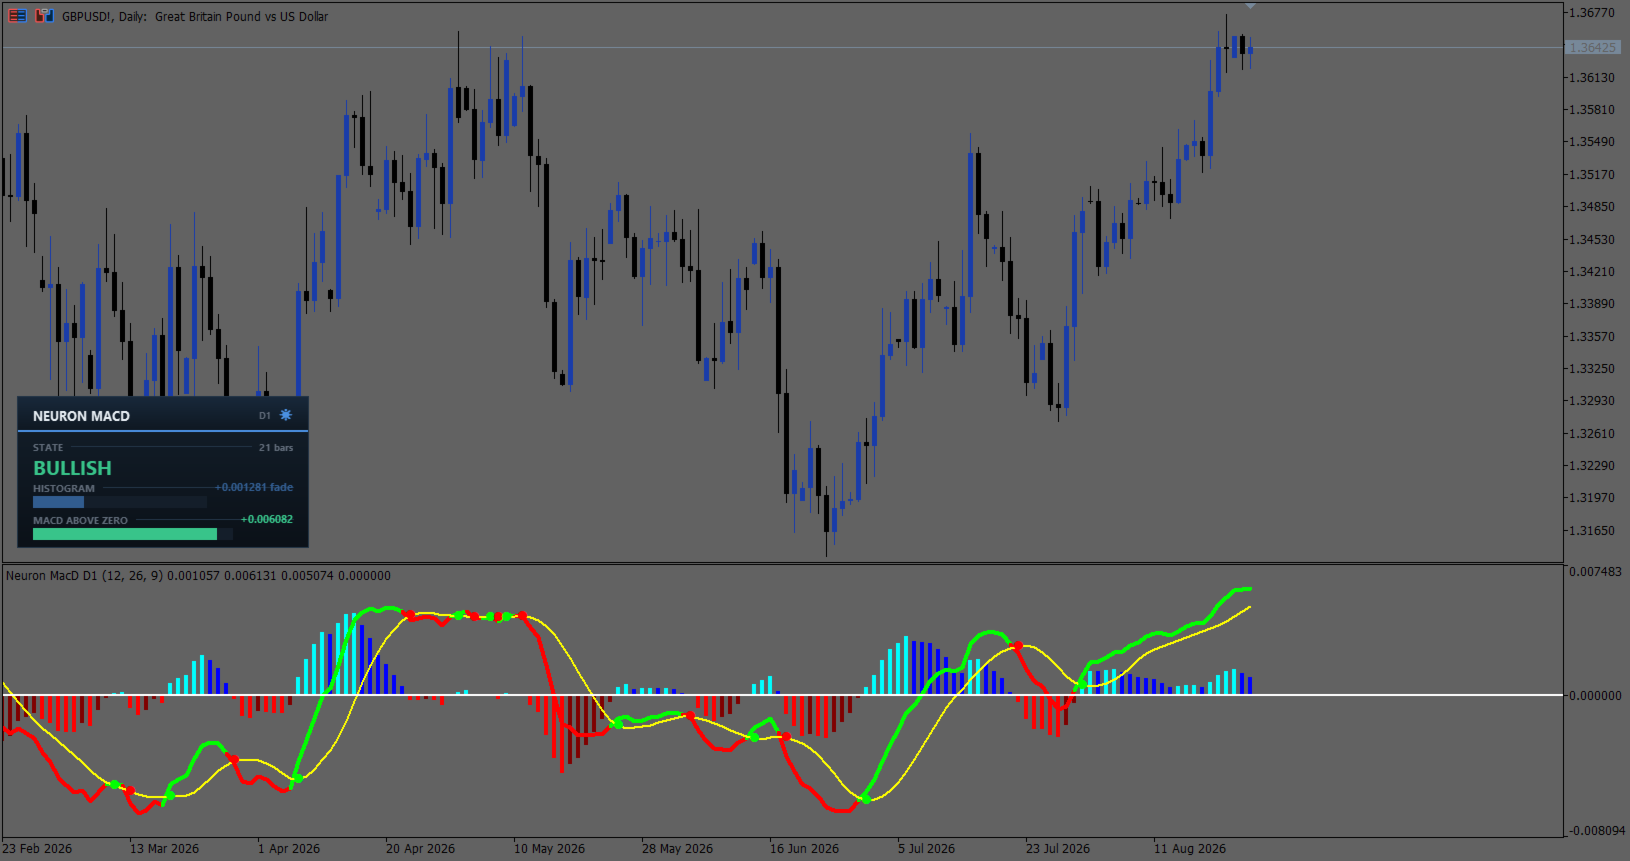
The four histogram colours come from two questions asked together. Is the bar above or below zero, and is it taller or shorter than the bar before it? Above zero and growing means momentum is extending in favour of buyers. Above zero and shrinking means buyers are still ahead but losing ground — the warning that arrives while the histogram is still positive. Below zero the same pair reads for sellers. One colour, two facts, no second glance.

The MACD line is coloured by its position against the signal, so trend agreement is legible without tracing which line is on top, and a dot is printed on the signal line at every cross. Because the dot sits on the signal rather than floating above the pane, it marks the exact level the cross happened at.

Multi-timeframe is a first-class feature, not an afterthought. Leave the resolution on the chart's own and it behaves as a normal MACD. Point it at a higher timeframe and the entire calculation — both averages, the signal and the histogram — is computed on that timeframe's closes and mapped back onto your chart, so you can watch the four-hour picture while working a five-minute chart. The timeframe in use is printed on the panel so a borrowed reading is never mistaken for the chart's own.

=== WHAT IS INCLUDED ===

Module What it does
Four-colour histogram Above zero growing, above zero shrinking, below zero growing, below zero shrinking — each with its own colour, so a stalling move is visible before it turns.
Colour-changing MACD line The line itself carries the signal relationship, switching colour the bar the cross happens.
Cross dots A dot on the signal line at every MacD/signal cross, marking the exact level rather than a generic marker floating in the pane.
Multi-timeframe engine Run the whole calculation on any timeframe from any chart. The panel shows which timeframe is feeding the reading.
State & duration BULLISH or BEARISH with the number of bars held since the last cross — a six-bar-old cross and a sixty-bar-old trend stop looking alike.
Histogram meter The current histogram scaled against the last hundred bars, tagged fade the moment it stops growing, so strength is read in context instead of as a raw number.
MACD meter Distance from the zero line, scaled the same way, with the header naming which side of zero the MACD is on.
Signal panel The Neuron panel on the price chart, one of nine anchors, scalable from 70% to 250% for any screen. Reads closed bars only.
Light & dark themes Two tuned palettes, not one palette dimmed. A sun/moon icon in the panel header switches between them live.
Alerts Signal cross and zero-line cross, each switchable on its own, by terminal popup, phone push notification or email. Evaluated on closed bars, once per bar.
Display switches Histogram, lines and dots can each be turned off, and both colour schemes can be reduced to a single colour, so the pane shows only what you use.
EA buffers The raw MACD and signal are exposed as plain numeric buffers that stay filled whatever the display switches are set to, readable with a single CopyBuffer call.

=== HOW TO READ IT ===

Start with the histogram colour, not its height. A bright bar above zero is buyers extending; a dark bar above zero is the same buyers running out of push while still ahead. That change of shade is the earliest thing the indicator gives you, and it arrives well before the histogram crosses zero or the lines cross each other.

The MACD line colour confirms it. While the line holds its bullish colour the fast average is still above the signal, and a run of darkening histogram bars under a still-bullish line is a move losing steam rather than reversing. When the dot prints, the relationship has actually changed, and the panel's bar count restarts from there.

Use the zero line for context rather than for signals. A bullish cross that happens below zero is a counter-trend bounce inside a weak market; the same cross above zero is a pullback ending inside a strong one. The panel names the side explicitly so you do not have to judge it by eye on a compressed pane.

In multi-timeframe mode, read the panel's timeframe chip first. A higher-timeframe MACD holds one value across all the chart bars inside each of its own bars, so the line steps rather than curves and the histogram bars repeat — that is the higher timeframe speaking, not a fault.

=== INPUTS ===

Setting Default What it does
Timeframe
Use current chart resolution true Calculate on the chart's own timeframe. Uncheck to borrow another one.
Different timeframe H1 The timeframe to calculate on when the box above is unchecked.
Calculation
Fast EMA length 12 The faster of the two exponential averages.
Slow EMA length 26 The slower average. Must be larger than the fast one.
Signal SMA length 9 Simple moving average of the MACD, giving the signal line.
History bars to process 5000 How far back to calculate and draw. 0 processes all available history.
Display
Show MacD and signal line true Draw the two lines. Off leaves the histogram alone in the pane.
Show dots when MacD crosses signal true Print a dot on the signal line at every cross.
Show histogram true Draw the histogram.
Change MacD line colour on signal cross true Colour the line by its position against the signal. Off draws it in a single colour.
MacD histogram 4 colours true Off reduces the histogram to one neutral colour.
Dashboard
Show dashboard true Show the state, histogram and MACD panel on the price chart.
Dashboard position Bottom Left One of nine chart anchors.
Dark mode true Initial theme; the sun/moon icon in the header toggles it live.
Dashboard size % 100 70 to 250. Scales the whole panel — text, meters and padding together — for 4K screens or small laptops.
Alerts
Alert on MacD / signal cross true Fire on the bar the lines cross, naming the direction.
Alert on MacD zero-line cross false Fire when the MACD changes side of zero.
Terminal popup alert true Popup in the terminal.
Push notification to phone false Mirror alerts to the MetaTrader app.
Email alert false Mirror alerts to the email configured in the terminal.
Colours
Histogram: above zero, rising / falling Aqua / Blue Momentum extending, then fading, above the zero line.
Histogram: below zero, falling / rising Red / Maroon Momentum extending, then fading, below the zero line.
Histogram: unchanged Yellow A bar identical to the one before it, which is common in multi-timeframe mode.
Histogram: single-colour mode Gray Used when the four-colour switch is off.
MacD line above / below signal Lime / Red The two line colours, also used for the cross dots.
Signal line Yellow The signal line colour.
Zero line White The solid level through the middle of the pane.
Cross dot symbol 159 Wingdings character code for the cross marker.

Fixed internals, not exposed as inputs: both averages are seeded from the first available bar, the signal is a simple average of the MACD, the panel meters scale against the last hundred bars, and higher-timeframe data is read up to twenty thousand bars back.

=== GOOD TO KNOW ===

  • Closed bars are final — on the chart's own timeframe, a bar's value, colour and dot are fixed once it closes and are never redrawn. The forming bar updates live as price moves, exactly as on any oscillator, so read signals from the close if you want confirmed readings only. The panel ignores the forming bar entirely.
  • Multi-timeframe behaves like every MTF tool — while a higher-timeframe bar is still forming, its value moves, and the chart bars inside it hold whatever it read as they closed. Reloading the chart recalculates them from the completed higher-timeframe bar, so a reloaded chart can differ from what you watched live. This is inherent to reading one timeframe on another, and the panel names the timeframe so it is never a surprise.
  • Indicator, not an EA — Neuron MacD analyses and draws. It does not place, modify or close orders, and it makes no forecast of price. The decision, the risk and the sizing are yours.
  • Alerts behave — each event is evaluated once per closed bar and never fires twice for the same bar, loading history never produces a burst of stale alerts, and everything is muted inside the Strategy Tester and during optimization.
  • For EA developers — buffer 0 is the histogram, 2 the MACD line, 4 the signal, and buffers 7 and 8 carry the raw MACD and signal. The raw pair stays filled no matter which display switches are off, so an EA is never starved by a cosmetic setting. All are readable with iCustom and CopyBuffer.
  • Platform — MetaTrader 5, any symbol and any timeframe. The oscillator plots in its own sub-window; the panel is drawn through the built-in Canvas on the price chart. No DLLs, no file access, no network calls.
  • Light & dark — one click re-themes the panel, each mode with its own palette rather than a dimmed copy of the other. Every plot colour is a separate input, so the pane can be matched to any chart scheme.
おすすめのプロダクト
Indicador TriYep v1.02 – Más del 70% de señales precisas Indicador TriYep v1.02 – Más del 70% de señales precisas Presentación El indicador TriYep v1.02 se creó con un único propósito: ofrecer señales totalmente fiables. Esta versión gratuita está calibrada y optimizada específicamente para el par USD/JPY en el marco temporal M15 , donde su lógica alcanza su máximo rendimiento. Mientras que otros indicadores inundan tu gráfico con señales falsas y te hacen perder operación tras operación, hemos
FREE
Trend Quorum MT5
Kestutis Balciunas
5 (2)
Trend Quorum   は、動的なSuperTrendエンジンと独自のトレンド品質指数(TQI)、3つのオプションのコンフルエンスフィルターを組み合わせた適応型トレンドフォロー指標です。十分な数の独立した要素が一致して「投票」した場合にのみシグナルが発動します——まるで定足数のように。 MT5バージョンはこちら:  Trend Quorum MT5 その他の製品はこちら:   全製 品一覧 ライブ事例や新しいツールはプロフィールをご覧ください。更新情報を見逃さないよう、フレンドリクエストもお送りください! 仕組み 適応型SuperTrendエンジン 固定ATR乗数を使用する標準的なSuperTrend指標とは異なり、Trend Quorumはトレンド品質指数(TQI)を使用してリアルタイムでバンド幅を動的に調節します。TQIは4つの加重要素から計算された0から1までの連続スコアです: 効率比率   — 方向性のある動きの純粋度を測定します(価格の動きのどの程度が方向性のあるものでノイズでないか) ボラティリティレジーム   — 拡大または収縮するボラティリティ状況を検出します 価
FREE
Panel Indicator For MT5 Panel Indicator For MT5 は、MetaTrader 5 向けに設計されたビジュアルインジケーターで、スプレッドと市場セッションに関するすべての重要情報をひとつのコンパクトなパネルに統合します。チャート上に直接表示されるため、追加ウィンドウを開いたり外部ソースを参照したりすることなく、リアルタイムで更新される情報をトレーダーに即座に提供します。 リアルタイムスプレッド監視 パネルは、チャートに読み込まれた銘柄の現在のスプレッド値を継続的に表示します。瞬時値に加えて、インジケーターはアクティブなセッション中に蓄積された平均スプレッドと、同じ時間帯に記録された最大値を自動的に計算します。セッションが切り替わると同時にカウンターはリセットされ、計算が最初から始まるため、常に現在の運用状況に関連した統計が保証されます。 スプレッド値は色分けされています。緑は計算された平均値に対して正常範囲内のスプレッドを示し、黄色はやや高めのスプレッドを、赤は異常または範囲外のスプレッドを強調します。このシステムにより、トレーダーは注文を執行
FREE
STAMINA HUD – Advanced Market & Trend Dashboard (MT5) STAMINA HUD   is a professional   market information panel   designed for traders who want   clarity, speed, and control   directly on the chart. It provides a   clean heads-up display (HUD)   with essential market data and   multi-timeframe trend direction , without cluttering the chart or generating trading signals. What STAMINA HUD Shows   Current Price   Spread (in real pips)   Today High–Low range (pips)   Average D
FREE
Friend of the Trend: Your Trend Tracker Master the market with Friend of the Trend , the indicator that simplifies trend analysis and helps you identify the best moments to buy, sell, or wait. With an intuitive and visually striking design, Friend of the Trend analyzes price movements and delivers signals through a colorful histogram: Green Bars : Signal an uptrend, indicating buying opportunities. Red Bars : Alert to a downtrend, suggesting potential selling points. Orange Bars : Represent cons
FREE
VFI Quantum
Nikita Berdnikov
5 (1)
Introducing VFI (Volume Flow Indicator) – a trading indicator that analyzes the relationship between volume and price movement to identify key trading opportunities. The indicator displays the strength and direction of volume flow, providing clear signals about potential entry and exit points. Signals are formed based on zero line crossovers, crossovers between the VFI line and its exponential moving average (EMA), and when the indicator exits overbought and oversold zones. Attention! This stra
FREE
The CV MACD Indicator is a modern and professional momentum indicator designed to analyze trend strength, market direction and potential reversals. By combining the MACD line, signal line and histogram, the indicator helps traders identify market momentum and high-quality trading opportunities with clarity and precision. Features: Precise MACD momentum analysis Early trend reversal detection Clear histogram for market strength visualization Adjustable Fast, Slow and Signal periods Visual Buy & S
FREE
SuperTrend for MT5
Ulises Calderon Bautista
4.44 (9)
人気のある「スーパートレンド」インジケーターは、金融市場でのトレンドの方向と可能なエントリーポイントまたはエグジットポイントを特定するのに役立つテクニカル分析ツールです。このインジケーターは、価格の範囲に基づいて市場のボラティリティを測定する平均真のレンジ(ATR)に基づいています。他のプラットフォームでは無料で提供されており、ここでも同様です! 一般的に次の3つの方法で使用されます: 現在のトレンドの特定:価格がこのラインの上にある場合、上昇トレンドと見なされ、価格が下にある場合は下降トレンドと見なされます。 ストップロスレベルとして使用されます。 ダイナミックなサポート/レジスタンスとして:上昇トレンドでは、このラインは価格の下にあり、ダイナミックなサポートレベルとして機能します。下降トレンドでは、このラインは価格の上にあり、ダイナミックなレジスタンスレベルとして機能します。
FREE
Basic Theme Builder: チャートカスタマイズを簡単に Basic Theme Builder インジケーターで、MetaTrader 5   のチャート外観のカスタマイズをシンプルに変革しましょう。この直感的なインジケーターは、使いやすいパネルを提供し、さまざまなテーマやカラースキームを簡単に切り替えることができます。これにより、取引環境の視覚的な魅力と機能性が向上します。 Free MT4 version Basic Theme Builder インジケーターは、MetaTrader 5 のチャートを簡単にパーソナライズしたいトレーダーに最適なツールです。シンプルなパネルインターフェースとさまざまなテーマプリセットを使用して、取引スタイルや気分に合わせてチャートの外観をすぐに調整できます。クラシックなルックからモダンな美学まで、多彩なオプションを提供する Basic Theme Builder で、視覚体験を最適化しましょう。 主な機能: 簡単なテーマ管理: 便利なパネルインターフェースを使用して、ワンクリックでチャートのテーマを素早く変更できます。 定義済みのプ
FREE
Line Master
Ahmad Bin Fawzi Bin Al-akhdar Al-fazai
Line Master – Trend Lines & Direction Arrows Line Master is a professional trend indicator for MetaTrader 5. It helps traders identify market direction by combining fast and slow trend lines and generating arrows at trend change points. Features: Slow Trend Line: Represents the overall market trend. Fast Trend Line: Responds quickly to short-term price changes. Color-Coded Lines: Uptrend: DodgerBlue Downtrend: Crimson Trend Arrows: Signals appear when the trend changes. Adjustable Inputs: Fast l
FREE
As traders, we all know that risk management is the most important aspect of profitable trading. So, we need to determine the lot size, every time we need to open a new trade. The FX lot size calculator is a simple tool that will help you to determine your lot size easily without using any third-party service but you will be able to do that by your MetaTrader terminal. LIMITED TIME OFFER: 30$ FOR 10 ACTIVATION. Inputs: Maximum_Risk_Prc: To determine your preferred risk%. For example, if your ris
FREE
MarketTime - プロフェッショナル・マルチタイムゾーンクロック&セッションインジケーター 取引セッションを二度と逃さない - グローバル市場時間をリアルタイムでモニター MarketTimeは、MetaTrader 5チャート上に複数のタイムゾーン、ライブセッションカウントダウン、ビジュアル取引セッションゾーンを直接表示するプロフェッショナルグレードのインジケーターです。FX取引において、タイミングがすべてです - 主要金融センターがいつアクティブか、セッションがいつ重複するかを知ることは、取引の成功に大きく影響します。 この包括的なツールは、複数のブラウザタブや外部アプリケーションの必要性を排除します。グローバル市場時間をモニターするために必要なすべてがチャート上にあり、リアルタイムで更新され、作業スペースを乱雑にしないクリーンでカスタマイズ可能なインターフェースを備えています。 詳細はこちら: 完全なドキュメントと設定ガイド (English) 期間限定オファー: 最初の50ダウンロードは無料です!その後、この製品は有料になります。今すぐダウンロードして無料コピーを確保し
FREE
DC Indicator
Lamont Simone Reynecke
The donchian channel indicator might just be the best fit for you Trading in derivative products such as futures, options, CFD's, forex and certificates contains significant risk. These products are not suitable for every investor. Investors could potentially lose all or more than the original investment. If anything, only money equal to personal risk capital should be used and can be lost without jeopardizing financial security or lifestyle. Partially or fully automated trading programs can
FREE
Have you ever wondered which currency is the strongest at any particular time? Or which currency pair is trending the most. Well, the currency strength meter helps with just that.  It compares  USD ,  EUR ,  AUD ,  CHF ,  GBP ,  CAD  and  NZD  depending on the timeline you have chosen in settings, and ranks them on the number of pips each has moved compared to the rest. N/B: All currency charts of the above pairs must have loaded. You can do this by highlighting all major and minor currencies in
FREE
MetaTraderでロットサイズを計算しましょう! トレーダーの皆さん、こんにちは。リスク管理重視のトレーダーですか?もしそうなら、これはまさにあなたのためのツールです。Ibrahimと申します。口座残高に対するリスク率に基づいてロットサイズを計算できるツールを開発しました。このツールは、リスクを%で指定するのではなく、リスクを負いたい絶対値がある場合にも、ロットサイズを計算するのに役立ちます。例えば、残高から100ドルのリスクを負いたいと指定できます。 MT4バージョン: https://www.mql5.com/en/market/product/155026 無料ですので、ぜひお試しください。コメント欄で、今後コミュニティ向けに開発してほしいツールや、今後追加してほしいツールがあれば教えてください。 ハッピートレーディング、ハッピーオートメーション!
FREE
Strifor Lot Calculator — MetaTrader 5 用のインジケーターで、トレーダーが設定したリスクとストップロスに基づき最適なロットサイズを計算できます。 より意識的な取引、リスク管理、手動計算の時間短縮に役立ちます。 利点 正確なリスク管理 — 選択したリスク割合に応じてロットサイズを自動計算。 2つの動作モード — 手動入力またはチャート上のラインに基づく計算。 人気のある銘柄対応 — 通貨ペア、金 (XAUUSD)、原油 (USOIL/WTI)、指数 (US500 など)。 チャート上で迅速に視覚的な取引プラン作成。 実際の口座残高に基づくロット計算。 入力パラメータ Deposit — 手動で入金額入力(または 0 = 現在の口座残高使用)。 RiskPercent — 1取引あたりのリスク (%) StopLossPips — ストップロス (ピップ数、手動モードのみ) Mode — true = 手動モード、false = ラインモード 動作モード 手動モード Deposit、Risk、Stop-Loss を入力すると、最適なロットサイズを計算し
FREE
Enhanced Volume Profile: The Ultimate Order Flow & Liquidity Analysis Tool Overview Enhanced Volume Profile is an indicator for MetaTrader 5 that displays the traded volume at specific price levels over a defined period. It separates the total volume into buy and sell components, presenting them as a side-by-side histogram on the chart. This allows users to observe the volume distribution and the proportion of buy and sell volumes at each price level. Graphics Rendering The indicator uses the
FREE
Price Momentum
Flavio Javier Jarabeck
4.92 (12)
Value Chart indicator presents the Price evolution in a new form. This indicator, Price Momentum , was developed taking all the calculations presented in the book " Dynamic Trading Indicators " by Mark W. Helweg and David Stendahl (2002). The technique involves de-trended Prices from a user-defined Period of analysis and the addition of a Volatility index correction. The result is an Oscillator with 3 zones: Fair Price Value, Overbought/Oversold and Extremely Overbought/Oversold zones. Adding th
FREE
Calmer chart context, kept practical Northstar Flow Candles MT5 is a chart-window indicator that presents Heikin Ashi candles with a five-state trend context. It is designed for traders who want a quieter view of price while keeping the native chart available as an optional reference. Visual-only indicator: Northstar Flow Candles MT5 does not place trades and does not send popup, push, or email notifications. What appears on the chart Five candle states: strong bullish, bullish, balanced, bearis
FREE
Ultimate MACD MTF Pro は、従来のMACDを現代のトレード向けに再設計した、強力なアップグレード版です。 このインジケーターは、 マルチタイムフレームMACD、動的なヒストグラムカラー、シグナルクロスマーカー、モメンタムに基づくスマートなラインカラー変化 を提供します。 クリーンなシグナル、早期のトレンド検知、プロレベルの視認性を求めるトレーダーのために作られました。 主な特徴 マルチタイムフレームMACD (MTF) 現在のチャートの時間足と、上位足(H1, H4, D1など)を簡単に切り替え可能。 上位足のトレンド確認に最適です。 クリーンなMACDラインとシグナルライン – ライン幅の調整が可能 – MACDがシグナルとクロスすると自動で色が変化 – 滑らかで視認性の高いデザイン 5色スマートヒストグラム ヒストグラムは以下の条件に応じて5色に変化します: モメンタムの増加 モメンタムの減少 ゼロラインより上または下 トレンド転換の方向 これにより、トレンドの強さと反転を一目で把握できます。 クロスポイントドット(エ
FREE
インディケータはチャート上にトレンドラインを描画します。このインジケーターには6つの入力があります。ユーザーは両方の行に代替ラベルを指定できます。インジケーターの複数のインスタンスが使用される場合、ラベルは異なっている必要があります。ユーザーは、線の幅と色、および使用する重要なピークを指定する深さを設定できます。たとえば、Depth = 10は、現在の山と谷を使用してトレンドラインを設定します。この山と谷は、左右に少なくとも10本のバーがあり、高/低がピークの高/低よりも小さい/大きいです。インジケーターは、以前の山と谷もペイントします。インジケーターには、価格がサポート/レジスタンスラインから事前に設定された距離にあるときにユーザーに通知するために使用できるアラート機能が追加されています。アラート距離はピップで設定されます。
FREE
The idea behind this indicator is to find all currency pairs that are over-bought or over-sold according to the RSI indicator at one go. The RSI uses the default period of 14 (this can be changed in the settings) and scans all symbols to find the RSI level you will have specified. Once currency pairs that meet the specification are found, the indicator will open those charts for you incase those charts aren't open and proceed to write the full list of currencies on the experts tab.
FREE
Donchian Channel is an indicator created by Richard Donchian. It is formed by taking the highest high and the lowest low of the last specified period in candles. The area between high and low is the channel for the chosen period. Its configuration is simple. It is possible to have the average between the upper and lower lines, plus you have alerts when price hits one side. If you have any questions or find any bugs, please contact me. Enjoy!
FREE
Live Sup Res MT5
Claudia Ramona Angerer
4.89 (9)
Identification of support and resistance areas A useful indicator for traders completely free Can be used in all symbols Can be used in all time frames It has three different trends: short term, medium term, long term Settings: Clr1,2: You can change the color of the lines Type Trend: You can determine the trend Message me for questions, criticism and suggestions
FREE
Kiwi Multi Pairs Indicator MT5 v1.01 Kiwi Multi Pairs Indicator MT5 is a multi-market and multi-timeframe confirmation dashboard for MetaTrader 5. Instead of opening many charts and checking indicators individually, Kiwi Multi Pairs Indicator brings 9 markets, 5 technical indicators and 7 timeframes together in one easy-to-read dashboard. The indicator is designed to help traders quickly identify bullish, bearish and mixed market conditions and compare confirmation across different symbols and t
FREE
TradeVisonPro Forex Analyzer Pro MT5取引口座分析・モニタリングダッシュボード TradeVisonPro Forex Analyzer Proは、MetaTrader 5ユーザー向けに設計された取引分析および口座モニタリングソリューションです。 本製品は、MT5の取引データを構造化されたWebダッシュボードに整理し、口座情報の確認、保有ポジションの監視、取引履歴の分析、戦略の追跡、トレードジャーナルの記録、パフォーマンス統計の確認を可能にします。 TradeVisonPro Forex Analyzer Proは、取引情報を整理し、対応するデスクトップおよびモバイルWebブラウザからアクセスできるようにすることを目的としています。 主な機能 • MT5口座ダッシュボード • 保有ポジション監視 • 取引履歴分析 • トレードカレンダー • 戦略追跡 • トレードジャーナル • 口座パフォーマンス統計 • パフォーマンスレポート • 取引通知 • 複数口座対応 • 共有可能な読み取り専用レポート MT5口座ダッシュボード MetaTrader 5取引口
FREE
1. What Is SessionsScope? SessionsScope is a professional trading indicator for MetaTrader 5 that maps every major trading session directly onto your chart — and tells you, at a glance, exactly where each session started, ended, and how far price moved inside it. Every day the forex market moves through four distinct windows: Asia, Frankfurt, London, and New York. Each session has its own character, its own range, and its own relationship to the sessions that came before it. The high of the A
FREE
Key Price Levels MT5
Wafa Mohammed Omar Abou Alwafa
5 (3)
Key Price Levels Indicator Indicator that shows the highs and lows for the significant price levels for past periods that could be potentially considered as reaction levels. The indicator displays the following price levels: Yesterday high and low The day before yesterday high and low Two days back high and low Last week high and low Last month high and low Last three month high and low (Quarter) Last year high and low
FREE
Description : Rainbow MT5 is a technical indicator based on Moving Average with period 34 and very easy to use. When price crosses above MA and MA changes color to green, then this is a signal to buy. When price crosses below MA and MA changes color to red, then this is a signal to sell. The Expert advisor ( Rainbow EA MT5 ) based on Rainbow MT5 indicator is now available here . MT4 version is available here .
FREE
Double Correlation indicator (free) plots two windowed correlations in a separate window.  the size of window is taken as input before the two symbols to correlate to. Two symbols are taken as an input parameters as well as period length. and the two correlations are computed with the currently shown symbol ex: input GBPJPY and AUDNZD.  current symbol EURUSD then the following will be computed corr(EURUSD,GBPJPY) and corr(EURUSD,AUDNZD) The indicator can be useful to run a multi-symbol pair trad
FREE
このプロダクトを購入した人は以下も購入しています
この製品は 2026 年の市場向けに更新され、最新の MT5 ビルドに最適化されています。 価格更新のお知らせ: Smart Trend Trading System は現在 $99 で提供されています。 次の 30 件の購入 後、価格は $199 に上がります。 特別オファー: Smart Trend Trading System を購入後、私にプライベートメッセージを送ることで、 Smart Universal EA を無料 で受け取り、Smart Trend のシグナルを自動売買に変えることができます。 Smart Trend Trading System は、リペイントなし、再描画なし、遅延なしの完全なトレーディングシステムです。よりクリーンなシグナル、より明確なトレンド方向、そしてより整理された取引方法を求めるトレーダー向けに作られています。   [User Manual]   ,  [PDF]  ,   [Installation manual]   and  [Online course] このシステムは、トレンド検出、反転ゾーン、Smart Cloud、トレーリングス
Trend Sniper X
Sarvarbek Abduvoxobov
5 (11)
Trend Sniper X は、MetaTrader 5 用のマルチタイムフレーム・トレンドフォロー・インジケーターです。トレーダーがトレンドの方向性と反転ポイントを明確かつ正確に特定できるよう支援します。 価格情報: 現在の価格はキャンペーン価格であり、今後のアップデートや新機能のリリースに伴い変更される可能性があります。 Code2Profit チャンネル マルチタイムフレーム分析で相場をマスターしよう! Trend Sniper X で勝率を最大化する方法:重要なルールとセッションのコツ 技術仕様 プラットフォーム MetaTrader 5 インジケータータイプ マルチタイムフレーム・トレンドインジケーター 操作タイムフレーム あらゆるチャートタイムフレームに対応。個別に選択可能な上位タイムフレーム (M1–MN1) を搭載 主要銘柄 FX、ゴールド (XAUUSD)、およびその他のCFD 推奨口座 あらゆる口座タイプに対応 視覚化 色分けされたトレンドローソク足 (買い/売り/弱気/変化) + 買い/売り矢印 追加モジュール セッション市場ボックス (シドニー、東京、ロンドン
Welcome to ENTRY IN THE ZONE AND SMC MULTI TIMEFRAME Entry In The Zone and SMC Multi Timeframe is a real-time market analysis tool based on Smart Money Concepts (SMC), designed to analyze market structure, price direction, and key trading zones. It supports both Single-Timeframe Analysis and Multi-Timeframe Analysis, providing a clearer view of the overall market structure across multiple timeframes, with real-time BUY / SELL signals that do not repaint. It is designed to help filter trading opp
まず正直に言いましょう。 どんなインジケーターも、それ単体であなたを利益化させることはできません。もしそう言う人がいるなら、それは夢を売っているだけです。完璧な売買シグナル(矢印)を表示するインジケーターは、いくらでも“完璧に見せる”ことができます。正しい過去の区間を拡大して、勝ちトレードだけを切り取ればいいだけです。私たちはそれをしません。 SMC Intraday Formula はツールです。 市場構造を読み取り、最も高い確率の価格ゾーンを特定し、今この瞬間のスマートマネーの痕跡をシンプルな言葉で正確に示します。最終判断はあなたが行います。トレードを実行するのもあなたです。しかし今は「希望」ではなく「精度」でエントリーできます。 私たちはこのインジケーターを、ゴールド(XAUUSD)および主要FX通貨ペアで約3年間、日々のスキャルピングに使用してきました。M1、M5、M15、M30の主要ツールです。これは未来を予測しようとするのではなく、今まさに形成されている高確率セットアップを示し、その理由を説明します。 他のすべてのインジケーターと何が違うのか? ほとんどのトレーディングイ
SuperScalp Pro
Van Minh Nguyen
4.63 (32)
SuperScalp Pro – プロフェッショナル多層コンフルエンス・スキャルピングシステム SuperScalp Pro は、複数のコンフルエンスを組み合わせたプロフェッショナル向けスキャルピングシステムです。より高い確率のトレードチャンスを見つけられるよう設計されており、明確なエントリー確認、ATRに基づくStop LossとTake Profit、さらにXAUUSD、BTCUSD、主要なFX通貨ペアに対応した柔軟なシグナルフィルター機能を提供します。 完全なドキュメントは製品ブログでご覧いただけます: [User Guide] SuperScalp Pro Auto Trader EA による自動売買が利用可能です: [Auto Trader] SuperScalp Pro の公式 MQL5 チャンネルをフォローして、製品のアップデート、ニュース、最新のお知らせをご確認ください: [Official Channel] SuperScalp Pro は、Supertrend、VWAP、EMA、RSI、ADX、出来高分析、ボリンジャーバンド、MACDダイバージェンスを組み合わ
Neuro Poseidon is a new indicator by Daria Rezueva. It combines precise trading signals with adaptive TP/SL levels - creating best possible trades as a result! Message me and get  Neuro Poseidon Assistant  as a gift to automize your trading process! What makes it stand out? 1. Proven profitability on all assets and timeframes 2. Only confirmed BUY and SELL signals present on the chart 3. Adaptive TP & SL levels generated by the software for each trade 4. Easy to understand - suitable for al
時折、私自身もこのシステムを使って取引を行っています。 実口座での私の手動による「BOMBER」トレードをぜひご評価ください - LIVE SIGNAL このインジケーターを購入された方には、以下の特典を 無料 で提供しています: 各トレードを自動で管理し、ストップロスとテイクプロフィットを設定し、戦略ルールに基づいてポジションを決済する補助ツール 「Bomber Utility」 様々な銘柄に合わせたインジケーターの設定ファイル(セットファイル) 「最小リスク」、「バランスリスク」、「待機戦略」 の3つのモードで使用できる Bomber Utility 用の設定ファイル このトレーディング戦略をすぐに導入・設定・開始できる ステップバイステップのビデオマニュアル ご注意: 上記の特典を受け取るには、MQL5のプライベートメッセージシステムを通じて販売者にご連絡ください。 オリジナルのカスタムインジケーター 「Divergence Bomber(ダイバージェンス・ボンバー)」 をご紹介します。これは、MACDのダイバージェンス(乖離)戦略に基づいた 「オールインワン」型のトレーディン
この製品は 2026 年の市場向けに更新され、最新の MT5 ビルドに最適化されています。 価格更新のお知らせ: Atomic Analyst は現在 $99 で提供されています。 次の 30 件の購入 後、価格は $199 に上がります。 特別オファー: Atomic Analyst を購入後、私にプライベートメッセージを送ることで、 Smart Universal EA を無料 で受け取り、Atomic Analyst のシグナルを自動売買に変えることができます。 Atomic Analyst は、リペイントなし、再描画なし、遅延なしの Price Action トレーディングインジケーターで、手動取引、シグナルの明確化、EA 自動化のために設計されています。 User manual: settings, inputs and strategy.   &   User Manual PDF . 価格行動、強さ、モメンタム、マルチタイムフレーム方向、高度なフィルターを分析し、トレーダーがノイズを減らし、弱いセットアップを避け、より構造化された取引判断を行えるようにします。 このイ
伝説が帰ってきました:Entry Points Pro 10。 MQL5 Marketのトップ3に3年間入り続けた伝説的インジケーターの再始動です。 2つのバージョンで合計589件の高評価レビュー、毎日数千人のトレーダーが実際のトレードに使用し、デモのダウンロードは31,000件以上   MT4+MT5 。 私はこの5年間に寄せられたレビューをすべて読み、約束を並べる代わりに、その答えをバージョン10に組み込みました。1999年から相場に携わり、 誠実さ、自らの評判、そして顧客を大切にする 作者による製品です。 Entry Points Proのエントリーシグナルは、リペイント(再描画)を一切行いません。 そして今回初めて、これは作者の言葉ではなく検証可能な事実になりました。確定シグナルはローソク足の終値確定後にのみ表示され、自動テストで リペイントはゼロ と確認されています(EURUSD、XAUUSD、BTCUSDで2,486,568回の不変条件チェック、違反0件)。検証方法は公開されており、ストラテジーテスターでご自身で再現できます。 ご購入後は、必ずすぐにダイレクトメッセージでご
M1 SNIPER は使いやすいトレーディングインジケーターシステムです。M1時間足向けに設計された矢印インジケーターです。M1時間足でのスキャルピングのためのスタンドアロンシステムとして、また既存のトレーディングシステムの一部としても使用できます。このトレーディングシステムはM1時間足での取引に特化して設計されていますが、他の時間足でも使用できます。元々、この手法はXAUUSDとBTCUSDの取引用に設計しましたが、他の市場においても役立つと考えています。 インジケーターのシグナルは、トレンドの方向と逆方向に取引できます。インジケーターのシグナルを利用して両方向に取引するのに役立つ特別な取引テクニックをご紹介します。この手法は、特別な動的なサポートとレジスタンスの価格帯を利用することに基づいています。 ご購入後、M1 SNIPER矢印インジケーターをすぐにダウンロードできます。さらに、M1 SNIPERツールのすべてのユーザーに、以下のスクリーンショットに表示されているApollo Dynamic SRインジケーターを無料で提供しています。この2つのインジケーターを組み合わせることで
Zoryk Gold
Reda El Koutbane
5 (6)
割引は 24 時間後に終了します — 次の価格は$ 69 ZORYK — MetaTrader 5専用 XAUUSDシグナル・トレードプランニングシステム このような経験はありませんか。 ゴールドを分析し、エントリーを待ち、ようやくポジションを持った直後に価格が逆方向へ動く。 早すぎる決済をしてしまったり、Stop Lossを動かしたり、数秒迷っている間にチャンスを逃したりする。 その後、相場は自分が最初に予想していた方向へ進み、目標へ到達する。 問題は常に方向判断ではありません。 本当の問題は、明確な計画がなかったことです。 どこでエントリーすべきか。 どこでトレードの前提が無効になるのか。 近い利益を確保すべきか、より大きな値動きを待つべきか。 現在のsetupが本当に強いのか、それとも無理にトレードを探しているだけなのか。 ゴールドは非常に速く動きます。 正しい分析でも、明確なプランがなければ数秒で悪い判断に変わることがあります。 ZORYKは、その問題を解決するために開発されました。 ZORYKとは ZORYKは、MetaTrader 5とXAU
GoldenX Entryは、MT5向けのインジケーターであり、適応型Smart Entry Trendアルゴリズム、シグナルスコアリングシステム、マーケットレジーム検出機能、およびボラティリティフィルターを備えています。各シグナルには、計算されたエントリーレベル、3つのテイクプロフィット(TP1、TP2、TP3)、およびストップロスレベルが含まれます。本インジケーターは、異なる市場環境に適応するために設計された複数の分析レイヤー上に構築されており、マルチレイヤー分析システムと内蔵オプティマイザーおよび統計トラッキングシステムを組み合わせています。リスク・リワード(RR)指標および過去のトレード履歴に基づく定量分析を提供します。 使い始めは簡単です — 選択した時間足でオプティマイザーを実行し、そのままチャート上でインジケーターを使用します。 コア機能 GoldenX Entryは、シグナルエンジンとトレード管理機能、そして過去統計トラッキングを1つのチャートに統合しています: - 内蔵オプティマイザー: オプティマイザーはチャート上でワンクリックで実行できます。200通りのパラメー
Gold Entry Sniper – ゴールドスキャルピング&スイングトレード用プロフェッショナル多時間足ATRダッシュボード Gold Entry Sniper は、XAUUSDや他の銘柄向けに正確な 売買シグナル を提供する、MetaTrader 5用の高度なインジケーターです。 ATRトレーリングストップロジック と 多時間足分析ダッシュボード を搭載し、スキャルピングからスイングトレードまで対応します。 主な特徴と利点 多時間足シグナル分析 – M1、M5、M15 のトレンドを同時表示。 ATRベースのトレーリングストップ – ボラティリティに応じて動的に調整。 プロ仕様のチャートダッシュボード – シグナル状況、ATRレベル、回帰線、売買方向を表示。 明確な売買マーカー – 自動矢印とテキストラベル。 エグジットアラートとトレード管理 – 利益確定のための自動検出。 完全カスタマイズ可能 – パネル位置、色、フォント、ATR/回帰設定を調整可能。 ゴールド(XAUUSD)に最適化 – M1〜M15のスキャルピングに最適、FXや指数、暗号資産にも対応。 Gold Entry
SUPERHEROインジケーターは、「オールインワン」方式に基づいて設計された多通貨対応の取引システムです。このインジケーターは市場を独自に分析し、取引の開始および終了のタイミングに関するシグナルを提供します。ストップロス注文とテイクプロフィット注文を使用します。R:R比率は1:1です。 私は時折、このシステムのシグナルに基づいて自ら取引を行いますが、その結果は以下の通りです— ライブシグナル このシステムはスマートフォンにプッシュ通知を送信できるため、PCに縛られることなく「外出先」からでも取引を行うことができます。自己勘定取引を行う企業に最適です。 すべてのお客様への特典: このインジケーターをご購入いただいたすべてのお客様に、私から特別なユーティリティをプレゼントいたします。その内容は以下の通りです: 自動的にストップロス注文とテイクプロフィット注文を発注します 価格が目標水準に達すると、自動的に取引を決済します 指値注文による取引に対応しています 平均化取引モードに対応しています この優れた、しかも非常に便利なユーティリティをプレゼントとして受け取りたい場合は、SUPERHER
UZFX {SSS} スキャルピング・スマートシグナル v4.0 MT5は、変動の激しい市場において正確かつリアルタイムのシグナルを求めるスキャルパー、デイトレーダー、スイングトレーダー向けに設計された、リペイントのない高性能な取引インジケーターです。(UZFX-LABS)によって開発されたこのインジケーターは、価格行動分析、トレンド確認、スマートフィルタリングを組み合わせることで、すべての通貨ペアおよび時間軸において、高確率の売買シグナル、警告シグナル、トレンド継続の機会を生成します。 トレードの判断に迷うのはもうやめましょう。明確さ、正確さ、そして規律ある市場執行を求めるトレーダーのために設計された、体系的なシグナルシステムに従い始めましょう。 私のおすすめ* 最適な時間足:15分足以上。 {H1} が私のお気に入りです。そして、その成果は驚異的です…!! 主な機能の更新 • 自動売買シグナル検出 • 高度な反転認識ロジック • 市場反転の可能性に先立つ早期警告シグナル • トレンド継続確認シグナル • エントリー、ストップロス、TP1、TP2、TP3レベルを備えた組み込み型
Gann Made Easy   は、ミスター・ギャンの理論を使用した取引の最良の原則に基づいた、プロフェッショナルで使いやすい外国為替取引システムです。 W・D・ガン。このインジケーターは、ストップロスとテイクプロフィットレベルを含む正確な買いと売りのシグナルを提供します。 PUSH通知を利用して外出先でも取引可能です。 ご購入後、取引方法の説明と優れた追加インジケーターを無料で入手するには、私にご連絡ください! おそらく、ギャンの取引手法についてはすでに何度も聞いたことがあるでしょう。通常、ギャンの理論は初心者のトレーダーだけでなく、すでにある程度の取引経験がある人にとっても非常に複雑なものです。なぜなら、ギャンの取引手法は理論的にはそれほど簡単に適用できるものではないからです。私はその知識を磨き、最良の原則を私の外国為替インジケーターに組み込むために数年を費やしました。 このインジケーターは非常に簡単に適用できます。必要なのは、それをチャートに添付し、簡単な取引推奨事項に従うだけです。このインジケーターは常に市場分析の仕事を行い、取引の機会を探します。適切なエントリーポイントを検
AXIOM MATRIX MT5 ローンチ価格:$99 Axiom Matrix はローンチ価格 $99 でご利用いただけます。 最初の30件の購入後、価格は $199 に上がります。 ご購入後、手順のご案内と限定ギフトボーナスの受け取りのために、直接DMをお送りください。 Axiom Matrix は、MetaTrader 5 用のプロフェッショナルなマルチシンボル・マルチタイムフレーム市場スキャナー兼意思決定ダッシュボードです。 Market Watch をスキャンし、複数の時間足を分析し、複数のエビデンスエンジンを読み取り、最も強いチャンスを比較し、1つのクリーンなマトリックスダッシュボード内で最適な BUY、SELL、WAIT、またはブロック状態を表示します。 私が Axiom Matrix を作った理由は、市場スキャンという重い作業を代わりに行ってくれる1つのツールが欲しかったからです。 RSI だけを確認したくありませんでした。 次に MACD だけ。 次に移動平均線。 次に出来高。 次にボラティリティ。 次にサポートとレジスタンス。 そして、1つのトレードアイデアを作るた
FiboSniper Pro – プロフェッショナル・マルチフィルター Fibonacci Grid トレーディングシステム FiboSniper Pro は、Fibonacci Envelopes と ADX、EMA、RSI、ATR、Time Filter などの多層フィルターを組み合わせた高度なテクニカル分析インジケーターシステムです。フィルタリングされたエントリー機会の特定をサポートし、ATR のボラティリティに基づいて Stop Loss と Take Profit レベルを自動的に計算します。特に M5 スキャルピング戦略を重視するトレーダー向けに設計されています。 購入後、Auto Trader X を使用して FiboSniper Pro のシグナルを自動売買する方法について、手順をご希望の場合は私までご連絡ください。 Auto Trader X による自動売買に対応: [Auto Trader X] ユーザーガイドと推奨セットファイルはこちら: [Click here] FiboSniper Pro MQL5 公開チャンネルに参加して、アップデートやニュースをご確認くだ
Power Candles V3 - 自己最適化型強弱インジケーター Power Candles V3は 、通貨や銘柄の強さを、適用されたすべてのチャート上で実行可能なトレードプランに変換します。単にローソク足を色分けするだけでなく、バックグラウンドでリアルタイムの自動最適化を実行し、目の前の銘柄に対して最適なストップロス、テイクプロフィット、およびシグナルの閾値を提示します。ワンクリックで実取引に適用でき、エントリーポイント、ストップロス、テイクプロフィットのラインが正確な価格位置にチャート上に表示され、方向性を示すアラートがリアルタイムで発動します。 このツールは、Stein Investmentsのエコシステムの一部です。  18種類以上のツールをすべて閲覧し、AIを活用したセットアップの推奨事項を入手し、  https://stein.investments でコミュニティに参加しましょう クローズしたバーごとに3,000回以上のトレードシミュレーション。9つの強さの状態。2つの戦略を並行してテスト。勝率の高い設定をワンクリックで適用。 なぜこれが必要なのか ほとんどの強
トレンドキャッチャーインジケーター トレンドキャッチャーインジケーターは、開発者独自の適応型トレンド分析指標を組み合わせることで、市場価格の動きを分析します。短期的なノイズを除去し、根底にあるモメンタムの強さ、ボラティリティの拡大、価格構造の挙動に焦点を当てることで、真の市場方向性を特定します。また、移動平均線、RSI、ボラティリティフィルターなどの平滑化およびトレンドフィルタリング機能を備えたカスタマイズ指標も使用します。 実際の運用状況のモニタリングやその他の製品については、こちらをご覧ください: https://www.mql5.com/en/users/mechanic/seller ご注意ください。私はTelegramでEAや設定を販売していません。詐欺です。すべての設定はブログで無料で公開しています。 重要!ご購入後すぐにご連絡ください。手順とボーナスをお送りします!
SkyHammer Signal Pro Entry、SL、TP レベルを固定表示する、プロ仕様のノーリペイント・トレンドシグナルインジケーター SkyHammer Signal Pro は、明確で固定され、検証可能なシグナルを求めるトレーダー向けに設計された、構造的なトレンド・モメンタム系シグナルインジケーターです。 特に M1 と M5 などの短期時間足で最も効果を発揮します。 このインジケーターは、天井や底を予測するためのものではありません。シグナルを出す前に、確認された市場構造、トレンド方向、モメンタムの強さ、健全なボラティリティ、そしてターゲットまでの十分な値幅を確認します。 主な機能 固定シグナルメカニズム シグナルが確認されると、矢印、Entry、Stop Loss、TP1、TP2 の各レベルはチャート上に永久的に固定されます。 その後のローソク足の動きによって、シグナルが消えたり、移動したり、変更されたりすることはありません。 これにより、トレーダーは各シグナルを明確に確認でき、リアルタイム相場中にシグナルが消えるという一般的な問題を避けることができます。 完全な過去シ
Crystal Heikin Ashi Signals - Professional Trend & Signal Detection Indicator Advanced Heikin Ashi Visualization with Intelligent Signal System for Manual & Automated Trading Final Price: $149 ---------> Price goes up $10 after every 10 sales . Limited slots available — act fast . Overview Crystal Heikin Ashi Signals is a professional-grade MetaTrader 5 indicator that combines pure Heikin Ashi candle visualization with an advanced momentum-shift detection system. Designed for both manual traders
GEM Signal Pro GEM Signal Pro は、MetaTrader 5 向けのトレンドフォロー型インジケーターです。より明確なシグナル、より整理されたトレードセットアップ、そして実用的なリスク管理をチャート上で確認したいトレーダーのために設計されています。 単純な矢印だけを表示するのではなく、GEM Signal Pro はトレード全体の考え方を、より見やすく分かりやすい形で表示します。条件が確認されると、インジケーターはエントリー価格、ストップロス、利確目標をチャート上に表示し、トレードセットアップをより効率的に確認できるようにします。 動作の仕組み このインジケーターは、まず内部ロジックに基づいて有効なシードシグナルを検出します。 確認条件が満たされると、GEM Signal Pro はチャート上に完全なセットアップを表示します。これにより、トレーダーはトレード構造をより明確に把握し、手作業による分析を減らすことができます。 チャート上のトレードレベル 確認済みシグナルに対して、GEM Signal Pro は以下を表示できます。 エントリー価格 ストップロス テ
The Oracle Pro
Ottaviano De Cicco
5 (1)
The Oracle Pro:MT5向け合成マルチタイムフレーム・バイアスエンジン ️ サマー・ローンチ・オファー — The Oracle Pro を 199 USD で(早期購入者向け)。価格は普及に応じて上昇します。最終価格 399 USD。 The Oracle Pro は、要求の高いプロのトレーダーのために作られた MetaTrader 5 向けのプレミアム・マルチタイムフレーム バイアスエンジン です。ひとつの問いに規律をもって答えます。すなわち、各タイムフレームの現在の方向バイアスは何か、その強さはどれほどか、そしてタイムフレーム同士はどれだけ一致しているか。すべては確定足のみで計算され、リペイントはありません。 The Oracle Pro はマルチファクター・コンセンサス・システムです。独自のインジケーターと最適化されたアルゴリズムを単一の高度なコンセンサス・ベクトルに統合し、それを単一のインジケーター・インスタンス内で現在足と上位足のスタックにわたって読み取ります。複数のチャートにばらばらのツールを積み重ねる代わりに、です。 これは Oracle コンセンサス手法
Azimuth Pro
Ottaviano De Cicco
5 (7)
Azimuth Pro V2:MT5向けシンセティック・フラクタル構造分析と確認済みエントリー 概要 Azimuth Pro は Merkava Labs によるマルチレベルスイング構造インジケーターです。4つのネストされたスイングレイヤー、スイングアンカーVWAP、ABCパターン検出、3タイムフレーム構造フィルタリング、そして確定バーでの確認済みエントリー — 1つのチャートで、ミクロスイングからマクロサイクルまでを網羅するワークフロー。 これはブラインドシグナル製品ではありません。ロケーション、コンテキスト、タイミングを重視するトレーダーのための構造ファーストワークフローです。 ️ サマーセール — 夏至とThe Oracle Proの発売を記念して、Azimuth Proが30%オフ。現在279 USD(通常399 USD)。期間限定の夏季オファー。 1. V2での変更点 シンセティック・マルチタイムフレームエンジン 上位タイムフレーム分析をMeridian Proと同じ独自のシンセティックアーキテクチャで一から再構築。よりクリーンなHTFコンテキスト、安定したライブ動作、
この製品は 2026 年の市場向けに更新され、最新の MT5 ビルドに最適化されています。 価格更新のお知らせ: Smart Price Action Concepts は現在 $200 で提供されています。 次の 30 件の購入 後、価格は $299 に上がります。 特別オファー: 購入後、私にプライベートメッセージを送ることで、 無料ボーナス + ギフト を受け取ることができます。 まず、このトレーディングツールはリペイントなし、再描画なし、遅延なしのインジケーターであり、プロフェッショナルな取引に最適であることを強調しておきます。 [Online course] ,   [User Manual]  ,  [How to Install]  ,   [PDF] Smart Price Action Concepts Indicator は、初心者から経験豊富なトレーダーまで使える非常に強力なツールです。20 種類以上の便利なインジケーターを 1 つにまとめ、Inner Circle Trader Analysis や Smart Money Concepts Trading S
ARICoin is a powerful trading companion designed to generate high-probability entry signals with dynamic TP/SL/DP levels based on volatility. Built-in performance tracking shows win/loss stats, PP1/PP2 hits, and success rates all updated live. Key Features: Buy/Sell signals with adaptive volatility bands Real-time TP/SL/DP levels based on ATR Built-in MA Filter with optional ATR/StdDev volatility Performance stats panel (Success, Profit/Loss, PP1/PP2) Alerts via popup, sound, push, or email Cust
Reversion King Indicator
Eugen-alexandru Zibileanu
5 (6)
新たな王者が登場 - インジケーター + 注文管理表示(TP1 + TP2 + TP3)+ オプションのTelegramシグナル送信機能付き(無料) (完全なトレード&シグナルシステム) ゴールド向け最高のEA: Gold Slayer このインジケーターには、高度な戦略、カスタマイズ可能な注文管理システム、そしてエンベロープ拡張を組み合わせた平均回帰システムが搭載されています。さらに、RSIなど複数のインテリジェントな確認フィルターによって、高確率の反転エントリーをBUY・SELLシグナルとして検出します。 単にトレードを学ぶだけでなく、複数ポジションを効果的に管理し、過去に利益を出しているオープンポジションで損失トレードをカバーする方法も学べます。 M5向けに構築・最適化されており、流動性が高くシグナルの精度が安定しているBTCUSDとXAUUSDで優れたパフォーマンスを発揮します。 このインジケーターは、ATRを基に自動計算されたエントリー、ストップロス、テイクプロフィットレベルを備えた明確なLong・Shortシグナルを提供するため、リスク管理が最初から組み込まれています。 マ
Ace Trend
Mikhail Sergeev
5 (3)
私たちはあなたにトレンド取引の世界でゲームのルールを変える革命的な指標を提示します。 指標は、パフォーマンスを再考し、前例のない高さにあなたの取引経験を高めるように設計されています。 私たちの指標は、競合他社とは一線を画す高度な機能のユニークな組み合わせを誇っています。 "実質の価格設定要因"の先端技術は最も困難で、揮発市況の最高の安定性を保障する。 不安定なパターン、壊れた指標に別れを告げ、意識的で制御された取引を歓迎します。 指標は単なる美しい絵ではありません! 指標は、トレーダーの側にオッズをシフトし、それによって利益を得る必要があります。 インジケータ信号(完全自動モード)に基づいて取引結果に慣れる: https://www.mql5.com/ja/signals/2339244 AceTrendは、rbtiバージョンによるトレンド指標のランキングで第一位にランクされています。AceTrend-取引における最大の収益性と制御。 私たちの指標は、歴史ではなく、現在の市場相場に基づいて収益性を強調しています。 革命に参加-あなたの取引経験の可能性のロックを解除! インジケーターは、
Quant Direction は、3次元の市場分析ツールです。完全に客観的なアルゴリズムベースの市場分析を提供し、様々なパラメータにわたる正確なパーセンテージ偏差を同時に算出します。高度なAI搭載モデリングツールで開発され、厳密なテストを経て開発されたこのアルゴリズムは、かつてない精度で市場を分析するように設計されています。プラットフォーム上では、あらゆる通貨ペアや金融商品を分析できます。 短期取引、デイトレード、スイングトレードなど、どのような取引スタイルに も、Quant Directionは最適な選択肢です。 オペレーターの本当の利点 Quant Directionの真の利点は、感情、眼精疲労、過剰分析を完全に排除できる点にあります。方向性を探るために何十ものチャートを手作業で精査したり、自分の好みを常に疑ったりする必要がなくなります。このシステムは、8つの時間間隔(5ヶ月から月単位まで)をミリ秒単位で処理します。あらゆる瞬間に市場を支配している主体を正確に明らかにし、常に成功確率が最も高い方向で取引できるようにします。 市場分析の3つの側面 このアルゴリズムは市場を3つの
作者のその他のプロダクト
NeuronBreakout identifies volatility compression before the market expands. It waits for price to contract, anchors a breakout range to the most recent confirmed swing, tracks that range until price closes beyond it, then projects a complete trade with entry, ATR-based stop loss, and three R-multiple profit targets. Every completed breakout remains frozen on the chart, allowing you to review past setups exactly as they formed. It is an indicator for chart analysis only: it draws on the chart, it
Cardwell Range Analyze reads trend from the range the RSI holds, not from a fixed overbought or oversold line. Andrew Cardwell's observation was that in a genuine uptrend the RSI oscillates inside a higher band and rarely breaks below it, while in a downtrend it works a lower band and rarely breaks above — so the band the RSI is respecting is itself the trend signal. This indicator turns that reading into a confirmed regime, colours the chart by it, and projects a full ATR trade the moment the r
SMF Cloud is a clean, lightweight chart indicator that visualizes directional market flow using an adaptive trend “cloud”, dynamic volatility bands, retest markers, and a TradingView-style strength gauge. It is designed for fast decision-making: identify trend shifts, measure trend strength, and spot pullback/retest opportunities at a glance. Key Features Smart Money Flow Trend Cloud Smooth trend baseline (EMA or ALMA) with optional additional smoothing. Clear bullish/bearish flow visualization
NeuronLiquidity is a chart-overlay indicator for MetaTrader 5 from Neuron Systems that maps where liquidity rests and marks the exact bar where it is taken. It is an indicator only: it draws on your chart and raises alerts. It does not place trades, it does not send buy or sell orders, and it does not manage positions or accounts. Native MQL5, no DLLs, no external dependencies. Works on any symbol (forex, gold and metals, indices, crypto) and any timeframe. === HOW IT FINDS LIQUIDITY POOLS === A
Chandelier Exit PRO A precise and reliable trend-following indicator for MetaTrader 5 Chandelier Exit PRO is a professionally engineered implementation of the Chandelier Exit indicator, designed to closely match the original version in both logic and signal behavior. It provides clear trend direction, dynamic stop levels, and well-timed reversal signals, making it suitable for traders who require consistency and accuracy in their decision-making. Core Features Accurate Logic This indicator repli
FREE
*This is TradingView indicator converted to mql4* The SuperTrend V indicator is a popular technical analysis tool used to identify trends and potential trend reversals in financial markets. It is based on the concept of the SuperTrend indicator but incorporates additional features and variations. The SuperTrend V indicator uses a combination of price action and volatility to determine the trend direction and generate trading signals. Here are the key components and features of the indicator: Ca
FREE
Trade. Allows you to perform basic trading operations in one click directly from the chart. Trading operations: Open Buy and Sell market positions with one click. Specify lot size manually before opening a trade. Set Stop Loss and Take Profit as price levels . Stop Loss and Take Profit are automatically initialized at a fixed distance from the current market price (default: ±50 pips , symbol-aware). Fully supports Forex, Metals (XAUUSD), Indices, and other MT5 symbols with correct price formatti
FREE
*This is tradingview indicator converted to mql5* The Trend Magic Indicator is a popular technical analysis tool used to identify the direction of a market trend and potential trend reversals. It is a versatile indicator that can be applied to various financial instruments and timeframes. The Trend Magic Indicator consists of a combination of moving averages and a volatility-based filter. It aims to smooth out price fluctuations and provide a clearer visualization of the underlying trend. Here
FREE
*This is tradingview indicator converted to mql4* The CM Slingshot System Indicator is a trading tool that aims to identify potential trade setups based on market volatility and price action. It is designed to help traders spot entry and exit points in trending markets. The CM Slingshot System Indicator combines multiple indicators and techniques to generate trading signals. Here are the key features and components of the indicator: Bollinger Bands: The indicator incorporates Bollinger Bands, w
*This is tradingview indicator converted to mql4* The Chandelier Exit Indicator is a popular technical analysis tool developed by Chuck LeBeau. It is designed to help traders identify potential exit points for their trades based on market volatility and the concept of trailing stops. The Chandelier Exit Indicator consists of three main components: Average True Range (ATR): The indicator utilizes the Average True Range, which measures market volatility. The ATR calculates the average range betwe
*This is tradingview bot converted to mql4* The UT Bot Alert Indicator is an advanced technical analysis tool designed to help traders optimize their trading performance. This innovative indicator is based on the proven UT Bot system, which utilizes multiple indicators to deliver accurate signals that can help traders make better decisions. The UT Bot Alert Indicator provides a range of features that can help you stay on top of market trends and capitalize on opportunities. Here are some of its
UT Bot Alerts is a technical indicator for MetaTrader 5 that highlights potential directional changes based on momentum conditions. The indicator marks signal points directly on the chart and can generate optional notifications for convenience. The signal generation logic can operate in two modes: Closed-bar mode: signals are confirmed only after the bar closes. Live-bar mode: signals are displayed during the formation of the current bar. Both modes are available depending on the user's preferr
*This is trading view indicator converted in mql5* The HA Market Bias Indicator is a popular tool used in trading and technical analysis, designed to help traders identify market bias and potential trend reversals. It is commonly used in conjunction with candlestick charts and provides valuable insights into market sentiment. The indicator is based on the Heiken Ashi (HA) candlestick charting technique, which aims to filter out market noise and provide a smoother representation of price action.
The trendlines with breaks indicator return pivot point based trendlines with highlighted breakouts. Users can control the steepness of the trendlines as well as their slope calculation method. Trendline breakouts occur in real-time and are not subject to backpainting. Trendlines can however be subject to repainting unless turned off from the user settings. The indicator includes integrated alerts for trendline breakouts. Any valid trendlines methodology can be used with the indicator, users
Note: Kindly inbox me for setfile AI Range Breaker watches a time window you choose each day, marks that session’s high and low , then automatically places pending buy/sell orders just outside the range. If price breaks out, the EA manages the trade with breakeven, candle-based trailing, optional partial close, and a single scale-in once price moves in your favor. If nothing happens, the pending orders are removed after a set number of candles—keeping your chart and account clean. Best use Work
This indicator builds a Pivot Anchored Volume Profile (VAP/VPOC approximation using tick volume) and automatically splits the profile into pivot-to-pivot segments , giving you a clean, TradingView-like view of where volume concentrated during each swing. It draws a horizontal histogram for every segment and highlights the Value Area and key levels, making it easy to spot acceptance/rejection zones, high-volume nodes, and potential support/resistance. Key Features Segmented Volume Profile (Pivot-
NeuronScanner - Multi-Symbol Multi-Timeframe Confluence Scanner for MetaTrader 5 NeuronScanner is an on-chart scanner and dashboard for MetaTrader 5. It shows a colour-coded grid of confluence scores across many symbols and timeframes on one panel, so you can review a whole watchlist at once. Works on any symbol: forex, metals, gold, indices and crypto. HOW IT WORKS For every symbol and timeframe in the grid, NeuronScanner reads eight indicators and turns each into a simple vote - bullish, be
NeuronStructure reads market structure the way a desk does and labels every event on the exact closed bar that confirmed it, so what you see now is what you would have seen then. It is an indicator for chart analysis only: it draws on the chart, it does not place, modify or close trades, it does not send orders, and it does not manage positions or accounts. It is the market-structure companion to NeuronLiquidity, built to sit alongside it: structure tells you the framework and bias, liquidity te
NeuronSessions maps the four trading sessions, Sydney, Tokyo, London and New York, directly on your chart and keeps the read honest: a completed session is frozen and never redrawn, only the live one develops. It is an indicator for chart analysis only: it draws on the chart, it does not place, modify or close trades, it does not send orders, and it does not manage positions or accounts. It is the sessions companion to NeuronLiquidity and NeuronStructure, and is built to sit alongside them: stru
NeuronSniper is a complete ICT (Inner Circle Trader / smart-money) workspace and setup engine for MetaTrader 5 from Neuron Systems. It maps the whole picture, market structure, liquidity, order blocks, fair value gaps and premium/discount, and then marks one strict, high-quality reversal setup with a fixed risk:reward plan. It is an indicator for chart analysis only: it draws on the chart, it does not place, modify or close trades, it does not send orders, and it does not manage positions or acc
NeuronFlow is a smart-money trend-continuation toolkit for MetaTrader 5 from Neuron Systems. It reads market structure and then, on every confirmed break, marks a continuation setup, a pullback into the fresh order block or fair value gap left by the move, in the direction of the trend, with a fixed risk:reward plan. It is an indicator for chart analysis only: it draws on the chart, it does not place, modify or close trades, it does not send orders, and it does not manage positions or accounts.
NeuronTrend is a premium adaptive trend engine for MetaTrader 5 from Neuron Systems. It draws one clean, non-repainting baseline that colours the trend blue (up) or red (down), surrounds it with a translucent neon trend cloud, and reads the trend across timeframes in a live dashboard. It is an indicator for chart analysis only: it draws on the chart, it does not place, modify or close trades, it does not send orders, and it does not manage positions or accounts. Native MQL5, no DLLs, non-repaint
NeuronCloud is a premium moving-average cloud for MetaTrader 5 from Neuron Systems. A fast and a slow moving average fill a translucent neon cloud behind the candles and colour it blue (up) or red (down), while a multi-MA ribbon between them shows when a trend is fanning out or compressing into a squeeze. It is an indicator for chart analysis only: it draws on the chart, it does not place, modify or close trades, it does not send orders, and it does not manage positions or accounts. Native MQL5,
NeuronIchimoku is a premium Ichimoku Kinko Hyo indicator for MetaTrader 5 from Neuron Systems. It draws the full classic Ichimoku system, projects the cloud forward of price, and scores every Tenkan/Kijun cross with a transparent five-factor confidence engine so you can see, at a glance, which crosses agree with the bigger picture and which do not. It is an indicator for chart analysis only: it does not place, modify or close trades, it does not send orders, and it does not manage positions or a
NeuronQuant is a premium quant analytics indicator for MetaTrader 5 from Neuron Systems. It reads the chart with the kind of statistical tools common in quantitative analysis: a forward expected-move range, realized volatility, a market-regime read and a standardized z-score. It is an indicator for chart analysis only: it does not place, modify or close trades, it does not send orders, and it does not manage positions or accounts. Native MQL5, no DLLs, non-repainting closed-bar logic. Works on a
NeuronPropGuard — prop-firm rule compliance & trade management for MT5 Most funded accounts are not lost on bad entries — they are lost on a single trade that crosses the daily-loss line or the max-drawdown floor. NeuronPropGuard keeps those rules in front of you in real time, sizes every trade against the room you actually have left, and can step in before a buffer is breached. It reads only your own MetaTrader 5 account — no external feed, no signals, no profit promises. It cannot guarantee co
NeuronDivergence — multi-oscillator confluence divergence engine for MT5 A single oscillator showing divergence is a hint; three agreeing at once is a setup. NeuronDivergence reads RSI, MACD and Stochastic together, finds regular and hidden divergence on each, and only marks a signal when enough of them agree — then scores that agreement 0–100 with a confidence engine and draws it on your chart with entry, stop and target levels, a command dashboard and alerts. It is non-repainting and closed-ba
NeuronCopier — a local MT5 trade copier that actually thinks Most copiers blindly mirror lots. NeuronCopier verifies the symbol by price, sizes each trade by risk, scores the master it is copying, protects the receiving account against prop-firm and drawdown breaches, and ships with a full on-chart trade manager. It mirrors trades from one MetaTrader 5 account to one or many others running on the same PC , instantly and reliably, through the shared terminal data folder. 100% native MQL5 — no DLL
NeuronReplay — replay each of your closed trades one by one, bar-by-bar, and analyze exactly what happened Your trade history is just a list of numbers. NeuronReplay turns it into film. It lists every closed trade in a dashboard; click any one and it re-plays that single trade candle-by-candle on its own chart , exactly like stepping through the MetaTrader 5 Strategy Tester — but scoped to a real trade you already took. You see the entry, the stop, the target and the exit drawn in, a floating P&
NeuronJournal - Trading Journal and Analytics Dashboard for MetaTrader 5 NeuronJournal reads your own MetaTrader 5 closed-trade history and presents it as an analytics dashboard inside the terminal. It shows your performance metrics, a calendar of daily results, a quant-style score of your trading, and a detailed breakdown of every trade and every day, with a built-in notes journal. It is an analytics and journaling tool only. It reads your account and draws. It does not give trading signals and
フィルタ:
レビューなし
レビューに返信