Session Momentum Dashboard

  • インディケータ
  • Vincent Jose Proenca
    Vincent Jose Proenca
    5 (5)
    私はトレーダーとして10年以上の経験があり、主にCFDを専門としています。トレーディングの魅力は、論理性・規律・そして意思決定を簡単にするツールを作り出すことにあります。自分の手法に合うインジケーターが見つからなかったため、必要に迫られて自作を始め、次第にそれが楽しみになりました。
    最初に開発したツールの一部は、Custom Box と Daily Bar Number です。これらのインジケーターは理論上の試作品ではなく、日常使用を目的に設計され、実際の市場環境でテスト・改良を重ねてきました。その結果、実用的で統合しやすく、情報過多に陥ることなく素早い判断を支援するツールが生まれました。
  • バージョン: 1.1
  • アップデート済み: 7 12月 2025
  • アクティベーション: 5

Session Momentum Dashboard – 未来型トレーディング分析ツール

アジア/ロンドン/ニューヨークの主要3セッションを分析し、Kill Zone検出、アジアレンジブレイクアウト、モメンタムスコアをリアルタイムで表示するプロフェッショナルダッシュボード。

Session Momentum Dashboard

ICT/Smart Money トレーダー向けのオールインワン市場セッション監視ツール。

主な機能:

主要3セッション分析

アジア、ロンドン、ニューヨークセッションのリアルタイムステータス。

Kill Zone検出

  • ロンドン Kill Zone(7:00–9:00)

  • ニューヨーク Kill Zone(12:00–14:00)
    自動アラート付き。

アジアレンジブレイクアウト

  • アジアレンジのグラフィカル表示

  • 上方向/下方向のブレイクアウト検出

モメンタムスコアリング

  • セッションごとのRSIベースのプログレスバー

出来高分析

  • 出来高 vs 平均の比率

  • 分類:LOW / NORMAL / HIGH

トレードシグナル

以下が揃ったときに強力なシグナル:
Kill Zone + Breakout + Momentum

ロンドン/NYオーバーラップ

高ボラティリティ時間帯を自動検出。

カスタマイズ可能なアラート:

  • Kill Zone への突入

  • アジアレンジのブレイクアウト

  • 高モメンタム検出

  • ポップアップ/音声/プッシュ通知対応

未来的なデザイン:

  • シアン/マゼンタのネオンテーマ(カスタム可能)

  • コンパクトで読みやすいインターフェース

  • 位置とサイズを調整可能

カスタマイズ可能なパラメータ:

  • セッション時間(GMT)

  • モメンタム閾値(高/低)

  • ATR/RSI/出来高の期間

  • カラー設定全てカスタム可能

最適な用途:

  • ICT/Smart Money Concepts トレード

  • Kill Zone スキャルピング

  • アジアレンジブレイクアウトによるスイングトレード

  • マルチセッション分析


おすすめのプロダクト
SR Edge
Disanayaka Pindakala Mudiyanselage Supun Priyanga Bandara
SR Edge – Smart Support & Resistance Entry Assistant for XAUUSD SR Edge is a smart trading assistant designed for traders who want cleaner entries with the help of support and resistance structure, trend direction, and retracement-based confirmations. This indicator is built to reduce blind entries and help traders focus on higher-quality opportunities. Instead of giving random buy and sell signals everywhere, SR Edge is designed to wait for market direction, watch for retracements, and highligh
E2C Lines
Eduardo Cristian De Carvalho
Descubra o poder do nosso indicador de alta precisão, projetado para identificar as regiões de alvo e exaustão de qualquer ativo. Testado e validado por mais de 3 anos nos mercados de mini dólar e mini índice, ele oferece confiabilidade e eficácia incomparáveis. Transforme sua estratégia de trading e alcance novos patamares de sucesso com nossa ferramenta inovadora.
This indicator shows external bars ("Aussenstäbe") in the chart in candle form. The colors of the candles can be set individually. Also different colors for bearish and bullish bars are possible. In addition, the color of the wicks or outlines is also adjustable. Outside bars are mentioned e.g. by Michael Voigt in the book "Das große Buch der Markttechnik". All other candles are inner bars.
Timer Pro
Juan Pablo Sanchez Correa
The Timer PRO indicator shows a countdown for the closing of the current candle on the main chart. Main Features: Main Timer: Shows the remaining time for the current candle. Changes to alert color (red) when there are 10 seconds or less remaining. It is activated/deactivated with the 'T' key. Multitemporal Panel (MTF): A floating panel that displays countdowns for multiple timeframes simultaneously. When you click on a timeframe in the panel, that specific chart opens. It is activated/deactiv
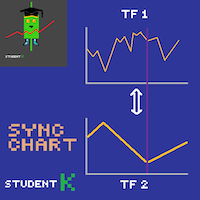
--- StudentK Sync Chart --- 1. Move charts at the same time 2. Cross check among different Symbols and Timeframes 3. Plan your own trading strategies --- Context --- StudentK is not indicated as a master or K Sir for knowledgeable person who claims for winning all the time. (But lots of traders should know the fact that it is rarely truth, especially in fluctuated period of time) StudentK is a group of years-experienced traders who want to share amazing tools in Free and Paid versions. Aiming
Gabus Niveles
Gabriel Antonio Diaz Quevedo
Niveles G: Institutional Levels & Volume Profile Map The Edge of Professional Trading Niveles G is not just another indicator; it is a comprehensive mapping tool that automates the identification of high-relevance institutional zones. Professional traders and algorithms don't react to random prices—they react to specific liquidity anchors. Niveles G plots these anchors automatically, keeping your chart clean and your strategy focused. Why These Levels Are Crucial? In trading, these levels repres
No Wick Candle Scanner is a powerful, lightweight tool built for MetaTrader 5 designed to isolate pure market momentum. In trading, candles that close without an upper or lower tail (wick) represent absolute dominance by buyers or sellers. This indicator scans your charts in real-time, instantly flagging these high-probability momentum bars with clean visual markers, allowing you to catch strong trend continuations and sudden breakouts with ease. Key Advantages & Features: 6-in-1 Filtering Matr
FREE
New Trend Alerts finds new trends at the changing bar very quickly. If the trend has enough power and a quality up/down angle, then the indicator sends multiple alarms to alert you: via email, mobile notification, alert window and alert sound. All of these different alarms are optional, and you can choose which ones you would like to use. The indicator calculates the derivative of the price chart to reveal the slope of price curve and its sign changes. Red bars indicate a positive sign or uptre
Ritz SMC QUANTUM PRO – Ultimate Institutional Engine is an advanced, all-in-one institutional trading indicator designed for MetaTrader 5. Engineered by Ritz_EANEHA, this tool fuses the precision of Smart Money Concepts (SMC), the depth of Advanced Volume Profile, VWAP metrics, and KAMA-driven dynamic momentum into a single, lag-free chart engine. Designed for professional traders, it eliminates chart clutter through a proprietary "Clean Chart Protocol," automatically managing expired and miti
Haven HTF Candle — あなたのチャートに上位足のパワーを Haven HTF Candle のご紹介 — 上位足(HTF)のローソク足をメインチャートに直接表示する強力なツールです。ウィンドウを常に切り替えるのをやめ、真の市場コンテキストを把握し始めましょう。これは、十分な情報に基づいた取引決定を下すための基盤となります。 その他の製品 -> こちら 。 主な機能と「Power of 3」コンセプト 「Power of 3」(AMD)コンセプトに基づく分析: インジケーターは HTFローソク足の始値 を明確に表示します。これはこの戦略の重要なレベルです。下位足にいながら、アキュムレーション(Accumulation)、マニピュレーション(Manipulation, Judas Swing)、ディストリビューション(Distribution)の各フェーズを簡単に特定できます。 トレンドの即時評価: 現在のタイムフレームでの動きが、より大きな全体像の中で推進波なのか調整波なのかを素早く理解できます。 視覚的な利便性: HTFローソク足の位置、色、数を完全にカスタマイズして
FREE
機関投資家向けボリューム分析ツール [tambangEA] 問題点 多くのトレーダーは、市場分析にあまりにも多くのツールを個別に使用しています。 ボリューム指標、VWAP指標、サポート・レジスタンス指標、モメンタム指標、そしてトレードコンテキスト指標など、様々な指標を駆使しています。その結果、チャートは情報過多になり、シグナルは混在し、意思決定は遅くなり、エントリーも遅れてしまいます。 標準的なボリューム分析ツールには、重要なギャップが存在します。市場の活動状況は示せますが、以下の点を明確に説明することはできません。 市場がどの価格水準を受け入れているのか、 バリューが集中している場所はどこか、 不均衡が拡大している場所はどこか、 ブレイクアウト圧力は本物なのか、 そして現在のリスク状況はトレンド継続を示唆しているのか、それとも反転を警告しているのか。 真剣なトレーダーにとって、これは実務上の問題となります。情報が多すぎる一方で、構造が不十分なのです。 解決策 機関投資家向けボリューム分析ツール [tambangEA] は、市場構造を明確な視覚的意思決定フレームワークへと変
MTF Levels And Moving Averages is a professional indicator designed to identify key support and resistance levels across multiple timeframes. The tool helps traders locate precise entry and exit points by analyzing market structure and price action patterns. Key Features The indicator provides multi-timeframe analysis covering H1, H4, D1, and W1 periods simultaneously. It identifies supply and demand zones where price typically reacts, using color-coded visualization to distinguish between dif
SSL Channel Indicator MT5を紹介します。これは価格トレンドのダイナミクスを可視化することで、取引の精度を向上させるために設計された強力なツールです。このインジケーターは、シンプルでありながら効果的な二重SMAアプローチを通じてトレンドの反転と継続を特定しようとするトレーダーに最適です。 革新的なフリップ技術を利用することで、SSL Channel Indicator MT5は明確な視覚信号を提供し、さまざまな市場条件でタイムリーな取引判断を下すのに役立ちます。デイトレーダーでも長期投資家でも、このインジケーターは取引戦略を大幅に改善することができます。 MQL製品のインストールガイド | MT4/MT5で購入したMQL製品を更新する | 一般的なトラブルシューティングガイド | インジケーター設定 / ガイド 主な特徴 バッファ統合: インジケーターの値をアクセス可能なバッファとして公開し、Expert Advisorによる自動取引で直接読み取ることができます。 ポップアップアラート: 信号イベントでMetaTraderアラートポップアップを発生させ、取引セット
ProbAlgo
Marius Ovidiu Sunzuiana
ProbAlgo is an institutional‑grade trading indicator engineered to mirror the analytical discipline used inside major banks and hedge funds. Its core strength is not just detecting when to trade — but knowing when not to trade. By combining probabilistic modeling, volatility diagnostics, liquidity behavior, and structural market filters, ProbAlgo isolates the rare moments when conditions genuinely support a high‑quality entry. Instead of chasing every move, ProbAlgo evaluates the market through
Chart Candle Timer Pro
Alireza Gholamreza Mohammadi
Chart Candle Timer Pro is a professional candle countdown panel for MetaTrader 5. It displays a compact, elegant dashboard on your chart that shows the time remaining until the next candle opens, along with essential market data at a glance. The panel updates every 200 milliseconds, ensuring a smooth and accurate countdown. It works on all standard timeframes from M1 to MN and adapts its time format automatically, showing HH:MM:SS for higher timeframes and MM:SS for shorter ones. User Guide
FREE
Go Ferramentas
Fabio Oliveira Magalhaes
This product is a set of tools that help the trader to make decisions, bringing information from different categories that complement each other: trend, support / resistance and candle patterns. It also has a panel with information about the balance. The trend has two different calculations and is shown as colored candles. Strategy 1 is longer, having 3 different states: up, down and neutral trend. Strategy 2 has a faster response and has only 2 states: up and down trend. Support and resistance
Introduction to X3 Chart Pattern Scanner X3 Cherart Pattern Scanner is the non-repainting and non-lagging indicator detecting X3 chart patterns including Harmonic pattern, Elliott Wave pattern, X3 patterns, and Japanese Candlestick patterns. Historical patterns match with signal patterns. Hence, you can readily develop the solid trading strategy in your chart. More importantly, this superb pattern scanner can detect the optimal pattern of its kind. In addition, you can switch on and off individu
N/B: All our product purchase comes with our free ‘’DAILY   SCALPER EA’’ Whatsapp Developer for yours after successful purchase   THE ARCHITECTURE OF A PERFECT TRADING SYSTEM Let me break down how all the components in this Ultimate Semafor system work together like a Swiss watch mechanism. This is a multi-layered confirmation system where each piece validates the others.   SYSTEM PHILOSOPHY: "TRIPLE CONFIRMATION" This system follows a simple but powerful principle: No single indicator can
DhanrangSMC
Dharagauri Niteshkumar Rangani
SMC Indicator for MT5 – Trade Like Institutions Unlock the power of institutional trading with the Smart Money Concepts (SMC) Indicator for MetaTrader 5 . Designed for traders who want to go beyond retail strategies, this advanced tool helps you identify market structure shifts, order blocks, liquidity zones, and fair value gaps with precision and clarity. Key Features: Automatic Market Structure Detection : Instantly spot Breaks of Structure (BOS), CHoCH, and trend shifts. Multi-Timeframe
Trend Factor is an indicator based on the calculation of price values ​​to answer questions about what direction the trend is acting on the market at the moment and when this trend will end. By launching the Trend Factor indicator, the user will see two lines and bars of different colors, which can change color to green during an uptrend, to red during a downtrend or to be yellow during an uncertainty. The trader uses the Trend Factor indicator to determine the market situation. This is a tre
The Expert Advisor and the video are attached in the Discussion tab . The robot applies only one order and strictly follows the signals to evaluate the indicator efficiency. Pan PrizMA CD Phase is an option based on the Pan PrizMA indicator. Details (in Russian). Averaging by a quadric-quartic polynomial increases the smoothness of lines, adds momentum and rhythm. Extrapolation by the sinusoid function near a constant allows adjusting the delay or lead of signals. The value of the phase - wave s
Phantom Quant Momentum AI-Inspired 6-Agent Scoring Indicator with Buy/Sell Arrows for MetaTrader 5 Tired of simple moving-average crossovers that give too many false signals? **Phantom Quant Momentum** is a next-generation indicator built on quantitative logic originally designed for institutional AI trading systems. Instead of relying on a single indicator, this system runs **6 independent scoring agents** simultaneously — each analyzing a different dimension of the market. Only when the maj
Elite Harmony Signals Pro Panoramica Elite Harmony Signals è un indicatore sofisticato di analisi tecnica che visualizza rettangoli dinamici che forniscono zone di trading chiare e segnali di conferma per decisioni migliorate. Caratteristiche Principali Zone Rettangolo Dinamiche Estensione in Tempo Reale : I rettangoli si estendono automaticamente all'azione corrente del prezzo Chiusura Intelligente : I rettangoli si chiudono solo quando appaiono segnali opposti Conferma Visiva : Zone di trading
BTC Miner Pro   EA works on Time and Price theory. As the price patterns change, there will be no difference in performance of the EA, which is why this system has long-term stability and performance. The EA finds important and valuable price and executes trades based on them. This system works 100% automatically. Suitable for BITCOIN or BTCUSD . MT4 :  https://www.mql5.com/en/market/product/149981 Public channel :  https://www.mql5.com/en/channels/mqlexp Note : If you have any problems runn
Matreshka
Dimitr Trifonov
5 (2)
Matreshka self-testing and self-optimizing indicator: 1. Is an interpretation of the Elliott Wave Analysis Theory. 2. Based on the principle of the indicator type ZigZag, and the waves are based on the principle of interpretation of the theory of DeMark. 3. Filters waves in length and height. 4. Draws up to six levels of ZigZag at the same time, tracking waves of different orders. 5. Marks Pulsed and Recoil Waves. 6. Draws arrows to open positions 7. Draws three channels. 8. Notes support and re
Ultimate Double Top & Bottom (Pro Volume Matrix) Stop trading retail breakouts. Start trading Institutional Traps. The   Ultimate Double Top & Bottom   is not a standard, lagging pattern scanner. It is a highly advanced, non-repainting structural engine equipped with a proprietary   3-Leg Volume Matrix . Designed exclusively for Smart Money Concepts (SMC) and order flow traders, this indicator mathematically dissects the tick volume inside M and W patterns to reveal true institutional intent:  
EMA Spectrum - Multi-Timeframe EMA Indicator Display multiple EMAs from different timeframes on a single chart. Perfect for traders who use multi-timeframe analysis. FEATURES • 5 Customizable EMA Periods (default: 5, 10, 20, 60, 120) • 4 Timeframes: M5 / M15 / M30 / H1 • Individual transparency control for each timeframe • Different line styles (Solid / Dash / Dot) to distinguish timeframes • Interactive collapsible panel •
The   Fibonacci Confluence Toolkit   is a technical analysis tool designed to help traders identify potential price reversal zones by combining key market signals and patterns. It highlights areas of interest where significant price action or reactions are anticipated, automatically applies Fibonacci retracement levels to outline potential pullback zones, and detects engulfing candle patterns. Its unique strength lies in its reliance solely on price patterns, eliminating the need for user-define
Isolated Peak & Bottom – Trend Exhaustion and Reversal Indicator for MT5 An uptrend defined by higher highs does not create new highs every single day. At some point, price pauses, corrects, or reverses. The key challenge for traders is distinguishing between a temporary correction and the actual end of a trend . The Isolated Peak & Bottom indicator is designed to address this exact problem. Concept Behind the Indicator This indicator is based on the Isolated High / Low technique , a proven pric
Lets dabble a bit into Elliot Waves. This is a simple indicator which tries to identify Wave 1 and 2 of Elliot Impulese Wave and then projects for Wave 3. Ratios are taken from below link:   https://elliottwave-forecast.com/elliott-wave-theory/   - Section 3.1 Impulse Wave 2 is 50%, 61.8%, 76.4%, or 85.4% of wave 1 - used for identifying the pattern. Wave 3 is 161.8%, 200%, 261.8%, or 323.6% of wave 1-2 - used for setting the targets Important input parameters MaximumNumBars : To calculate
このプロダクトを購入した人は以下も購入しています
この製品は 2026 年の市場向けに更新され、最新の MT5 ビルドに最適化されています。 価格更新のお知らせ: Smart Trend Trading System は現在 $99 で提供されています。 次の 30 件の購入 後、価格は $199 に上がります。 特別オファー: Smart Trend Trading System を購入後、私にプライベートメッセージを送ることで、 Smart Universal EA を無料 で受け取り、Smart Trend のシグナルを自動売買に変えることができます。 Smart Trend Trading System は、リペイントなし、再描画なし、遅延なしの完全なトレーディングシステムです。よりクリーンなシグナル、より明確なトレンド方向、そしてより整理された取引方法を求めるトレーダー向けに作られています。 Online course , manual and [download presets] . このシステムは、トレンド検出、反転ゾーン、Smart Cloud、トレーリングストップロジック、サポートとレジスタンス、ローソク足の色分け
Trend Sniper X
Sarvarbek Abduvoxobov
5 (8)
Trend Sniper X は、MetaTrader 5 用のマルチタイムフレーム・トレンドフォロー・インジケーターです。トレーダーがトレンドの方向性と反転ポイントを明確かつ正確に特定できるよう支援します。 価格情報: 現在の価格はキャンペーン価格であり、今後のアップデートや新機能のリリースに伴い変更される可能性があります。 Code2Profit チャンネル マルチタイムフレーム分析で市場をマスターしよう! 技術仕様 プラットフォーム MetaTrader 5 インジケータータイプ マルチタイムフレーム・トレンドインジケーター 操作タイムフレーム あらゆるチャートタイムフレームに対応。個別に選択可能な上位タイムフレーム (M1–MN1) を搭載 主要銘柄 FX、ゴールド (XAUUSD)、およびその他のCFD 推奨口座 あらゆる口座タイプに対応 視覚化 色分けされたトレンドローソク足 (買い/売り/弱気/変化) + 買い/売り矢印 追加モジュール セッション市場ボックス (シドニー、東京、ロンドン、ニューヨーク) 主な機能 マルチタイムフレーム・トレンド分析: 上位タイムフレームの
まず正直に言いましょう。 どんなインジケーターも、それ単体であなたを利益化させることはできません。もしそう言う人がいるなら、それは夢を売っているだけです。完璧な売買シグナル(矢印)を表示するインジケーターは、いくらでも“完璧に見せる”ことができます。正しい過去の区間を拡大して、勝ちトレードだけを切り取ればいいだけです。私たちはそれをしません。 SMC Intraday Formula はツールです。 市場構造を読み取り、最も高い確率の価格ゾーンを特定し、今この瞬間のスマートマネーの痕跡をシンプルな言葉で正確に示します。最終判断はあなたが行います。トレードを実行するのもあなたです。しかし今は「希望」ではなく「精度」でエントリーできます。 私たちはこのインジケーターを、ゴールド(XAUUSD)および主要FX通貨ペアで約3年間、日々のスキャルピングに使用してきました。M1、M5、M15、M30の主要ツールです。これは未来を予測しようとするのではなく、今まさに形成されている高確率セットアップを示し、その理由を説明します。 他のすべてのインジケーターと何が違うのか? ほとんどのトレーディングイ
Welcome to ENTRY IN THE ZONE AND SMC MULTI TIMEFRAME Entry In The Zone and SMC Multi Timeframe is a professional trading indicator built on Smart Money Concepts (SMC) , combining market structure analysis with a No Repaint BUY / SELL signal system in a single indicator. It helps traders understand market structure more clearly, identify key price zones, and focus on higher-quality trading opportunities. By combining Multi-Timeframe Analysis , Points of Interest (POIs) , and real-time signals, th
伝説が帰ってきました:Entry Points Pro 10。 MQL5 Marketのトップ3に3年間入り続けた伝説的インジケーターの再始動です。 2つのバージョンで合計589件の高評価レビュー、毎日数千人のトレーダーが実際のトレードに使用し、デモのダウンロードは31,000件以上   MT4+MT5 。 私はこの5年間に寄せられたレビューをすべて読み、約束を並べる代わりに、その答えをバージョン10に組み込みました。1999年から相場に携わり、 誠実さ、自らの評判、そして顧客を大切にする 作者による製品です。 Entry Points Proのエントリーシグナルは、リペイント(再描画)を一切行いません。 そして今回初めて、これは作者の言葉ではなく検証可能な事実になりました。確定シグナルはローソク足の終値確定後にのみ表示され、自動テストで リペイントはゼロ と確認されています(EURUSD、XAUUSD、BTCUSDで2,486,568回の不変条件チェック、違反0件)。検証方法は公開されており、ストラテジーテスターでご自身で再現できます。 ご購入後は、必ずすぐにダイレクトメッセージでご
SuperScalp Pro
Van Minh Nguyen
4.6 (30)
SuperScalp Pro – プロフェッショナル多層コンフルエンス・スキャルピングシステム SuperScalp Pro は、複数のコンフルエンスを組み合わせたプロフェッショナル向けスキャルピングシステムです。より高い確率のトレードチャンスを見つけられるよう設計されており、明確なエントリー確認、ATRに基づくStop LossとTake Profit、さらにXAUUSD、BTCUSD、主要なFX通貨ペアに対応した柔軟なシグナルフィルター機能を提供します。 完全なドキュメントは製品ブログにあります: [User Guide] SuperScalp Pro Auto Trader EA による自動売買が利用可能です: [Auto Trader] SuperScalp Pro のトレードロジックを基に開発されたゴールド自動スキャルピングEA: [SuperScalp Gold] SuperScalp Pro は、Supertrend、VWAP、EMA、RSI、ADX、出来高分析、ボリンジャーバンド、MACDダイバージェンスを組み合わせ、低品質なトレードセットアップをフィルタリングし
M1 Quantum を使用したライブトレードシグナル : シグナル (取引は 自動的に Quantum Trade Assistant によって実行され、この製品に 無料 で含まれています。) 価格プラン: 現在価格: $169 (早期購入者向けオファー) 次回予定価格: $189 予定小売価格: $299 開発者からのお知らせ: ご購入後、 最新の推奨設定ファイル(Set File) 、運用アドバイス、および他の M1 Quantum ユーザーと交流できる VIPサポートグループ への招待をご希望の場合は、お気軽にご連絡ください。 よくある質問 - 設定ファイル - インストールガイド M1 Quantum は、M1専用のプロフェッショナルトレーディングシステムであり、ストップロス、テイクプロフィット、スマートな資金管理を内蔵した、迅速かつ正確な取引シグナルを提供します。 M1 Quantum は、 連続勝利 に重点を置いて口座を素早く成長させるために設計されたプロフェッショナルな資金管理を備えています。 M1 Quantum インジケーター の主な特徴 M1時間足 およびすべ
時折、私自身もこのシステムを使って取引を行っています。 実口座での私の手動による「BOMBER」トレードをぜひご評価ください - LIVE SIGNAL このインジケーターを購入された方には、以下の特典を 無料 で提供しています: 各トレードを自動で管理し、ストップロスとテイクプロフィットを設定し、戦略ルールに基づいてポジションを決済する補助ツール 「Bomber Utility」 様々な銘柄に合わせたインジケーターの設定ファイル(セットファイル) 「最小リスク」、「バランスリスク」、「待機戦略」 の3つのモードで使用できる Bomber Utility 用の設定ファイル このトレーディング戦略をすぐに導入・設定・開始できる ステップバイステップのビデオマニュアル ご注意: 上記の特典を受け取るには、MQL5のプライベートメッセージシステムを通じて販売者にご連絡ください。 オリジナルのカスタムインジケーター 「Divergence Bomber(ダイバージェンス・ボンバー)」 をご紹介します。これは、MACDのダイバージェンス(乖離)戦略に基づいた 「オールインワン」型のトレーディン
Neuro Poseidon is a new indicator by Daria Rezueva. It combines precise trading signals with adaptive TP/SL levels - creating best possible trades as a result! Message me and get  Neuro Poseidon Assistant  as a gift to automize your trading process! What makes it stand out? 1. Proven profitability on all assets and timeframes 2. Only confirmed BUY and SELL signals present on the chart 3. Adaptive TP & SL levels generated by the software for each trade 4. Easy to understand - suitable for al
Gann Made Easy   は、ミスター・ギャンの理論を使用した取引の最良の原則に基づいた、プロフェッショナルで使いやすい外国為替取引システムです。 W・D・ガン。このインジケーターは、ストップロスとテイクプロフィットレベルを含む正確な買いと売りのシグナルを提供します。 PUSH通知を利用して外出先でも取引可能です。 ご購入後、取引方法の説明と優れた追加インジケーターを無料で入手するには、私にご連絡ください! おそらく、ギャンの取引手法についてはすでに何度も聞いたことがあるでしょう。通常、ギャンの理論は初心者のトレーダーだけでなく、すでにある程度の取引経験がある人にとっても非常に複雑なものです。なぜなら、ギャンの取引手法は理論的にはそれほど簡単に適用できるものではないからです。私はその知識を磨き、最良の原則を私の外国為替インジケーターに組み込むために数年を費やしました。 このインジケーターは非常に簡単に適用できます。必要なのは、それをチャートに添付し、簡単な取引推奨事項に従うだけです。このインジケーターは常に市場分析の仕事を行い、取引の機会を探します。適切なエントリーポイントを検
この製品は 2026 年の市場向けに更新され、最新の MT5 ビルドに最適化されています。 価格更新のお知らせ: Atomic Analyst は現在 $99 で提供されています。 次の 30 件の購入 後、価格は $199 に上がります。 特別オファー: Atomic Analyst を購入後、私にプライベートメッセージを送ることで、 Smart Universal EA を無料 で受け取り、Atomic Analyst のシグナルを自動売買に変えることができます。 Atomic Analyst は、リペイントなし、再描画なし、遅延なしの Price Action トレーディングインジケーターで、手動取引、シグナルの明確化、EA 自動化のために設計されています。 User manual: settings, inputs and strategy.   &   User Manual PDF . 価格行動、強さ、モメンタム、マルチタイムフレーム方向、高度なフィルターを分析し、トレーダーがノイズを減らし、弱いセットアップを避け、より構造化された取引判断を行えるようにします。 このイ
ARICoin is a powerful trading companion designed to generate high-probability entry signals with dynamic TP/SL/DP levels based on volatility. Built-in performance tracking shows win/loss stats, PP1/PP2 hits, and success rates all updated live. Key Features: Buy/Sell signals with adaptive volatility bands Real-time TP/SL/DP levels based on ATR Built-in MA Filter with optional ATR/StdDev volatility Performance stats panel (Success, Profit/Loss, PP1/PP2) Alerts via popup, sound, push, or email Cust
Crystal Heikin Ashi Signals - Professional Trend & Signal Detection Indicator Advanced Heikin Ashi Visualization with Intelligent Signal System for Manual & Automated Trading Final Price: $149 ---------> Price goes up $10 after every 10 sales . Limited slots available — act fast . Overview Crystal Heikin Ashi Signals is a professional-grade MetaTrader 5 indicator that combines pure Heikin Ashi candle visualization with an advanced momentum-shift detection system. Designed for both manual traders
Power Candles V3 - 自己最適化型強弱インジケーター Power Candles V3は 、通貨や銘柄の強さを、適用されたすべてのチャート上で実行可能なトレードプランに変換します。単にローソク足を色分けするだけでなく、バックグラウンドでリアルタイムの自動最適化を実行し、目の前の銘柄に対して最適なストップロス、テイクプロフィット、およびシグナルの閾値を提示します。ワンクリックで実取引に適用でき、エントリーポイント、ストップロス、テイクプロフィットのラインが正確な価格位置にチャート上に表示され、方向性を示すアラートがリアルタイムで発動します。 このツールは、Stein Investmentsのエコシステムの一部です。  18種類以上のツールをすべて閲覧し、AIを活用したセットアップの推奨事項を入手し、  https://stein.investments でコミュニティに参加しましょう クローズしたバーごとに3,000回以上のトレードシミュレーション。9つの強さの状態。2つの戦略を並行してテスト。勝率の高い設定をワンクリックで適用。 なぜこれが必要なのか ほとんどの強
ARIPoint
Temirlan Kdyrkhan
1 (1)
ARIPoint is a powerful trading companion designed to generate high-probability entry signals with dynamic TP/SL/DP levels based on volatility. Built-in performance tracking shows win/loss stats, PP1/PP2 hits, and success rates all updated live. Key Features: Buy/Sell signals with adaptive volatility bands Real-time TP/SL/DP levels based on ATR Built-in MA Filter with optional ATR/StdDev volatility Performance stats panel (Success, Profit/Loss, PP1/PP2) Alerts via popup, sound, push, or email Cu
GEM Signal Pro GEM Signal Pro は、MetaTrader 5 向けのトレンドフォロー型インジケーターです。より明確なシグナル、より整理されたトレードセットアップ、そして実用的なリスク管理をチャート上で確認したいトレーダーのために設計されています。 単純な矢印だけを表示するのではなく、GEM Signal Pro はトレード全体の考え方を、より見やすく分かりやすい形で表示します。条件が確認されると、インジケーターはエントリー価格、ストップロス、利確目標をチャート上に表示し、トレードセットアップをより効率的に確認できるようにします。 動作の仕組み このインジケーターは、まず内部ロジックに基づいて有効なシードシグナルを検出します。 確認条件が満たされると、GEM Signal Pro はチャート上に完全なセットアップを表示します。これにより、トレーダーはトレード構造をより明確に把握し、手作業による分析を減らすことができます。 チャート上のトレードレベル 確認済みシグナルに対して、GEM Signal Pro は以下を表示できます。 エントリー価格 ストップロス テ
Azimuth Pro
Ottaviano De Cicco
5 (7)
Azimuth Pro V2:MT5向けシンセティック・フラクタル構造分析と確認済みエントリー 概要 Azimuth Pro は Merkava Labs によるマルチレベルスイング構造インジケーターです。4つのネストされたスイングレイヤー、スイングアンカーVWAP、ABCパターン検出、3タイムフレーム構造フィルタリング、そして確定バーでの確認済みエントリー — 1つのチャートで、ミクロスイングからマクロサイクルまでを網羅するワークフロー。 これはブラインドシグナル製品ではありません。ロケーション、コンテキスト、タイミングを重視するトレーダーのための構造ファーストワークフローです。 ️ サマーセール — 夏至とThe Oracle Proの発売を記念して、Azimuth Proが30%オフ。現在279 USD(通常399 USD)。期間限定の夏季オファー。 1. V2での変更点 シンセティック・マルチタイムフレームエンジン 上位タイムフレーム分析をMeridian Proと同じ独自のシンセティックアーキテクチャで一から再構築。よりクリーンなHTFコンテキスト、安定したライブ動作、
UZFX {SSS} スキャルピング・スマートシグナル v4.0 MT5は、変動の激しい市場において正確かつリアルタイムのシグナルを求めるスキャルパー、デイトレーダー、スイングトレーダー向けに設計された、リペイントのない高性能な取引インジケーターです。(UZFX-LABS)によって開発されたこのインジケーターは、価格行動分析、トレンド確認、スマートフィルタリングを組み合わせることで、すべての通貨ペアおよび時間軸において、高確率の売買シグナル、警告シグナル、トレンド継続の機会を生成します。 トレードの判断に迷うのはもうやめましょう。明確さ、正確さ、そして規律ある市場執行を求めるトレーダーのために設計された、体系的なシグナルシステムに従い始めましょう。 私のおすすめ* 最適な時間足:15分足以上。 {H1} が私のお気に入りです。そして、その成果は驚異的です…!! 主な機能の更新 • 自動売買シグナル検出 • 高度な反転認識ロジック • 市場反転の可能性に先立つ早期警告シグナル • トレンド継続確認シグナル • エントリー、ストップロス、TP1、TP2、TP3レベルを備えた組み込み型
M1 SNIPER は使いやすいトレーディングインジケーターシステムです。M1時間足向けに設計された矢印インジケーターです。M1時間足でのスキャルピングのためのスタンドアロンシステムとして、また既存のトレーディングシステムの一部としても使用できます。このトレーディングシステムはM1時間足での取引に特化して設計されていますが、他の時間足でも使用できます。元々、この手法はXAUUSDとBTCUSDの取引用に設計しましたが、他の市場においても役立つと考えています。 インジケーターのシグナルは、トレンドの方向と逆方向に取引できます。インジケーターのシグナルを利用して両方向に取引するのに役立つ特別な取引テクニックをご紹介します。この手法は、特別な動的なサポートとレジスタンスの価格帯を利用することに基づいています。 ご購入後、M1 SNIPER矢印インジケーターをすぐにダウンロードできます。さらに、M1 SNIPERツールのすべてのユーザーに、以下のスクリーンショットに表示されているApollo Dynamic SRインジケーターを無料で提供しています。この2つのインジケーターを組み合わせることで
RelicusRoad Pro: 定量的市場オペレーティングシステム 【期間限定】無制限アクセス 70% OFF - 2,000人超のトレーダーと共に なぜ多くのトレーダーは「完璧な」インジケーターを使っても失敗するのでしょうか? それは、文脈を無視して 単一の概念 だけでトレードしているからです。文脈のないシグナルは単なるギャンブルです。勝ち続けるには、 根拠の重なり(コンフルエンス) が必要です。 RelicusRoad Proは単なる矢印インジケーターではありません。完全な 定量的市場エコシステム です。独自のボラティリティモデリングを用いて、価格が推移する「適正価値の道(Fair Value Road)」をマッピングし、ノイズと真の構造的ブレイクを判別します。 推測はやめましょう。機関投資家レベルの「ロード・ロジック」でトレードを。 コアエンジン:「Road」アルゴリズム システムの中心となる Road Algo は、市場環境にリアルタイムで適応するダイナミックなボラティリティチャネルです。 安全ライン(平衡点) と、価格が数学的に反転しやすい 拡張レベル を投影します。 Si
AXIOM MATRIX MT5 ローンチ価格:$99 Axiom Matrix はローンチ価格 $99 でご利用いただけます。 最初の30件の購入後、価格は $199 に上がります。 ご購入後、手順のご案内と限定ギフトボーナスの受け取りのために、直接DMをお送りください。 Axiom Matrix は、MetaTrader 5 用のプロフェッショナルなマルチシンボル・マルチタイムフレーム市場スキャナー兼意思決定ダッシュボードです。 Market Watch をスキャンし、複数の時間足を分析し、複数のエビデンスエンジンを読み取り、最も強いチャンスを比較し、1つのクリーンなマトリックスダッシュボード内で最適な BUY、SELL、WAIT、またはブロック状態を表示します。 私が Axiom Matrix を作った理由は、市場スキャンという重い作業を代わりに行ってくれる1つのツールが欲しかったからです。 RSI だけを確認したくありませんでした。 次に MACD だけ。 次に移動平均線。 次に出来高。 次にボラティリティ。 次にサポートとレジスタンス。 そして、1つのトレードアイデアを作るた
SkyHammer Signal Pro Entry、SL、TP レベルを固定表示する、プロ仕様のノーリペイント・トレンドシグナルインジケーター SkyHammer Signal Pro は、明確で固定され、検証可能なシグナルを求めるトレーダー向けに設計された、構造的なトレンド・モメンタム系シグナルインジケーターです。 特に M1 と M5 などの短期時間足で最も効果を発揮します。 このインジケーターは、天井や底を予測するためのものではありません。シグナルを出す前に、確認された市場構造、トレンド方向、モメンタムの強さ、健全なボラティリティ、そしてターゲットまでの十分な値幅を確認します。 主な機能 固定シグナルメカニズム シグナルが確認されると、矢印、Entry、Stop Loss、TP1、TP2 の各レベルはチャート上に永久的に固定されます。 その後のローソク足の動きによって、シグナルが消えたり、移動したり、変更されたりすることはありません。 これにより、トレーダーは各シグナルを明確に確認でき、リアルタイム相場中にシグナルが消えるという一般的な問題を避けることができます。 完全な過去シ
通貨強さウィザードは、取引を成功させるためのオールインワン ソリューションを提供する非常に強力な指標です。このインジケーターは、複数の時間枠のすべての通貨のデータを使用して、このまたはその外国為替ペアのパワーを計算します。このデータは、使いやすい通貨インデックスと通貨パワーラインの形式で表され、特定の通貨のパワーを確認するために使用できます。 必要なのは、取引したいチャートにインジケーターを接続することだけです。インジケーターは、取引する通貨の実際の強さを示します。このインジケーターは、トレンドに合わせて取引するときに有利に利用できる売買高の圧力の極値も示します。このインジケーターには、フィボナッチに基づく可能なターゲットも表示されます。 このインジケーターは、PUSH 通知を含むあらゆるタイプのアラートを提供します。 購入後ご連絡下さい。私の取引のヒントをあなたと共有し、素晴らしいボーナスインジケーターを無料で提供します! 幸せで有益な取引をお祈りします。
The Oracle Pro
Ottaviano De Cicco
5 (1)
The Oracle Pro:MT5向け合成マルチタイムフレーム・バイアスエンジン ️ サマー・ローンチ・オファー — The Oracle Pro を 199 USD で(早期購入者向け)。価格は普及に応じて上昇します。最終価格 399 USD。 The Oracle Pro は、要求の高いプロのトレーダーのために作られた MetaTrader 5 向けのプレミアム・マルチタイムフレーム バイアスエンジン です。ひとつの問いに規律をもって答えます。すなわち、各タイムフレームの現在の方向バイアスは何か、その強さはどれほどか、そしてタイムフレーム同士はどれだけ一致しているか。すべては確定足のみで計算され、リペイントはありません。 The Oracle Pro はマルチファクター・コンセンサス・システムです。独自のインジケーターと最適化されたアルゴリズムを単一の高度なコンセンサス・ベクトルに統合し、それを単一のインジケーター・インスタンス内で現在足と上位足のスタックにわたって読み取ります。複数のチャートにばらばらのツールを積み重ねる代わりに、です。 これは Oracle コンセンサス手法
Atbot
Zaha Feiz
4.69 (55)
AtBot: どのように機能し、どのように使用するか ### どのように機能するか MT5プラットフォーム用の「AtBot」インジケーターは、テクニカル分析ツールの組み合わせを使用して売買シグナルを生成します。単純移動平均(SMA)、指数移動平均(EMA)、および平均真実範囲(ATR)インデックスを統合して取引機会を特定します。さらに、Heikin Ashiキャンドルを使用してシグナルの精度を向上させることもできます。 購入後にレビューを残すと、特別なボーナスギフトを受け取ります。 ### 主な機能: - 再描画なし: シグナルはプロット後に変更されません。 - 再描画なし: シグナルは一貫しており、変更されません。 - 遅延なし: 遅延なくタイムリーなシグナルを提供します。 - 多様な時間枠: あらゆる時間枠で使用可能で、取引戦略に合わせることができます。 ### 操作手順: #### 入力と設定: - firstkey (TrendValue): トレンド検出の感度を調整します。 - Secondkey (SignalValue): 売買シグナル生成の感度を定義します。 - ma
BTMM State Engine Pro is a MetaTrader 5 indicator for traders who use the Beat The Market Maker approach: Asian session context, kill zone timing, level progression, peak formation detection, and a multi-pair scanner from a single chart. It combines cycle state logic with a built-in scanner dashboard so you do not need the same tool on many charts at once. What it does Draws the Asian session range; session times can follow broker server offset or be set in inputs. Tracks level progression (L
Quantum TrendPulse を ご紹介します。これは、   SuperTrend   、   RSI   、および Stochastic のパワーを 1 つの包括的なインジケーターに組み合わせて、取引の可能性を最大限に引き出す究極の取引ツールです。精度と効率を求めるトレーダー向けに設計されたこのインジケーターは、市場のトレンド、勢いの変化、最適なエントリー ポイントとエグジット ポイントを自信を持って特定するのに役立ちます。 主な特徴: SuperTrend 統合: 現在の市場動向に簡単に追従し、収益性の波に乗ることができます。 RSI精度: 買われすぎと売られすぎのレベルを検出し、市場の反転のタイミングに最適で、SuperTrendのフィルターとして使用されます。 確率的精度: 確率的振動を活用して、変動の激しい市場で隠れたチャンスを見つけます。SuperTrend のフィルターとして使用されます。 マルチタイムフレーム分析:   M5 から H1 または H4 まで、さまざまなタイムフレームで市場を常に把握します。 カスタマイズ可能なアラート: カスタム取引条件が満たされ
Crystal Quantum Pro
Muhammad Jawad Shabir
5 (1)
CRYSTAL QUANTUM PRO Institutional Signal & Trade Intelligence for MetaTrader 5 Final Price: 199 USD ----> Price goes up 10 USD after every 10 sales. Limited launch slots available, act fast. Most indicators give you an arrow and leave you alone. A naked arrow is a gamble. Winning consistently requires CONFLUENCE , a clear STOP and TARGET , and honest PROOF that the system works. Crystal Quantum Pro delivers all three in one clean, no-repaint package. Crystal Quantum Pro is a complete decision sy
Berma Bands
Muhammad Elbermawi
5 (10)
Berma Bands (BBs) インジケーターは、市場のトレンドを特定して活用したいトレーダーにとって貴重なツールです。価格と BBs の関係を分析することで、トレーダーは市場がトレンド段階にあるか、レンジ段階にあるかを判断できます。 詳細については、[ Berma Home Blog ] をご覧ください。 バーマ バンドは、上部バーマ バンド、中部バーマ バンド、下部バーマ バンドの 3 つの異なる線で構成されています。これらの線は価格の周りにプロットされ、全体的な傾向に対する価格の動きを視覚的に表します。これらのバンド間の距離から、ボラティリティや潜在的な傾向の反転についての洞察を得ることができます。 バーマ バンドの線がそれぞれ離れると、市場が横ばいまたはレンジ相場の期間に入っていることを示すことがよくあります。これは、明確な方向性の偏りがないことを示しています。トレーダーは、これらの期間中にトレンドを特定するのが難しいと感じる可能性があり、より明確なトレンドが出現するまで待つ場合があります。 バーマ バンドの線が 1 本の線に収束すると、強いトレンド環境の兆候となること
FX Power: 通貨の強弱を分析して、より賢い取引を実現 概要 FX Power は主要通貨と金の実際の強弱をあらゆる市場状況で理解するための必須ツールです。強い通貨を買い、弱い通貨を売ることで、 FX Power は取引の意思決定を簡素化し、高い確率の取引機会を見出します。トレンドを追従する場合でも、極端なデルタ値を使用して反転を予測する場合でも、このツールはあなたの取引スタイルに完全に適応します。ただ取引するだけではなく、 FX Power で賢く取引をしましょう。 1. なぜ FX Power がトレーダーにとって非常に有益なのか 通貨と金のリアルタイム強弱分析 • FX Power は主要通貨と金の相対的な強弱を計算し、マーケットダイナミクスに関する明確な洞察を提供します。 • どの資産がリードしているか、または後れを取っているかを監視して、取引するペアを賢く選びましょう。 マルチタイムフレームの包括的なビュー • 短期、中期、長期のタイムフレームで通貨と金の強弱を追跡し、マーケットトレンドに基づいて取引戦略を調整できます。 • スキャルピングからスイングトレード
作者のその他のプロダクト
Iceblock Volume
Vincent Jose Proenca
5 (1)
短い説明: Iceblock — 高出来高だが価格変動が小さいクラスターを検出するMT4インジケーター(アイスバーグ様の挙動)。 TF: すべての時間足で動作(M1〜D1)。 通貨ペア: Forex、指数、ゴールド、CFDに対応。 設定項目: VolumeLookback – 平均出来高計算のためのバー数 VolumeThreshold – 異常な出来高を判定する倍率 ClusterSize – クラスター確認の近接バー数 RangeComparisonPeriod – 高値–安値の平均範囲算出期間 簡潔な結論: Iceblockは出来高は高いが価格変動が小さい箇所を強調表示します。アイスバーグ注文と似た効果を示唆しますが、MT4の出来高と価格データのみを使用します。矢印は異常活動のマーキングで、取引シグナルではありません。
FREE
Volume Profile Density V2.40 価格ごとの出来高分布を表示し、機関投資家が注目する価格帯を明らかにします。 時間軸ベースの出来高とは異なり、どこで取引量が集中したかを示します。 基本概念: 水平バー = 各価格の取引量 バーが長いほど出来高が多い 赤いゾーン = 主要なサポート/レジスタンス 主な用途: 実際のサポート・レジスタンスの特定 POC(コントロールポイント) の確認 バリューエリア(総出来高の70%) の定義 低出来高ゾーンをストップやターゲットに利用 カラーガイド: 青 = 低出来高(価格が素早く通過) 黄 = 中程度の出来高(バランスゾーン) 赤 = 高出来高(機関ゾーン) トレード戦略: 赤ゾーンでの反発買い VAHまたは赤ゾーンでの拒否売り 出来高を伴うPOCブレイクで参入 POCへの戻りでエントリー 青ゾーンを目標に設定 設定: 初心者: 1.0 / 100% / 1.0 スキャルピング: 0.5 / 200% / 0.5 スイング: 2.0 / 50% / 1.5 技術情報: バージョン: 2.40 プラットフォーム: MT5 対応資産
FREE
バブルインジケーター ― 価格減速 + 出来高スパイク検出 価格が突然減速し、同時に出来高が急増したときに、チャート上に色付きの四角を表示するシンプルなビジュアルツールです。 (塗りつぶし機能と同心円状のバブル効果を含む) 市場が動き出す前の重要なタイミングを見極めるのに役立ちます。 インジケーターの役割: 市場が動く前に「ためらう」瞬間を検出 出来高が増えても価格があまり動かないポイントを表示 ブレイクアウトや転換の可能性を事前に察知 動作の仕組み: 現在のチャートよりも小さいタイムフレームを分析 異常に小さいローソク足を検出(価格の減速) 異常に高い出来高を検出(出来高スパイク) 緑(強気)または赤(弱気)の四角を表示 主な設定項目: 価格感度: 値が低いほど反応が敏感 出来高倍率: 値が高いほど検出が厳密 バブルサイズ: 表示の見やすさを調整 なぜ便利なのか: シンプルで視覚的にわかりやすい 複雑な計算は不要 興味深い市場パターンを見つけやすい 完全にカスタマイズ可能 レンジ相場、ブレイクアウト、または市場のダイナミクスを理解するのに最適です。
VWAP_PC_MQL5 — a simple home-built VWAP indicator showing real-time volume-weighted price levels directly on your MT5 chart. TF: Works on all timeframes. Pair: Compatible with all symbols — Forex, indices, commodities, and stocks. Settings: Applied Price – price type used for VWAP calculation (Close, Typical, Weighted, etc.) Line Color / Width / Style – customize VWAP line appearance Session Reset – optional reset per day or continuous mode How it works (VWAP principle): VWAP (Volume Weighted
FREE
PDHL – simply displays the highs and lows of previous days directly on your chart, providing a quick and visual reference of past key levels. The indicator is lightweight and easily customizable , allowing you to adjust the number of days displayed, the colors, as well as the style and thickness of the lines to suit your preferences. It is designed to be simple and practical, but may not work on all instruments or platforms . Only teste Tested only with CFDs
FREE
Range Breakout EA – Simple Description Concept An automated trading robot for MetaTrader 5 that exploits range breakouts with two key periods: Features Automatic market hours management Customizable Stop Loss and Take Profit Smart Trailing Stop Built-in testing mode for simulation Detailed logs for monitoring How It Works Records extreme prices at the start of the day Waits for a breakout of the secondary range Opens a position in the breakout direction Automatically manages the trade (SL/TP/Tr
FREE
This indicator allows you to number bars within a trading session for CFDs. It works on GER40, UK100, US30, US100, and US500 and is fully customizable to fit your trading style and chart preferences. Key Features & Parameters: Customizable session interval: define your own session start and end times Option to hide even numbers for a cleaner chart Adjust number distance to position the bar numbers as you prefer Font size and color: choose the size and color that suit your chart Number of days di
FREE
Volume & Move Strength (VMS) Indicator for MT5 The VMS Indicator displays the relationship between trading volume and price movement strength, helping traders assess how well market activity supports price action. How It Works: Measures tick volume as trading activity. Calculates move strength using a normalized True Range (%). Both values can be smoothed (default: 5) and optionally normalized (0–100) for consistency across markets. Plots two lines in a separate window: Blue (Volume) – trading a
FREE
Dynamic Pivot Zones – Your Level Assistant on the Chart This indicator is a bit like a GPS for your trading . It shows you where the price likes to hang out, where it gets nervous, and where it flies through. No more calculating pivots by hand or guessing support and resistance levels. What it does: Automatically plots H1, H4, and D1 pivots . Shows support and resistance zones : R1, R2, S1, S2. Lines are colored and easy to read , so you can instantly see what’s hot or cold. Why you’ll love it:
FREE
Volume-to-Price Movement Oscillator (VP Oscillator) for MT5 The VP Oscillator highlights the balance (or imbalance) between trading volume and price movement, helping traders spot hidden accumulation, distribution, or weakening trends. How It Works: Calculates each bar’s price range (High–Low) and tick volume. Normalizes both values over a set period (default: 14). Plots the absolute difference between them ×100 — showing how closely price action aligns with trading activity. Interpretation: Hig
FREE
indicator that numbers the bars (candles) in a custom trading session. The indicator allows: Defining the session start time (StartHour and StartMinute) Displaying numbers only on odd bars (if AfficherUniquementImpairs is true) Displaying numbers on the last N days (NbJours) Customizing the color and font size of the text The indicator will loop through the bars of the last N days and, for each day, start counting from the session start time. It will display the bar number (starting at 1) belo
FREE
his indicator automatically identifies key support and resistance levels by analyzing volume patterns. Unlike traditional S/R tools that rely only on price, Volume S/R finds levels where the market truly reacted.   DETECTION LOGIC: - High Volume Zones: Price levels where strong buying/selling occurred - Low Volume Zones: Areas of weak interest - potential breakout or reversal zones   SMART FILTERING: - Nearby levels are automatically merged to avoid chart clutter - Maximum levels limit keeps yo
FREE
STRUCTURAL TREND LINES - MT4/MT5 Indicator Simple indicator that automatically draws trend lines based on market structure. Features: - 3 degrees of structure detection (short, medium, long term) - Configurable swing strength for each degree - Single color per degree for clean visualization - Adjustable number of lines per degree - Customizable colors and line widths How it works: The indicator identifies swing highs and lows based on the strength parameter, then connects these points to crea
FREE
Range Box Indicator for Trading Sessions This indicator allows traders to visualize and analyze specific time ranges directly on their chart by drawing rectangular boxes for each trading session. Key Features: Customizable session interval: set your own session start and end times. Number of days displayed: choose how many past sessions are visible. Default color and special color for Monday: easily highlight weekly patterns. Adjustable border width: customize the appearance of the rectangles to
FREE
STRUCTURAL TREND LINES - MT4 Indicator Simple indicator that automatically draws trend lines based on market structure. Features: - 3 degrees of structure detection (short, medium, long term) - Configurable swing strength for each degree - Single color per degree for clean visualization - Adjustable number of lines per degree - Customizable colors and line widths How it works: The indicator identifies swing highs and lows based on the strength parameter, then connects these points to create t
FREE
Adaptive Flow MAs is a moving average indicator designed to naturally adjust to market movements. Unlike traditional averages, it dynamically adapts its periods based on recent volatility and the current trend. The EMA closely follows rapid price swings to capture every impulse, while the SMA remains smoother, providing a stable and reliable reference. With a clean display showing the current adaptive periods, this tool helps traders feel the “flow” of the market without visual clutter. It’s cr
FREE
The Candle Activity Visualizer turns your chart into a dynamic heatmap, giving you a clear view of buying and selling pressure. In-Depth Market Insight: Active Zone Detection: The algorithm highlights areas where high volume builds up within a narrow price range, revealing key pressure zones. Real-Time Intensity: Colors adjust in real time, shifting smoothly from cool tones to warmer shades as activity increases. Visual Customization: 5 Color Palettes: Choose from five professionally designed th
Rainbow Price Visualizer v1.21 See where the market really breathes. Turns your MT4 chart into an ultra-precise heatmap that highlights price zones favored by big players. Why it matters 300 price levels at 0.2‑pip resolution — microscopic detail. 8 visual themes (Rainbow, Fire, Ocean…) for instant readibility. Smart opacity: low noise fades, real zones pop. Lightweight rendering with automatic cleanup. Fully customizable: saturation, opacity, resolution, history depth. Bands project into the f
Institutional Flow Indicator A smart volume-based tool that detects institutional activity zones through direct order flow patterns. It reveals where large institutions operate. An advanced volume indicator that filters out noise to identify probable institutional patterns. Key Features Smart cluster detection Automatic identification Signal classification: Violet / Yellow – Institutional Zone – Strong, sustained institutional activity Red / Green – Strong Signal – Significant buying/selling pre
AutoPivot - 自動ピボットポイントインジケーター MT4用の高機能インジケーターで、日次・週次・月次の主要ピボットポイント(PP、R1、R2、R3、S1、S2、S3)を自動的に計算・表示し、前日の高値(PDH)および安値(PDL)も同時に描画します。トレーダーがサポート・レジスタンスゾーンを素早く把握できるよう設計されています。 主な機能: インテリジェントな時間枠認識 :チャートのタイムフレーム(H4、D1、W1)を自動検出し、各時間軸に最適化されたピボット計算を実行。 前日高値・安値表示 :PDH/PDLを自動で描画し、現在価格との位置関係を直感的に確認可能。 サポート/レジスタンスゾーン表示 :PDH/PDLと隣接するピボットラインの間に半透明ゾーンを生成し、反転やブレイクアウトの可能性を視覚化。 8種類のカラーテーマ :クラシック、ダーク、ライト、ブルー、プロフェッショナルなど8つのプリセットテーマを搭載。色、ラインスタイル、透明度も自由にカスタマイズ可能。 価格ラベルの表示オプション :各ピボットラインに対応する価格とコンパクトなラベル
AMD Adaptive MA MT4
Vincent Jose Proenca
5 (1)
AMD適応型移動平均線 (AAMA) AAMAはMetaTrader 4用の適応型移動平均インジケーターで、市場の状況に応じて自動的に反応速度を調整します。 主な特徴: カウフマン効率比に基づく適応型移動平均 – トレンド相場では素早く反応し、レンジ相場ではノイズを除去 AMDの4つの市場フェーズを自動検出:蓄積期(Accumulation)、上昇期(Markup)、分配期(Distribution)、下降期(Markdown) ATRによるボラティリティ適応 – 現在の市場状況に応じて感度を調整 リアルタイム情報パネルで検出されたフェーズ、自信レベル、適応速度を表示 複数インジケーターを統合:ADX、RSI、MACDを使用して市場フェーズを正確に識別 Fast/Slow参照ゾーンで適応動作を視覚化 使用方法: このインジケーターは市場状況に応じて自動的に適応速度を調整します。強いトレンドでは反応が速く、レンジでは遅くなります。ビジュアルパネルは現在の市場フェーズの解釈をサポートします。すべてのパラメータ(期間、色、感度)はトレーディングスタイルに合わせて自由にカスタマイズ可能です
STRUCTURAL TREND LINES - MT4 Indicator Simple indicator that automatically draws trend lines based on market structure. Features: - 3 degrees of structure detection (short, medium, long term) - Configurable swing strength for each degree - Single color per degree for clean visualization - Adjustable number of lines per degree - Customizable colors and line widths How it works: The indicator identifies swing highs and lows based on the strength parameter, then connects these points to create t
Volume Profile Rectangle 概要 インタラクティブな 出来高プロファイル指標 で、選択したエリア内の各価格レベルにおける取引量の水平方向分布を表示します。自動的に移動可能な長方形を作成し、買い優勢と売り優勢の出来高分布を色付きバーで視覚化します。 機能概要: 水平出来高の表示 :各価格レベルの出来高分布を水平バーとして表示 強気/弱気分析 :強気(買い)優勢を緑、弱気(売り)優勢を赤で表示 インタラクティブな長方形 :選択範囲の長方形を動かすと自動で再計算・更新 自動生成 :起動時にデフォルトの長方形を自動作成し、すぐに使用可能 動作原理: エリア選択 :長方形(自動または手動で作成)で分析範囲(時間+価格)を指定 出来高分布 :価格範囲を複数のレベルに分割(解像度設定可能)し、選択されたローソク足の出来高を分配 スマートカラーリング :各価格レベルで買いと売りのどちらが優勢かを判定 動的表示 :チャートの移動、ズーム、スクロール時にバーが自動的に再描画 オプションフィルター :ローソク足の実体またはヒゲを基準にフィルタリング可能(垂直フィルター) 主な設定: 長
Proxy OrderFlow MT4
Vincent Jose Proenca
5 (1)
ティックスプレッドの不均衡に基づくインジケーター。 TF: すべての時間足(M1〜D1)に対応。 ペア: Forex、指数、ゴールド、CFD に対応(JPYペア、ゴールド、CFD向けに自動調整)。 設定: TickWindow (200) – ティック観察ウィンドウ SpreadWeight (1.5) – スプレッドの重み付け NormalizationPeriod (20) – 正規化期間(z-score) Overbought / Oversold (±3.0) – アラート閾値 AlertCooldown (300s) – アラートのクールダウン時間 結論: Proxy Order Flow – Imbalance Tick-Spread v2.4 は、OHLC の変動とスプレッドを分析して買い/売り圧力を検出し、市場の方向性と不均衡ゾーンを明確に示します。
Nexus Signal System は MT4 用のインジケーターで、12 のテクニカル条件を組み合わせてトレードシグナルを生成します。本システムは、シグナルを確定する前に複数の要素(トレンド、モメンタム、出来高、サポート/レジスタンスゾーン)の共鳴を分析し、単一の指標だけを使用する場合に比べて、誤シグナルの発生を減らします。 分析基準(スコア 0–15 点): パターン検出(ピンバー、包み足) マルチタイムフレーム分析(上位時間足でのトレンド確認) ADX マーケットレジーム(トレンドのない市場を回避) サポート/レジスタンスゾーン(自動スイングポイント) 移動平均線 20/50/200(トレンド整列) RSI 14 期間(モメンタム) 相対出来高(機関投資家の確認) ATR(ボラティリティ) 機能: 透明な品質スコア付きシグナル(0–15) 自動検出された S/R ゾーンをチャートに表示 仮シグナル(現在のバー)と確定シグナル(確定バー) ATR に基づくストップロスおよびテイクプロフィット リアルタイム市場情報ダッシュボード 8 種類のカラーテーマで視覚的カスタマイズ 56
VR Signal
Vincent Jose Proenca
VolumeRejectionSignals v5.0 高度なボリューム分析インジケーター 概要 VolumeRejectionSignals v5.0 は、ボリュームリジェクションの詳細な分析を通じて、重要な価格変動を正確に特定するために設計された高度なテクニカル指標です。 オーダーフローの動態と市場構造を組み合わせることで、買い圧力や売り圧力が弱まるゾーンを検出し、反転やトレンド加速を予測できます。 インテリジェントスコアリングシステム 本インジケーターは、各シグナルの品質を 0 〜 100% のスケールで評価する加重スコアリングシステムに基づいています。 シグナルは次の3つのカテゴリーに分類されます: スタンダード: 50–65% ストロング: 65–80% プレミアム: 80%以上 この分類により、シグナルの信頼性を優先順位付けし、検出された信頼度に応じてトレード戦略を調整できます。 フィルターとカスタマイズ VolumeRejectionSignals v5.0 は、市場状況に応じてシグナル検出を最適化できる複数の設定可能なフィルターを提供します: トレンドフィルター(
機関投資家向け流動性圧縮インジケーター このインジケーターは、ボリンジャーバンドの幅、出来高、平均スプレッドを正規化してリアルタイムで流動性の引き締まりを測定し、価格ブレイクアウト前の圧縮フェーズを検出します。 表示: プロフェッショナル仕様の独立ウィンドウに「Compression Score」ヒストグラムと「Threshold」基準線を表示。 主な特徴 早期検出: 価格の急変前に圧縮ゾーンを特定。 多要素分析: 正規化されたボリンジャーバンド幅、出来高、平均スプレッドを組み合わせ。 リアルタイム更新: 現在のバーでティックごとに更新。 明確な可視化: 「Compression」ヒストグラムと点線の「Threshold」ライン。 互換性: MT4 および MT5 に対応。 使用方法 対象銘柄のチャートにインジケーターを追加します。 ボラティリティやセッションに合わせて閾値と重みを調整します。 解釈: スコアが高い場合は流動性圧縮フェーズを示します。価格のブレイクアウトを注視してください。 パラメーター BB_Period / BB_Dev: ボリンジャーバンド幅の計算。 Norm_
Mean Reversion Probability – 統計的リバーサルインジケーター 概要 本インジケーターは、過去の過剰拡張データをもとに、価格が200期間移動平均線(MA200)へ回帰する統計的確率を算出する機関投資家向けツールです。市場の疲労ゾーンを定量的に特定します。 主な特徴 高度な統計分析 – 500件以上の過去拡張データをもとに実際の確率を計算 確率スコア (0〜99%) – 平均への回帰確率を正確に定量化 疲労検出 – 拡張の期間と強度を測定 マルチアセット対応 – Forex、株価指数、金、仮想通貨、CFDに自動対応 スマートアラート – 稀だが信頼性の高いシグナル(確率 >80%、期間 >15バー) プロ仕様の表示 – シンプルで見やすいインスティテューショナルデザイン 分析方法 リアルタイムで以下を分析: 価格とMA200の正規化距離(ATR換算) 最後の平均回帰からの拡張期間 最大拡張に至るまでの時間 過去平均との比較 確率計算: 距離スコア(最大60%):現在値 vs 過去比 期間スコア(最大40%):拡張時間 vs 平均 疲労ボーナス(+15%):
日本語 – WBPチャートシグナル – マルチタイムフレーム買い/売り圧力インジケーター 概要: WBP Chart Signals は、出来高・スプレッド・価格アクションを総合的に分析し、市場の買い/売り圧力を測定する高度なインジケーターです。マルチタイムフレーム確認を備えた精度の高いシグナルを求めるトレーダーに最適です。 主な特徴: Weighted Buy Pressure (WBP): VWAP、MA200、出来高強度、流動性、モメンタムを組み合わせた独自アルゴリズム マルチタイムフレーム分析: 上位足での自動確認 リアルタイム・マルチシンボルスキャナー: 最大6つの主要通貨ペアを同時監視 高精度フィルタリング: 7つの確認フィルター(ダイバージェンス、出来高、トレンド、HTF) プロフェッショナルダッシュボード: リアルタイムでWBP値と上位足分析を表示 機関投資家レベルの計算: 対数スケール出来高、VWAP加重、確信度ファクター シグナルシステム: BUY: 強い買い > 75、適度な買い > 65 SELL: 強い売り < 25、適度な売り < 35 インジケーターウィ
フィルタ:
レビューなし
レビューに返信