Matreshka
- インディケータ
- バージョン: 1.3
- アップデート済み: 14 4月 2019
- アクティベーション: 5
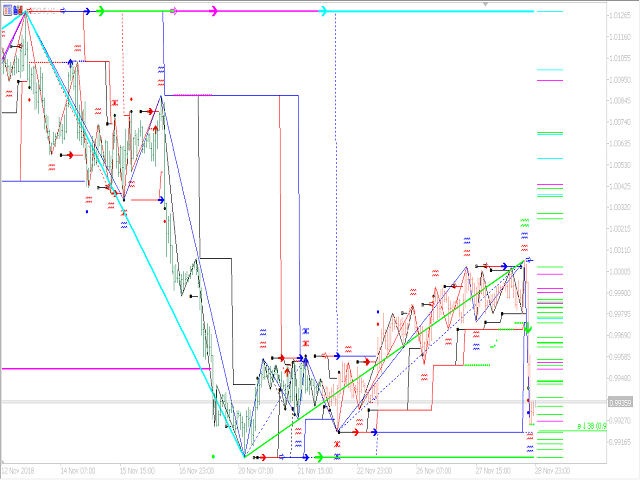
Matreshka self-testing and self-optimizing indicator:
1. Is an interpretation of the Elliott Wave Analysis Theory.
2. Based on the principle of the indicator type ZigZag, and the waves are based on the principle of interpretation of the theory of DeMark.
3. Filters waves in length and height.
4. Draws up to six levels of ZigZag at the same time, tracking waves of different orders.
5. Marks Pulsed and Recoil Waves.
6. Draws arrows to open positions
7. Draws three channels.
8. Notes support and resistance levels.
9. Draws three types of Fibonacci meshes.
10. Redraws only the cost on the newest bar, except for the Fibonacci Extension mesh.
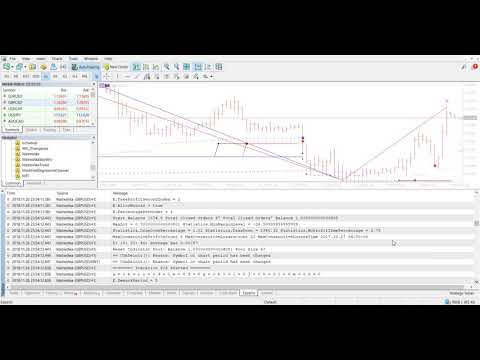
11. Has the ability to simulate trade in test and operating modes, as well as has the ability to self-test and self-optimization.
12. Contains Money Management
The indicator consists of lots of modules, and therefore on a stage of ongoing development and refinement. Full description is in the blog:
https://www.mql5.com/en/blogs/post/723022
https://www.mql5.com/en/blogs/post/723026
https://www.mql5.com/en/blogs/post/723028
https://www.mql5.com/en/blogs/post/723033
https://www.mql5.com/en/blogs/post/723035

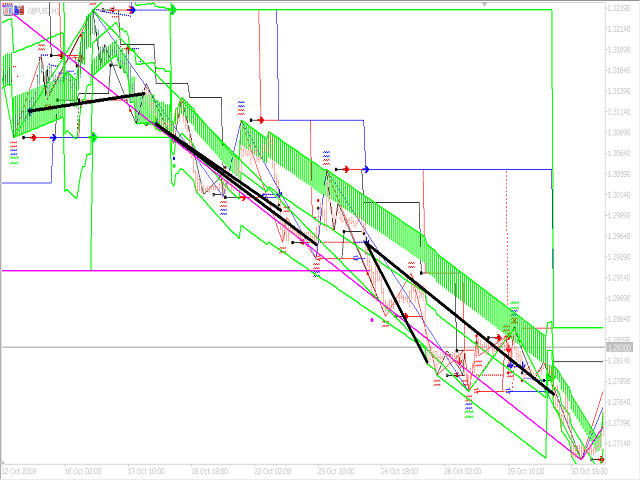
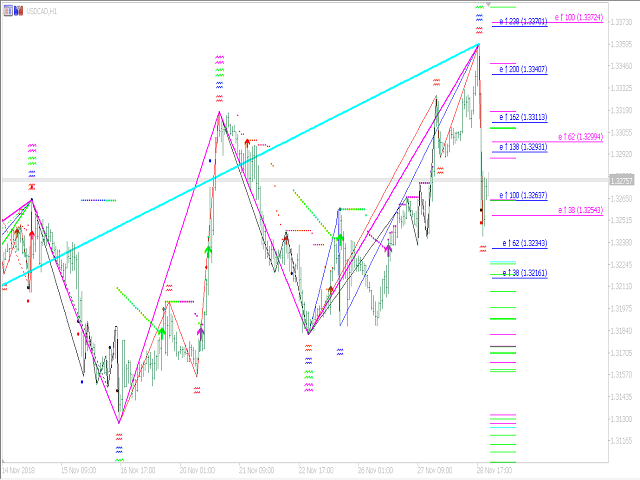
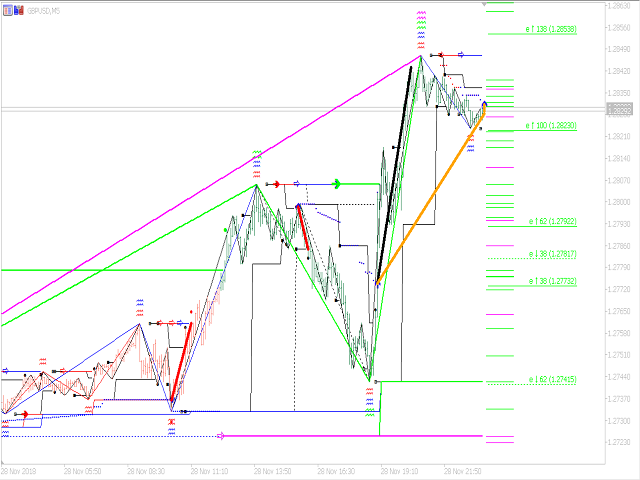
perfect tool, with Matreshka you see well where the key pricing points are. Recommended for those who want a "PLUS" in trading.