Go Ferramentas

This product is a set of tools that help the trader to make decisions, bringing information from different categories that complement each other: trend, support / resistance and candle patterns.
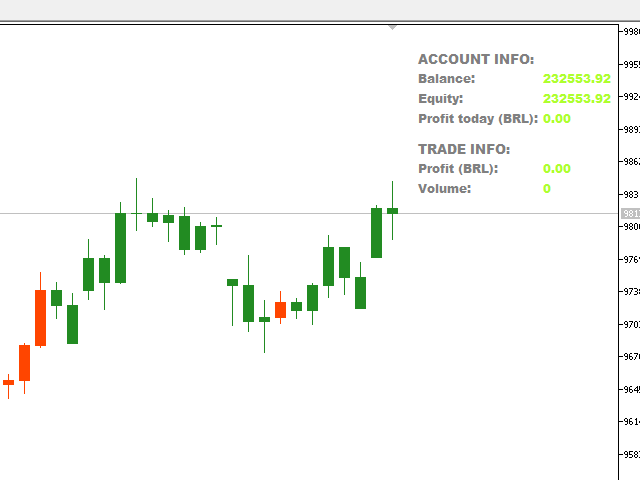
It also has a panel with information about the balance.
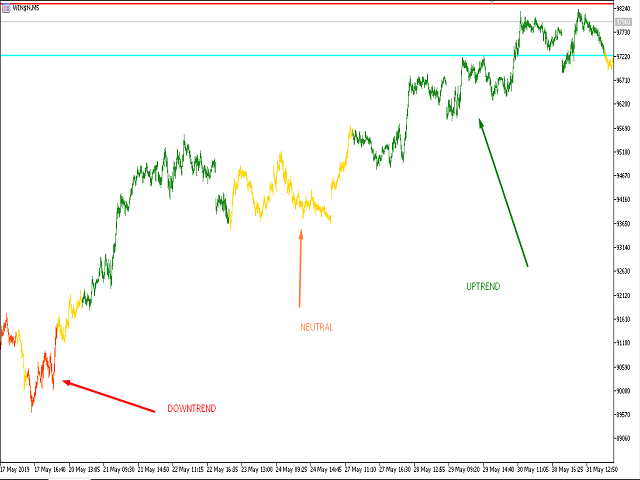
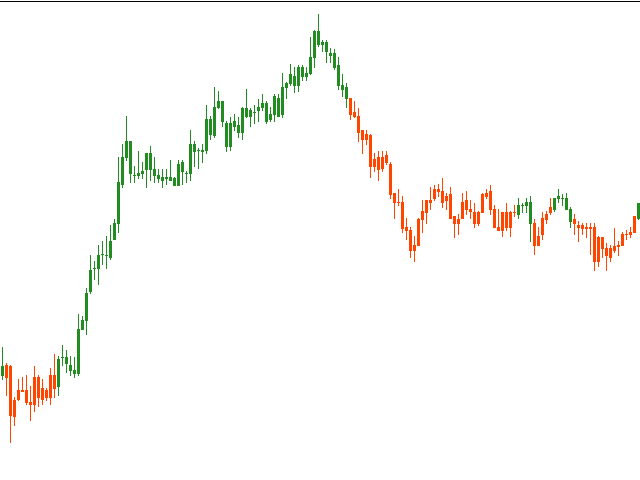
The trend has two different calculations and is shown as colored candles. Strategy 1 is longer, having 3 different states: up, down and neutral trend. Strategy 2 has a faster response and has only 2 states: up and down trend.
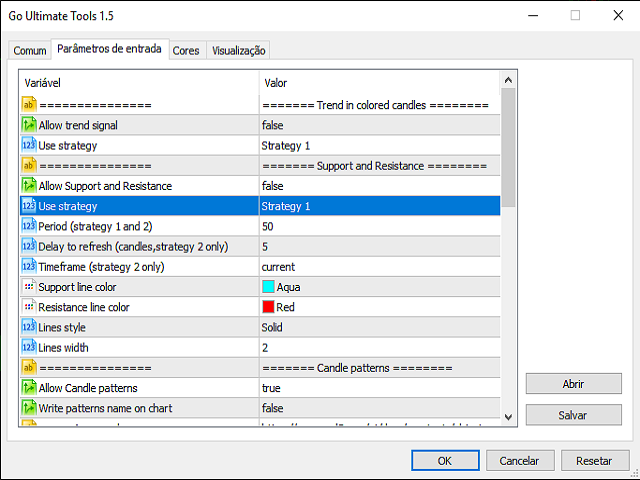
Support and resistance also has 2 calculation modes (strategy 1 and 2).
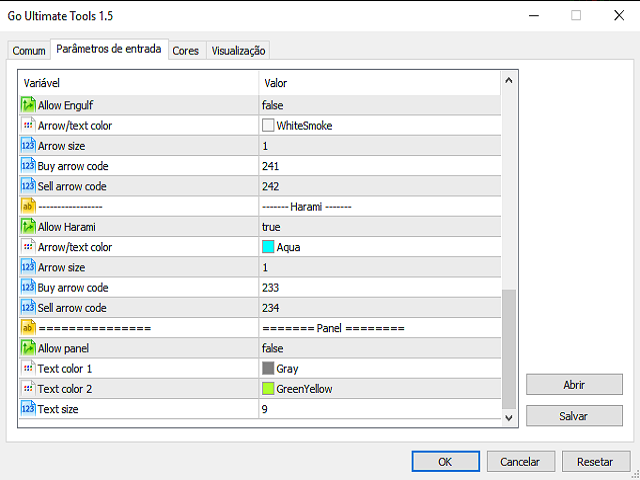
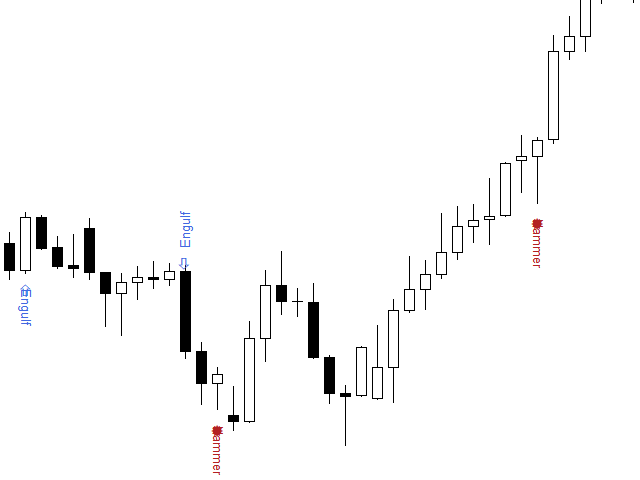
Available candle patterns are hammer / shooting star / hanged, engulf and harami.

Parameters:

Allow trend signal (true/false)
Use strategy: strategy used to calculate trend (1 or 2)
Allow Support and Resistance (true/false)
Use strategy: strategy used to calculate Sup and Res (1 ou 2)
Period (strategy 1 and 2): period to calculate Sup and Res. Used for strategies 1 and 2
Delay to refresh (candles,strategy 2 only): time (in candles) to refresh Sup and Res calculations (only for strategy 2)
Timeframe (strategy 2 only): timeframe used to calculate Sup and Res (only for strategy 2)
Support line color
Resistance line color
Lines style: solid, dashdot, etc
Lines width
Allow Candle patterns (true/false)
Write patterns name on chart (true/false): write patterns name above candles
Arrow codes: is the code that defines the design of the arrows. The designs available are at: https://www.mql5.com/pt/docs/constants/objectconstants/wingdings
Allow Hammer/Shooting star (true/false)
Minimum body size (points): minimum size of candle body in pattern Hammer/Shooting star
Greater shadow (x body size, at least): how much (multiplier) the largest shadow of the candle needs to be larger than the body at minimum
Smaller shadow (% max of body size): maximum percent of body size the smaller shadow can be (100% means that the smaller shadow can be up to the same body size)
Arrow/text color: arrow and text color to the Hammer/Shooting star pattern
Arrow size: Arrow size to the Hammer/Shootingstar star pattern
Buy arrow code: code (see the link above) that will set the drawing of the buy arrow to the Hammer/Shooting star pattern
Sell arrow code: code (see the link above) that will set the drawing of sell arrow to the Hammer/Shooting star pattern
Allow Engulf (true/false)
Arrow/text color: arrow and text color to the Engulf pattern
Arrow size: Arrow size to the Engulf pattern
Buy arrow code: code (see the link above) that will set the drawing of the buy arrow to the Engulf pattern
Sell arrow code: code (see the link above) that will set the drawing of sell arrow to the Engulf pattern
Allow Harami (true/false)
Arrow/text color: arrow and text color to the Harami pattern
Arrow size: Arrow size to the Harami pattern
Buy arrow code: code (see the link above) that will set the drawing of the buy arrow to the Harami pattern
Sell arrow code: code (see the link above) that will set the drawing of sell arrow to the Harami pattern
Allow panel (true/false): panel with balance informations
Text color 1: panel text color
Text color 2: panel text color
Text size: panel letter size
おすすめのプロダクト
This indicator shows external bars ("Aussenstäbe") in the chart in candle form. The colors of the candles can be set individually. Also different colors for bearish and bullish bars are possible. In addition, the color of the wicks or outlines is also adjustable. Outside bars are mentioned e.g. by Michael Voigt in the book "Das große Buch der Markttechnik". All other candles are inner bars.
Smart FVG Levels Indicator for MT5   Category   Platform Level   Type     Time frames   trader style market   ICT SMC Indicator Meta Trader 5 Level Indicator Level Indicator All Time frames Scalpers  Day Traders  Swing Traders  Position Traders All Type of Markets Introduction The Smart FVG Levels Indicator for MT5 is a powerful trading tool designed to help you identify Fair Value Gaps (FVGs) automatically on your charts. Whether you are a beginner or an experienced trader, this ind
This is a simple arrow system based on Engulfing Candlestick Pattern. It gives you alerts on your smartphone when there is an engulfing candlestick pattern happens. Which type of alerts available? 1. It paints on chart Up/Down Arrows. 2. Popup message and sound alert in trading terminal window. 3. Push notification or Alert on your Android and IOS mobile phones (requires MT4 or MT5 app installed!) *Note: Use it on higher timeframes like H4 (4 hours), D1 (1 Day) then find trade opportunities on s
BEHOLDER – THE INDICATOR THAT REVEALS HIDDEN PATTERNS IN TIME THE REAL TRADER’S PROBLEM: TEMPORAL BLINDNESS Every week, thousands of traders face the same dilemma: A flood of economic events (NFP, CPI, Interest Rates, Retail Sales…) Very little time to analyze correlations Decisions made on “gut feeling,” without reliable historical context Trying to do this manually is insane: Scrolling back through dozens of weeks on the calendar Comparing event by event Trying to calculate patt
Strength Candles
Luis Paulo Rodrigues Pastor
Indicator in histogram format, which is calculated using data on financial volume, tick volume and the body of the bar. It is possible to visualize moments where there was a large entry of volume, both financial and in ticks, and that the market managed to progress and advance in one direction (up or down) due to the size of the bar body, which is where there really was a victory for one side of the negotiation (buyers and sellers). By default, all bars in the indicator's histogram are colore
Gann Box MT5
Frederic Jacques Collomb
Gann Box インジケーターは、トレーダーが市場の重要なレベルを特定し、活用するのを支援するために設計された強力で多機能なツールです。このインジケーターを使用すると、チャート上に長方形を描くことができ、それが自動的に 0, 0.25, 0.50, 0.75, 1 の戦略的レベルを持つ複数のゾーンに分割されます。価格がこれらのレベルのいずれかに達すると、アラートがトリガーされ、トレーディングの意思決定に貴重な支援を提供します。描いたゾーンに対する市場の動きを即座に把握できます。ゾーンをトレースするには、単純な長方形を描いて名前を GannBox に変更するだけです。 このインジケーターは、 サポートとレジスタンス の概念を使用するトレーダー、 サプライとデマンド 、 ICTテクニック 、または**公正価値ギャップ(FVG)**の専門家など、すべてのタイプのトレーダー向けに設計されています。 デイトレーダー、スイングトレーダー、またはポジショントレーダーであろうと、 Gann Box は市場の動きをより良く理解し予測する手助けをし、反応性とパフォーマンスを向上させます。 MT4バージョ
KT Candlestick Patterns Scanner is a Multi-Symbol and Multi-Timeframe scanner that fetches and shows various candlestick patterns on 28 currency pairs and 9 time-frames concurrently . The scanner finds the candlestick patterns by loading the KT Candlestick Patterns indicator as a resource in the background. Features The scanner can find the candlestick patterns on 252* combinations of symbols and time-frames from a single chart. Open the signal's chart loaded with a predefined template with a s
KT Price Border MT5
KEENBASE SOFTWARE SOLUTIONS
KT Price Border は、3本のバンドで構成された価格チャネルを作成し、市場のスイングハイとスイングローの可能性がある領域を特定します。これらのレベルは、動的なサポートおよびレジスタンスとしても使用できます。 中央のバンドは、トレンドの方向を識別するためにも使用できます。そのため、このインジケーターはトレンドフォロー型の指標としても機能します。さらに、使いやすさとシンプルなトレードシグナルにより、初心者トレーダーにとって非常に有益です。 特徴 ほとんどの FX 通貨ペアで優れたパフォーマンスを発揮します。 短時間足と長時間足の両方で使用可能です。 スキャルピング、デイトレード、スイングトレードに適しています。 トレンドフォロー戦略と逆張り戦略の両方に対応しています。 価格がバンドを超えたときにアラートを送信できます。 価格バンドは、動的なサポートおよびレジスタンスレベルとして機能します。  価格境界の概念を理解する このインジケーターは、ボリンジャーバンドと同様に機能します。下部バンドは、市場の売られ過ぎ状態を示し、動的なサポートとして機能します。 上部バンドは、市場の
MTF Levels And Moving Averages is a professional indicator designed to identify key support and resistance levels across multiple timeframes. The tool helps traders locate precise entry and exit points by analyzing market structure and price action patterns. Key Features The indicator provides multi-timeframe analysis covering H1, H4, D1, and W1 periods simultaneously. It identifies supply and demand zones where price typically reacts, using color-coded visualization to distinguish between dif
E2C Lines
Eduardo Cristian De Carvalho
Descubra o poder do nosso indicador de alta precisão, projetado para identificar as regiões de alvo e exaustão de qualquer ativo. Testado e validado por mais de 3 anos nos mercados de mini dólar e mini índice, ele oferece confiabilidade e eficácia incomparáveis. Transforme sua estratégia de trading e alcance novos patamares de sucesso com nossa ferramenta inovadora.
Aurum Quant Engine Pro A disciplined execution model designed for decision clarity, trend alignment, and precise signal filtration. Trades are triggered only when price structure, directional context, and pattern strength align cohesively. Aurum Quant Engine Pro is the enhanced Version 2 of the original release Aurum Quant Engine now equipped with advanced filtering layers for improved trade quality, precision entries, and stronger overall performance. Support & Feedback If you have any qu
Session Momentum Dashboard – 未来型トレーディング分析ツール アジア/ロンドン/ニューヨークの主要3セッションを分析し、Kill Zone検出、アジアレンジブレイクアウト、モメンタムスコアをリアルタイムで表示するプロフェッショナルダッシュボード。 Session Momentum Dashboard ICT/Smart Money トレーダー向けのオールインワン市場セッション監視ツール。 主な機能: 主要3セッション分析 アジア、ロンドン、ニューヨークセッションのリアルタイムステータス。 Kill Zone検出 ロンドン Kill Zone(7:00–9:00) ニューヨーク Kill Zone(12:00–14:00) 自動アラート付き。 アジアレンジブレイクアウト アジアレンジのグラフィカル表示 上方向/下方向のブレイクアウト検出 モメンタムスコアリング セッションごとのRSIベースのプログレスバー 出来高分析 出来高 vs 平均の比率 分類: LOW / NORMAL / HIGH トレードシグナル 以下が揃ったときに強力なシグナル: Kill Zon
フィボナッチ ソナー フィボナッチ ソナーには、28 のシンボルと 7 つの時間枠から収集された価格アクション パターンの内部ライブラリがあります。 各パターンは 2 つのサイドに分割されます。前サイドと後サイドです。フィボナッチ ソナーは前サイドを使用して類似パターンを認識します。最新のバーの始値までの最新の価格アクション (任意の時点) が、ライブラリの検索に前サイドとして使用されます。 後サイドには、各パターンで発生したすべてのアクティビティの集計が保持されます。ここでフィボナッチ項が登場します。過去の各パターンのすべてのインスタンスの始値から、始値の上と下の価格レベルをフィボナッチ シーケンスで展開しました。次に、価格レベルに到達した回数を測定しました。価格レベルに到達した回数を、1 つの個別の価格パターンに存在するインスタンスの数で割ると、パーセンテージ (%) として抽出できます。 当然、各パターンには、上部のフィボナッチ価格と下部のフィボナッチ価格にパーセンテージがあることが想像できます。これにより、% 値を指定して価格を見つけるメソッドが可能になります。たとえば、
CRT Pro Dashboard – Multi Timeframe Candle Range Theory Tool CRT Pro Dashboard is a professional multi-timeframe Candle Range Theory (CRT) analysis tool designed for traders who focus on range-based market behavior, liquidity interaction, and structured price expansion . The indicator continuously scans multiple timeframes to detect valid CRT formations , tracks their progression in real time, and displays their status through a clean, intuitive dashboard directly on the chart. What the indic
The Signal Sunrise channel indicator automatically builds a trend movement support channel. The price is in its trend movement in a certain range, and not a chaotic spread of the price is unclear in which direction. And if the price deviates within a certain range, then this means that the boundaries of these ranges are support and resistance lines and form a channel. It is no secret that the wave theory, like many others, is based on observations, however, one of the most important patterns i
Xtrade Trend Detector is an indicator capable of finding the best opportunities to take a position in any stock market. Indeed, it is a great tool for scalpers but also for Daytraders. You could therefore use it to identify areas to trade, it fits easily on a chart. I use it to detect trends on Big timeframes and take positions on Small timeframes. Don't hesitate to give me a feedback if you test it.
Send me a message so I can send you the setfile 複数の構成が可能な堅牢なロボット 以下のスクリーンショットの設定を使用して、10 分間の時間枠で BTC を使用します。 エキスパート ロボットを購入すると、ボットを継続的に改善するために変更を要求する権利があります。 主な特徴 移動平均クロスオーバー戦略: EA は 2 つの移動平均 (MA1 と MA2) を使用して取引シグナルを生成します。 より速い MA (MA1) がより遅い MA (MA2) より上または下にクロスオーバーすると、取引がトリガーされます。 マーチンゲール戦略: 取引で損失が発生した場合、次の取引のロット サイズは乗数 (martingaleMultiplier) によって増加されます。 マーチンゲール シーケンスは、トレードが成功した後、またはマーチンゲール ステップの最大数 (maxMartingale) に達したときにリセットされます。 リスク管理: ストップロス(SL)とテイクプロフィット(TP)のレベルは設定可能です。 利益を確定し
The Absorption & Exhaustion Detector Professional indicator is a sophisticated volume analysis tool designed to identify critical market turning points by analyzing the relationship between price movement and cumulative volume delta (CVD). This indicator helps traders spot when price movements lack volume confirmation, indicating potential absorption or exhaustion zones. KEY FEATURES Real-time Cumulative Volume Delta (CVD) calculation and normalization Price-volume divergence gap measurement dis
Niubility Trend  Niubility Trend  displays the trend direction for all time frames in real time. You'll see at a glance at which direction the trends are running, how long they last and how powerful they are. All this makes it an easy-to-use trend trading system for beginners, advanced and professional traders. Features Easy to trade Customizable colors and sizes It is non-repainting and non-backpainting It is fantastic as a trailing stop method It implements alerts of all kinds
--- StudentK Sync Chart --- 1. Move charts at the same time 2. Cross check among different Symbols and Timeframes 3. Plan your own trading strategies --- Context --- StudentK is not indicated as a master or K Sir for knowledgeable person who claims for winning all the time. (But lots of traders should know the fact that it is rarely truth, especially in fluctuated period of time) StudentK is a group of years-experienced traders who want to share amazing tools in Free and Paid versions. Aiming
Candle Timer Countdown v2.5 is an advanced MQL5 indicator designed to enhance your trading precision. It provides a live countdown for each candle while simultaneously analyzing multiple timeframes to detect trend direction and potential early reversals. Key features include: Candle Countdown & Progress Bar: Monitor the exact time remaining for each candle with a clear progress visualization. Advanced Trend Detection: Analyze both fast and slow trends with configurable sensitivity and multi-time
ADR Pro
Oleksandr Myrhorodskyi
ADR Pro — Auto Adaptive Daily Range & Volatility Indicator (ATR + ADR + Alerts) Auto Adaptation. All Markets. No Guesswork . Enhance your trading decisions with precise ADR levels — for Forex, Crypto, Stocks, Indices, Metals, Energy, Commodities, and ETFs. Easy Setup Professional Features Lifetime Free Updates ADR Pro is your personal "volatility compass" that shows the real daily range boundaries for any asset. Forget manual calculations and constant parameter adjustments — the indicator
Trend Speakerインジケーター は、リアルタイムで市場のトレンドを簡単に追跡し、分析したいトレーダーのために設計された強力なツールです。チャート上で明確で信頼できる買いと売りのシグナルを提供し、市場の現在のトレンドを非常に便利に評価できます。ユーザーフレンドリーなインターフェースを備えたTrend Speakerは、潜在的な取引機会を見逃すことなく、情報に基づいた意思決定を行い、取引戦略を強化するのに役立ちます。すべてのBUYおよびSELLシグナルには、ストップロス(Stop Loss)とテイクプロフィット(Take Profit)が表示されます。 スクリーンショットでは: 緑の点は、TP1からTP7までのTake Profitを表します 赤い点は、Stop Lossを表します。 使用法: すべての時間枠で実行できます。 BUYおよびSELLの矢印の色と幅を自分で簡単に変更できます。 このインジケーターの使用は非常に簡単で便利です。リラックスして、すべてがうまくいきます。 プロパティを変更することで、TPとSLを簡単に表示または非表示にできます。 もしこのインジケーターが
Benefits: A new and innovative way of looking across multiple timeframes and multiple indicators on any chart. Provides instant multi-timeframe analysis of any market. i.e. forex currency pairs, cryptocurrency pairs, commodities, etc. It offers precise indications across multiple timeframes of volatility as measured by RSI, ADX and STOCH within one chart. Helps you determine high probability trading setups. See example strategy in comments. Can see bullish/bearish volatility building across mult
Linear Trend Predictor ー - エントリ ポイントと方向サポート ラインを組み合わせたトレンド インジケーター。高値/安値チャネルを突破するという原理に基づいて機能します。 インジケーターのアルゴリズムは市場のノイズをフィルタリングし、ボラティリティと市場の動向を考慮します。 インジケーターの機能  平滑化手法を使用して、市場のトレンドと、買い注文または売り注文を開くためのエントリー ポイントを表示します。  任意の時間枠のチャートを分析して、短期および長期の市場の動きを判断するのに適しています。  あらゆる市場や時間枠に適応可能な入力パラメータにより、トレーダーはインジケーターを独自にカスタマイズできます。  設定されたインジケーター信号は消えず、再描画もされません。ローソク足の終値で決定されます。  いくつかの種類の通知が矢印と組み合わされています。  このインジケーターは、独立した取引システムとして使用することも、他の取引システムへの追加として使用することもできます。  あらゆるレベルの経験を持つトレーダーが使用できます。 主なパラメータ Vol
Adaptive Math Zones Indicator is a professional MT5 indicator designed to identify high-probability price reaction areas using mathematical price projections and Fibonacci-based channel structures. The indicator automatically builds a reference price channel, highlights neutral zones, and projects future price levels (50%, 100%, and 200%), helping traders visually understand market structure and potential reaction points. This tool is especially effective during ranging and corrective market con
Link to our products: LINK The ICT Asian Killzone Indicator delivers a professional, institutional-grade framework by precisely defining the Asian trading session from 00:00 to 04:00 GMT with absolute accuracy. It streamlines market structure analysis by isolating liquidity accumulation, range formation, and volatility compression during the Asian session. Built for serious ICT and Smart Money traders, it enhances strategic decision-making, execution confidence, and Tokyo session directional bi
Previous Candle Levels MT5
Wachinou Lionnel Pyrrhus Sovi Guidi
1 (1)
Previous Candle Levels MT5 shows the previous candle levels, it shows the previous candle Open High Low Close levels (OHLC Levels) in different time frame. It's designed to help the trader to analyse the market and pay attention to the previous candle levels in different time frame.  We all know that the OHLC Levels in Monthly, Weekly and Daily are really strong and must of the time, the price strongly reacts at those levels. In the technical analysis, the user can use them as a support and res
FREE
DTFX Algo Zones are auto-generated Fibonacci Retracements based on market structure shifts. These retracement levels are intended to be used as support and resistance levels to look for price to bounce off of to confirm direction.   USAGE Figure 1 Due to the retracement levels only being generated from identified market structure shifts, the retracements are confined to only draw from areas considered more important due to the technical Break of Structure (BOS) or Change of Character (CHo
Go Binary
Fabio Oliveira Magalhaes
The main idea of this product is to generate statistics based on signals from 5 different strategies for the Binary Options traders, showing how the results would be and the final balance based on broker's payout. Strategy 1: The calculation is secret. Strategy 2: The signal is based on a sequence of same side candles (same color). Strategy 3: The signal is based on a sequence of interspersed candles (opposite colors). Strategy 4: The signal consists of the indicators bollinger (we have 3 type
このプロダクトを購入した人は以下も購入しています
SuperScalp Pro — 高度なマルチフィルター対応スキャルピングインジケーターシステム SuperScalp Pro は、クラシックな Supertrend と複数のインテリジェントな確認フィルターを組み合わせた高度なスキャルピング用インジケーターシステムです。M1〜H4 のすべての時間足で効率的に機能し、特に XAUUSD、BTCUSD、および主要なFX通貨ペアに適しています。単体のシステムとして、また既存の取引戦略へ柔軟に統合して使用できます。 本インジケーターは 11 以上のフィルターを統合しており、短期・長期の EMA、トレンド判定に用いる 3 本の EMA、EMA スロープ(EMA slope)、RSI、ADX、出来高、VWAP、ボリンジャーバンドのブレイクアウト、MACD ダイバージェンスフィルターなどを含みます。スマートキャンドルフィルターはローソク足の終値を確認して弱いシグナルを排除し、3 本の EMA と MACD ダイバージェンスを組み合わせたトレンド認識メカニズムにより勝率の高いシグナルの選別を支援します。 SuperScalp Pro は ATR に基
このインジケーターを購入すると、プロ仕様のトレードマネージャーを無料で差し上げます。 まず第一に、このトレーディングシステムがノンリペイント、ノンリドロー、ノンラグのインジケーターであることを強調する価値がある。これにより、手動取引とロボット取引の両方に理想的なものになっています。 オンラインコース、マニュアル、プリセットのダウンロード。 「スマートトレンドトレーディングシステム MT5」は、新規および経験豊富なトレーダー向けにカスタマイズされた包括的なトレーディングソリューションです。10以上のプレミアムインジケーターを組み合わせ、7つ以上の堅実なトレーディング戦略を備えており、多様な市場状況に対応する多目的な選択肢となっています。 トレンドフォロー戦略:トレンドを効果的に乗り越えるための正確なエントリーとストップロス管理を提供します。 リバーサル戦略:潜在的なトレンドの反転を特定し、トレーダーがレンジ相場を活用できるようにします。 スキャルピング戦略:高速で正確なデイトレードおよび短期取引のために設計されています。 安定性:すべてのインジケーターはノンリペイント、ノンリドロー、ノ
このインジケーターを購入された方には、以下の特典を 無料 で提供しています: 各トレードを自動で管理し、ストップロスとテイクプロフィットを設定し、戦略ルールに基づいてポジションを決済する補助ツール 「Bomber Utility」 様々な銘柄に合わせたインジケーターの設定ファイル(セットファイル) 「最小リスク」、「バランスリスク」、「待機戦略」 の3つのモードで使用できる Bomber Utility 用の設定ファイル このトレーディング戦略をすぐに導入・設定・開始できる ステップバイステップのビデオマニュアル ご注意: 上記の特典を受け取るには、MQL5のプライベートメッセージシステムを通じて販売者にご連絡ください。 オリジナルのカスタムインジケーター 「Divergence Bomber(ダイバージェンス・ボンバー)」 をご紹介します。これは、MACDのダイバージェンス(乖離)戦略に基づいた 「オールインワン」型のトレーディングシステム です。 このテクニカルインジケーターの主な目的は、価格とMACDインジケーターの間に発生するダイバージェンスを検出 し、将来の価格の動きを示す
FX Trend NG:次世代マルチマーケット・トレンドインテリジェンス 概要 FX Trend NG は、複数の時間足に対応したプロフェッショナル向けトレンド分析およびマーケット監視ツールです。 市場全体の構造を数秒で把握することができます。 複数のチャートを切り替える必要はありません。どの銘柄がトレンド中なのか、どこでモメンタムが弱まっているのか、そしてどの時間足で強い整合性があるのかを瞬時に確認できます。 ローンチ特別オファー – FX Trend NG を $30(6ヶ月) または $80 永久ライセンス でご利用いただけます。 すでに Stein Investments のユーザーですか? -> メッセージを送信 して、プライベートグループへアクセスしてください。 セットアップや詳細情報が必要ですか? -> Stein Investments 公式ページ をご覧ください。 1. FX Trend NG が他と異なる理由 3ステート・トレンドロジック ― Buy と Sell だけではない • 多くのインジケーターは Buy または Sell の2状態のみを表示します。
Entry In The Zone and SMC Multi Timeframe is a real-time market analysis tool developed based on Smart Money Concepts (SMC). It is designed to analyze market structure, price direction, reversal points, and key zones across multiple timeframes in a systematic way. The system displays Points of Interest (POI) and real-time No Repaint signals, with instant alerts when price reaches key zones or when signals occur within those zones. It functions as both an Indicator and a Signal System (2-in-1), c
Game Changerは、あらゆる金融商品で使用できる革新的なトレンドインジケーターです。MetaTraderを強力なトレンドアナライザーへと変貌させます。あらゆる時間枠で動作し、トレンドの特定、反転の可能性のシグナル、トレーリングストップ機能、そして迅速な市場反応のためのリアルタイムアラートを提供します。経験豊富なプロでも、優位性を求める初心者でも、このツールは自信と規律、そして根本的なトレンドダイナミクスを明確に理解した上で取引を行うための力となります。このインジケーターはリドロー機能も備えています。 購入後すぐにご連絡いただければ、個人ボーナスを進呈いたします。Strong SupportとTrend Scannerインジケーターの無料コピーを入手できます。[email protected]までプライベートメッセージを送ってください。 私のEAや特別なセットはTelegramでは販売しておりません。MQL5でのみ販売しており、セットファイルは私のブログでのみ公開しています。詐欺師にはご注意ください。他の方からセットを購入しないでください。 設定 トレンド変化時のアラート
Power Candles – あらゆる市場に対応した強度ベースのエントリーシグナル Power Candles は、Stein Investments が長年培ってきた強度分析を価格チャート上に直接反映します。価格だけに反応するのではなく、各ローソク足は実際の市場の強さに基づいて色分けされ、モメンタムの蓄積、強度の加速、明確なトレンド転換を瞬時に把握できます。 すべての市場に共通する単一ロジック Power Candles は すべての取引シンボル で自動的に動作します。現在のシンボルが Forex か非 Forex 市場かを自動判別し、内部で適切な強度モデルを適用します。 Forex および Gold :FX Power のデルタ値を使用(絶対値レンジ最大 100) 指数、暗号資産、CFD :IX Power の強度値を使用(絶対値レンジ最大 50) 必要な強度計算は Power Candles に直接組み込まれています。ローソク足のカラーリングやシグナルロジックに、追加のインジケーターは不要です。 価格ノイズではなく「強度状態」 各ローソク足は、以下の 9 つの明確に定義された強
ARIPoint is a powerful trading companion designed to generate high-probability entry signals with dynamic TP/SL/DP levels based on volatility. Built-in performance tracking shows win/loss stats, PP1/PP2 hits, and success rates all updated live. Key Features: Buy/Sell signals with adaptive volatility bands Real-time TP/SL/DP levels based on ATR Built-in MA Filter with optional ATR/StdDev volatility Performance stats panel (Success, Profit/Loss, PP1/PP2) Alerts via popup, sound, push, or email Cu
FX Power: 通貨の強弱を分析して、より賢い取引を実現 概要 FX Power は主要通貨と金の実際の強弱をあらゆる市場状況で理解するための必須ツールです。強い通貨を買い、弱い通貨を売ることで、 FX Power は取引の意思決定を簡素化し、高い確率の取引機会を見出します。トレンドを追従する場合でも、極端なデルタ値を使用して反転を予測する場合でも、このツールはあなたの取引スタイルに完全に適応します。ただ取引するだけではなく、 FX Power で賢く取引をしましょう。 1. なぜ FX Power がトレーダーにとって非常に有益なのか 通貨と金のリアルタイム強弱分析 • FX Power は主要通貨と金の相対的な強弱を計算し、マーケットダイナミクスに関する明確な洞察を提供します。 • どの資産がリードしているか、または後れを取っているかを監視して、取引するペアを賢く選びましょう。 マルチタイムフレームの包括的なビュー • 短期、中期、長期のタイムフレームで通貨と金の強弱を追跡し、マーケットトレンドに基づいて取引戦略を調整できます。 • スキャルピングからスイングトレード
Azimuth Pro
Ottaviano De Cicco
5 (4)
発売プロモーション Azimuth Proは先着100名様限定で 299ドル でご提供します。最終価格は 499ドル となります。 リテールとインスティテューショナルのエントリーの違いはインジケーターではなく、ロケーションにあります。 多くのトレーダーは、モメンタムを追いかけたり、遅行シグナルに反応して、任意の価格レベルでエントリーします。機関投資家は、需給が実際にシフトする構造的なレベルに価格が到達するのを待ちます。 Azimuth Proはこれらのレベルを自動的にマッピングします:スイングアンカーVWAP、マルチタイムフレーム構造ライン、高確率ロケーションにのみ出現するABCパターン。 Azimuth Proは、構造分析とインテリジェントな自動化の両方を求めるプロフェッショナルトレーダー向けに構築されています。 Azimuthが外科的精度で市場構造をマッピングする一方、Azimuth Proはインテリジェンスレイヤーを追加します:トレーディングスタイルの自動検出、スマート設定された移動平均線、20年のデータでバックテストされた最適化パラメータ。その結果、お使いの銘柄と
トレンド スクリーナー インジケーターでトレンド取引の力を解き放ちます。ファジー ロジックと複数通貨システムを活用した究極のトレンド取引ソリューションです。 ファジー ロジックを活用した革新的なトレンド インジケーターである Trend Screener を使用して、トレンド取引を向上させます。 これは、13 を超えるプレミアム ツールと機能、および 3 つの取引戦略を組み合わせた強力なトレンド追跡インジケーターであり、Metatrader をトレンド アナライザーにする多用途の選択肢となります。 期間限定オファー : トレンド スクリーナー インジケーターは、わずか 100 ドルで生涯ご利用いただけます。 (元の価格 50$ ) (オファー延長) Trend Screener の 100% 非再描画精度の揺るぎない精度を体験して、取引の決定が過去の価格変動の影響を受けないようにしてください。 マルチタイムフレームおよびマルチ通貨機能の多用途性を解放し、比類のない自信を持って外国為替、商品、暗号通貨、インデックスの世界を取引できるようにします。 Trend Screener の包括的な
まず第一に、この取引インジケーターは再描画されず、再描画されず、遅延しないことを強調する価値があります。これにより、手動取引とロボット取引の両方に理想的なものになります。 ユーザーマニュアル:設定、入力、戦略。 アトミックアナリストは、価格の強さとモメンタムを利用して市場でより良いエッジを見つけるためのPA価格アクションインジケーターです。ノイズや誤ったシグナルを除去し、取引ポテンシャルを高めるための高度なフィルターを備えています。複雑なインジケーターの複数のレイヤーを使用して、アトミックアナリストはチャートをスキャンし、複雑な数学的計算をシンプルなシグナルと色に変換します。これにより、どのような初心者トレーダーでも理解して使用し、一貫した取引の決定を行うことができます。 「アトミックアナリスト」は、新規および経験豊富なトレーダー向けにカスタマイズされた包括的な取引ソリューションです。プレミアムインジケーターとトップノッチの機能を1つの取引戦略に組み合わせ、すべてのタイプのトレーダーにとって汎用性のある選択肢にします。 デイリートレーディングとスキャルピング戦略:高速で正確なデイ
Smart Stop Indicator – チャート上で実現するインテリジェントなストップロス精度 概要 Smart Stop Indicator は、ストップロスを勘や感情ではなく、明確で体系的に設定したいトレーダーのために設計されています。本ツールは、クラシックなプライスアクション(高値更新・安値切り下げ)と最新のブレイクアウト認識ロジックを組み合わせ、次に来るべき論理的なストップレベルを正確に特定します。トレンド相場、レンジ、急速なブレイクアウト局面のいずれであっても、最適な SL ゾーンとその状態(“new”、“broken”、“valid”)をチャート上に直接表示します。さらに今回、SL 距離の %ADR 表示も新たに追加されています。 主な特徴 マーケット構造に基づく自動ストップ配置 • 市場構造とリアルタイムの値動きに基づき、意味のあるストップロスレベルを自動検出します。 スマートなブレイクアウト感知 • 急激な方向転換やブレイクアウトにも柔軟に対応し、早すぎるストップ調整を避けます。 SL %ADR の表示 • ストップロスまでの距離を ADR(Averag
このインジケーターは、反転ポイントと価格戻りゾーンを正確に表示します。     主要プレーヤー 。新たなトレンドが形成される場所を把握し、最大限の精度で意思決定を行い、すべての取引をコントロールします。 TREND LINES PRO インジケーターと組み合わせることで、その潜在能力を最大限に発揮します。 VERSION MT4 インジケーターが示す内容: 新しいトレンドの始まりに活性化する反転構造と反転レベル。 リスクと報酬の比率を最小限に抑えた利益 確定 と 損失停止の レベルの表示     RR 1:2   。 インテリジェントな削減ロジックによるストップロス。 指定されたインジケーターから 2 つのトレンド タイプの反転パターンを表示します。 指標: トレンドを追う   TREND LINES PRO   (世界的なトレンドの変化) TREND PRO   (クイックトレンド変更) シンプルで効果的   スキャナー   リアルタイムトレンド(新機能)。 マルチタイムフレームのインストゥルメント フィルタリング。 画面   利益     LOGIC AI信号の後。 当日プラス方
優れたテクニカルインジケーター「Grabber」をご紹介します。これは、すぐに使える「オールインワン」トレーディング戦略として機能します。 ひとつのコードに、市場のテクニカル分析ツール、取引シグナル(矢印)、アラート機能、プッシュ通知が強力に統合されています。 このインジケーターを購入された方には、以下の特典を無料で提供します: Grabberユーティリティ:オープンポジションを自動で管理するツール ステップバイステップのビデオマニュアル:インジケーターのインストール、設定、取引方法を解説 カスタムセットファイル:インジケーターをすばやく自動設定し、最大限の成果を出すための設定ファイル 他の戦略はもう忘れてください!Grabberだけが、あなたを新たなトレードの高みへと導いてくれるのです。 Grabber戦略の主な特徴: 推奨タイムフレーム:M5〜H4 対応通貨ペア・資産:どれでも使用可能ですが、私が実際に検証した以下を推奨します(GBPUSD、GBPCAD、GBPCHF、AUDCAD、AUDUSD、AUDSGD、AUDCHF、NZDUSD、NZDCAD、EURCAD、EURUSD、E
FX Levels: あらゆる市場における非常に高精度なサポート&レジスタンス 概要 通貨ペア、株式指数、個別銘柄やコモディティなど、どのような市場でも信頼できるサポートとレジスタンスを特定したいですか? FX Levels は伝統的な “Lighthouse” メソッドと先進的な動的アプローチを融合し、ほぼ汎用的な精度を実現します。ブローカーの実務経験を活かし、自動化されたデイリー更新とリアルタイム更新を組み合わせることで、 FX Levels は反転ポイントを見つけ、利益目標を設定し、自信をもってトレードを管理するための手助けをします。今すぐ試してみて、サポート/レジスタンス分析の正確性がどれほどトレードを向上させるかを実感してください! 1. FX Levels がトレーダーにとって非常に有用な理由 非常に正確なサポート&レジスタンスゾーン • FX Levels は異なるブローカー環境でもほぼ同一のゾーンを生成するよう設計されており、データフィードの差異や時刻設定のずれによる不一致を解消します。 • つまり、どのブローカーを利用していても一貫したレベルが得られるため、戦
トレンドラインプロ   市場の真の方向転換点を理解するのに役立ちます。この指標は、真のトレンド反転と主要プレーヤーが再び参入するポイントを示します。 分かりますか     BOSライン   複雑な設定や不要なノイズなしに、より長い時間足でのトレンドの変化と重要なレベルを把握できます。シグナルは再描画されず、バーが閉じた後もチャート上に残ります。 MT4バージョン   -   RFI LEVELS PRO インジケーター と組み合わせることで、その最大限の能力を発揮します インジケーターが示す内容: 本当の変化   トレンド(BOSライン) 一度シグナルが現れたら、それは有効です!これは、リペイント機能を持つインジケーターとの重要な違いです。リペイント機能を持つインジケーターは、シグナルを発した後、それを変更し、資金の損失につながる可能性があります。これにより、より高い確率と精度で市場に参入できます。また、矢印が現れた後、目標値(利益確定)に達するか、反転シグナルが現れるまで、ローソク足の色を変更する機能もあります。 繰り返しエントリ   主要プレーヤーの補充 エントリーポイントを探す
Quantum TrendPulse を ご紹介します。これは、   SuperTrend   、   RSI   、および Stochastic のパワーを 1 つの包括的なインジケーターに組み合わせて、取引の可能性を最大限に引き出す究極の取引ツールです。精度と効率を求めるトレーダー向けに設計されたこのインジケーターは、市場のトレンド、勢いの変化、最適なエントリー ポイントとエグジット ポイントを自信を持って特定するのに役立ちます。 主な特徴: SuperTrend 統合: 現在の市場動向に簡単に追従し、収益性の波に乗ることができます。 RSI精度: 買われすぎと売られすぎのレベルを検出し、市場の反転のタイミングに最適で、SuperTrendのフィルターとして使用されます。 確率的精度: 確率的振動を活用して、変動の激しい市場で隠れたチャンスを見つけます。SuperTrend のフィルターとして使用されます。 マルチタイムフレーム分析:   M5 から H1 または H4 まで、さまざまなタイムフレームで市場を常に把握します。 カスタマイズ可能なアラート: カスタム取引条件が満たされ
まず第一に、この取引ツールはノンリペイント、ノンリドロー、ノンラグの指標であり、プロの取引に理想的ですことを強調する価値があります。 オンラインコース、ユーザーマニュアル、デモ。 スマートプライスアクションコンセプトインジケーターは、新米から経験豊富なトレーダーまで、非常 に強力なツールです。Inner Circle Trader AnalysisやSmart Money Concepts Trading Strategiesなど、20以上の有用な指標を1つに組み合わせています。このインジケーターはスマートマネーコンセプトに焦点を当て、大手機関の取引方法を提供し、彼らの動きを予測するのに役立ちます。 特に、流動性分析に優れており、機関がどのように取引しているかを理解しやすくしています。市場のトレンドを予測し、価格の動きを慎重に分析するのに優れています。機関の戦略とトレードを合わせることで、市場の動向についてより正確な予測ができます。このインジケーターは多目的であり、市場構造を分析し、重要な注文ブロックを特定し、さまざまなパターンを認識するのに優れています。 このインジケーター
これはMT5のインジケーターで、再描画なしで取引に参入するための正確なシグナルを提供します。 外国為替、暗号通貨、金属、株式、インデックスなど、あらゆる金融資産に適用できます。かなり正確な見積もりを提供し、取引を開始して終了するのに最適な時期を教えてくれます。1つのシグナルを処理しただけでインジケーターの元が取れた例の 動画 (6:22)をご覧ください。Entry PointsPro インジケーターの助けを借りたほとんどのトレーダーの最初の1週間の結果が改善しています。 Telegramグループ に登録してください。Entry Points Proインジケーターのメリットは次の通りです。 再描画のないエントリーシグナル 再描画されるインジケーターでは一度表示されたシグナルが削除されて大きな金銭的損失につながることがありますが、これと異なり、表示されて確認されたシグナルは消えることがありません。 エラーなしの取引開始 インジケーターアルゴリズムによって取引を開始する(資産を売買する)理想的な瞬間を見つけることができます。それを使用するすべてのトレーダーの成功率が向上します。 あら
Berma Bands
Muhammad Elbermawi
5 (8)
Berma Bands (BBs) インジケーターは、市場のトレンドを特定して活用したいトレーダーにとって貴重なツールです。価格と BBs の関係を分析することで、トレーダーは市場がトレンド段階にあるか、レンジ段階にあるかを判断できます。 詳細については、[ Berma Home Blog ] をご覧ください。 バーマ バンドは、上部バーマ バンド、中部バーマ バンド、下部バーマ バンドの 3 つの異なる線で構成されています。これらの線は価格の周りにプロットされ、全体的な傾向に対する価格の動きを視覚的に表します。これらのバンド間の距離から、ボラティリティや潜在的な傾向の反転についての洞察を得ることができます。 バーマ バンドの線がそれぞれ離れると、市場が横ばいまたはレンジ相場の期間に入っていることを示すことがよくあります。これは、明確な方向性の偏りがないことを示しています。トレーダーは、これらの期間中にトレンドを特定するのが難しいと感じる可能性があり、より明確なトレンドが出現するまで待つ場合があります。 バーマ バンドの線が 1 本の線に収束すると、強いトレンド環境の兆候となること
毎日、多くのトレーダーが共通の課題に直面しています。価格が重要なレベルを突破したように見えてトレードに参入すると、市場が反転してストップロスが発動されるという状況です。これはダマシ(フォールスブレイクアウト)と呼ばれ、価格がサポートまたはレジスタンスレベルを一時的に超えた後、方向を反転させる動きです。これらの動きにより、実際の価格方向が明確になる前にストップロスが発動される可能性があります。 テクニカル分析では、この現象は一般的に「流動性スイープ」(liquidity sweep)または「ストップ狩り」(stop hunt)と呼ばれています。 Mirage Trading Systemは、ダマシパターンを検出するために設計されたインジケーターです。「Mirage」(蜃気楼)という名前は、市場で頻繁に発生する欺瞞的な価格変動という幻想を指しています。 ダマシは多くのトレーダーを不意打ちにする可能性がありますが、Mirage Trading Systemはこれらのパターンがいつ形成されるかを識別し、その後の価格変動の潜在的な方向を示すように設計されています。 ローンチ期間パッケージ ローン
Pointer Trend Switch — precision trend reversal indicator Pointer Trend Switch is a high-precision arrow indicator designed to detect key moments of trend reversal based on asymmetric price behavior within a selected range of bars. It identifies localized price impulses by analyzing how far price deviates from the opening level, helping traders find accurate entry points before a trend visibly shifts. This indicator is ideal for scalping, intraday strategies, and swing trading, and performs equa
Market Structure Patterns
Samuel Manoel De Souza
4.47 (19)
Available for   MT4   and   MT5 . Join the Market Structure Patterns channel to download materials available for study and/or additional informations. Related posts: Market Structure Patterns - Introduction Beyond Fancy Order Blocks: Using True Volumetric Analysis with Market Structure Patterns & Timeless Charts Market Structure Patterns   is an indicator based on   smart money concepts   that displays   SMC/ICT   elements that can take your trading decisions to the next level. Take advantage
Gold Sniper Scalper Proは、MetaTrader 5向けのプロフェッショナルなindicatorで、トレーダーがエントリーポイントを特定し、リスクを効果的に管理するために設計されています。 このindicatorは、シグナル検出システム、Entry/SL/TPの自動管理、ボリューム分析、リアルタイムパフォーマンス統計を含む包括的な分析ツールセットを提供します。 システムを理解するためのユーザーガイド   |   他の言語のユーザーガイド 主な機能 シグナル検出システム このindicatorは、price actionと市場構造の分析に基づいて潜在的なエントリーポイントを自動検出します。トレード機会を検出すると: - BUY(青)またはSELL(赤)の矢印がchart上に表示されます - ローソク足が色付けされ、シグナルゾーンが識別されます - Entry/SL/TPレベルが自動計算されます シグナルは価格がEntryレベルに触れた時のみ発動し、市場に確認されていないシグナルをフィルタリングします。 インテリジェントなEntry/SL/TP管理 - Ent
IX Power MT5
Daniel Stein
4.92 (12)
IX Power: 指数、商品、暗号資産、外国為替市場の洞察を発見 概要 IX Power は、指数、商品、暗号資産、外国為替市場の強弱を分析するための多用途ツールです。 FX Power が全ての利用可能な通貨ペアデータを活用して外為ペアで最高の精度を提供する一方、 IX Power は基礎資産の市場データにのみ焦点を当てています。この特性により、 IX Power は非外為市場に最適であり、単純な外為分析にも信頼性の高いツールです。どのチャートでもスムーズに機能し、取引判断を向上させるための明確で実行可能な洞察を提供します。 1. IX Power がトレーダーにとって価値がある理由 複数市場での強弱分析 • IX Power は指数、商品、暗号資産、外為シンボルの強弱を計算し、それぞれの市場に合わせた洞察を提供します。 • US30、WTI、ゴールド、ビットコイン、または通貨ペアなどの資産を監視して取引機会を発見できます。 幅広い市場に適応 • 外為取引では、 FX Power が関連する全ての通貨ペアを分析することで比類のない精度を提供します。 • IX Power
このインジケーターは、市場で 関心が示されたゾーン をハイライトし、その後に 注文の蓄積ゾーン を表示します。 これは、大規模な**板情報(オーダーブック)**のように機能します。 これは、 巨大な資金 のためのインジケーターです。その性能は卓越しています。 市場にどんな関心が存在していても、 必ず目に見えるようになります 。 (これは 完全に再設計され、自動化されたバージョン です。もはや手動分析は必要ありません。) トランザクションスピード(取引速度) は新しい概念のインジケーターで、市場で大口注文が どこに・いつ 集中しているかを示し、それに基づいたチャンスを提供します。 トレンドの変化を 非常に早い段階 で察知することができます。 FXでは「出来高」と呼ばれているものは誤解されています。実際には、これは 時間あたりの価格変動量 です。したがって、正しい名称は トランザクションスピード です。 考え方・行動・分析の仕方すべてが問われます。 分析パラダイムの転換は非常に重要です。 このインジケーターは、FXにおける出来高の考え方を 根本から再定義 し、論理的な形で正確に活用する、
Market Structure Order Block Dashboard MT5 は、 MT5(MetaTrader 5)用インジケーター です。 市場構造 と ICT / Smart Money Concepts に基づき、 HH/HL/LH/LL 、 BOS 、 ChoCH に加えて、 Order Blocks 、 Fair Value Gaps (FVG) 、 流動性 (EQH/EQL、sweeps)、 セッション / Kill Zones 、 Volume Profile を表示し、コンパクトなコンフルエンス・ダッシュボードを提供します。 重要: これは 分析ツール です。自動売買は行いません(EAではありません)。 購入者特典(ボーナス) 購入後、私のストアから 2つのボーナスインジケーター を(選択して)受け取ることができます。 ボーナスの受け取り方法: 1) 本商品のページに正直なレビューを投稿してください。 2) MQL5のメッセージで、 BONUS MSOB + 選んだ 2つのインジケーター名 を送ってください。 主な機能 市場構造: HH/HL/LH/LL
現在33%オフ 初心者にもエキスパートトレーダーにも最適なソリューション このインジケーターは独自の機能と新しい公式を多数内蔵しており、ユニークで高品質かつ手頃な取引ツールです。このアップデートでは、2つの時間枠ゾーンを表示できるようになります。より長いTFだけでなく、チャートTFとより長いTF(ネストゾーンを表示)の両方を表示できます。すべてのSupply Demandトレーダーの皆さんのお気に召すはずです。:) 重要情報の公開 Advanced Supply Demandの可能性を最大化するには、 https://www.mql5.com/ja/blogs/post/720245 にアクセスしてください。   エントリーまたはターゲットの正確なトリガーポイントを正確に特定できれば取引がどのように改善されるか想像してみてください。新しい基盤となるアルゴリズムに基づいて構築されているため、買い手と売り手の間の潜在的な不均衡をさらに簡単に特定できます。これは、最も強い需要と供給のゾーンと、過去のパフォーマンス(古いゾーンを表示)がグラフィカルに表現されるためです。これらの機能は、最適な
スイングトレーディング は、トレンドの方向のスイングと可能な反転スイングを検出するように設計された最初のインジケーターです。トレーディングの文献で広く説明されているベースラインスイングトレーディングアプローチを使用します。インディケータは、いくつかの価格と時間のベクトルを調査して、全体的なトレンドの方向を追跡し、市場が売られ過ぎまたは買われ過ぎて修正の準備ができている状況を検出します。 [ インストールガイド | 更新ガイド | トラブルシューティング | よくある質問 | すべての製品 ] むち打ちを起こさずに市場スイングの利益 インジケーターは常にトレンドの方向を表示します 色付きの価格帯は機会のベースラインを表します 色付きのダッシュは、可能な反転スイングを表します この指標は、独自の品質とパフォーマンスを分析します 複数時間枠のダッシュボードを実装します カスタマイズ可能なトレンドおよびスイング期間 電子メール/サウンド/プッシュアラートを実装します インジケータは再描画またはバックペインティングではありません Swing Tradingとは Swing Tradingは
作者のその他のプロダクト
Taurus All4 Taurus All4 is a high-performance indicator, it will tell you the strength of the trend, and you will be able to observe the strength of the candle. Our indicator has more than 4 trend confirmations. It is very simple and easy to use. Confirmation Modes Candle Trend Confirmations: When the candle switches to light green the trend is high. When the candle switches to light red the trend is reverting down. When the candle changes to dark red the trend is low. Trendline Trend Confirm
TIMES TRAVEL IN THE TRADE Now you have found what you were looking for !! The Times is based on the probabilistic approach. This EA has been working for years, is a very complex research project with the ultimate goal of creating a perfect trading robot. This project has several updates! This robot does not work with Grid or Martingale / Obs: There is a martingale option in it, but we do not use it, it is only for those who want to be at high risk! The EA comes with fixed Stoploss and fix
Angry bull Option Binary
Fabio Oliveira Magalhaes
1 (1)
Angry Bull Option Binary   This is a Binary Options robot, which contains 7 strategies, you can backtest it to check what the best strategies are Settings Initial Batch Value Dynamic Investment = If activated it will use an automatic lot according to its capital Balance ($) w/ backtest = Starting balance to backtest PorcRiscoInvestment = It will be the value of % for the automatic lot if it is activated Expiration (in minutes) = It will be the expiration time of orders in Binary Options Magic
Indicador Taurus All4   Taurus All4 O Taurus All4 é um indicador de alto desempenho, que indica a força da tendência e você pode observar a força da vela. Nosso indicador tem mais de 4 confirmações de tendência. É muito simples e fácil de usar. Modos de confirmação Confirmações de tendências de velas: Quando a vela muda para verde claro, a tendência é alta. Quando a vela muda para vermelho, a tendência está voltando para baixo. Quando a vela muda para vermelho escuro, a tendência é baixa. Co
Go Depth of Market   This product helps to watch the order book in a easily and friendly way, helping traders to take decisions that are more consistent with the timing of the market. Parameters: Activating EA (robot) mode   if you leave true it will become a robot, if you leave false it will become an indicator. Initial volume  VolumeDynamic   if you leave it enabled will be automatic batch Proportion:   Example: If you put 500 every 500 $ it will open a lot of 1.0 Takeprofit Stoploss Daily pr
Go Binary
Fabio Oliveira Magalhaes
The main idea of this product is to generate statistics based on signals from 5 different strategies for the Binary Options traders, showing how the results would be and the final balance based on broker's payout. Strategy 1: The calculation is secret. Strategy 2: The signal is based on a sequence of same side candles (same color). Strategy 3: The signal is based on a sequence of interspersed candles (opposite colors). Strategy 4: The signal consists of the indicators bollinger (we have 3 type
Go Eleven
Fabio Oliveira Magalhaes
5 (1)
This robot only operates 20 minutes a day during market opening! Recommended for mini Index and mini dollar! Parameters: Initial Volume (recommended: 1 to $ 300) Enable auto volume Ratio x volume balance Subsequent volumes (separate by,) TakeProfit (gain, 0 ñ use) MaxOrders Enable trailing stop function Profit points for triggering trailing  Trailing stoploss distance DistChannel Maximum skidding CreateRowsBreakup = false; ColorRowsRup = clrGold; MagicNumber (ID #)
This EA works with one of the best exit strategies, the grid. But it's not an ordinary grid. In this EA, this strategy is optimized to the extreme to give you the best performance with multiple configuration options to work more safely and profitably. In addition, it manages multiple pairs on a single chart at a time, making them complement each other to make a single management. Parameters: Initial lot: is the lot of the first position of the cycle Allow dynamic initial lot (true/false) : cal
Dragon SuperTrend OB indicator  he Dragon was an indicator developed to capture a new beginning of the trend, it is excellent in Binary Options and Forex and even B3 in the Mini Index and Mini Dolar. It has 4 trend levels in 4 different Times Frames, so you can be sure that you are on the right side of the trend! It is very simple and easy to use, in the end I explain how we will operate with the indicator! Confirmation modes First Line Trend Confirmations: Green Square Upward Trend. Red Squar
フィルタ:
レビューなし
レビューに返信