The Oracle Pro

5

The Oracle Pro:MT5向け合成マルチタイムフレーム・バイアスエンジン

☀️ サマー・ローンチ・オファー — The Oracle Pro を 199 USD で(早期購入者向け)。価格は普及に応じて上昇します。最終価格 399 USD。

The Oracle Pro は、要求の高いプロのトレーダーのために作られた MetaTrader 5 向けのプレミアム・マルチタイムフレームバイアスエンジンです。ひとつの問いに規律をもって答えます。すなわち、各タイムフレームの現在の方向バイアスは何か、その強さはどれほどか、そしてタイムフレーム同士はどれだけ一致しているか。すべては確定足のみで計算され、リペイントはありません。

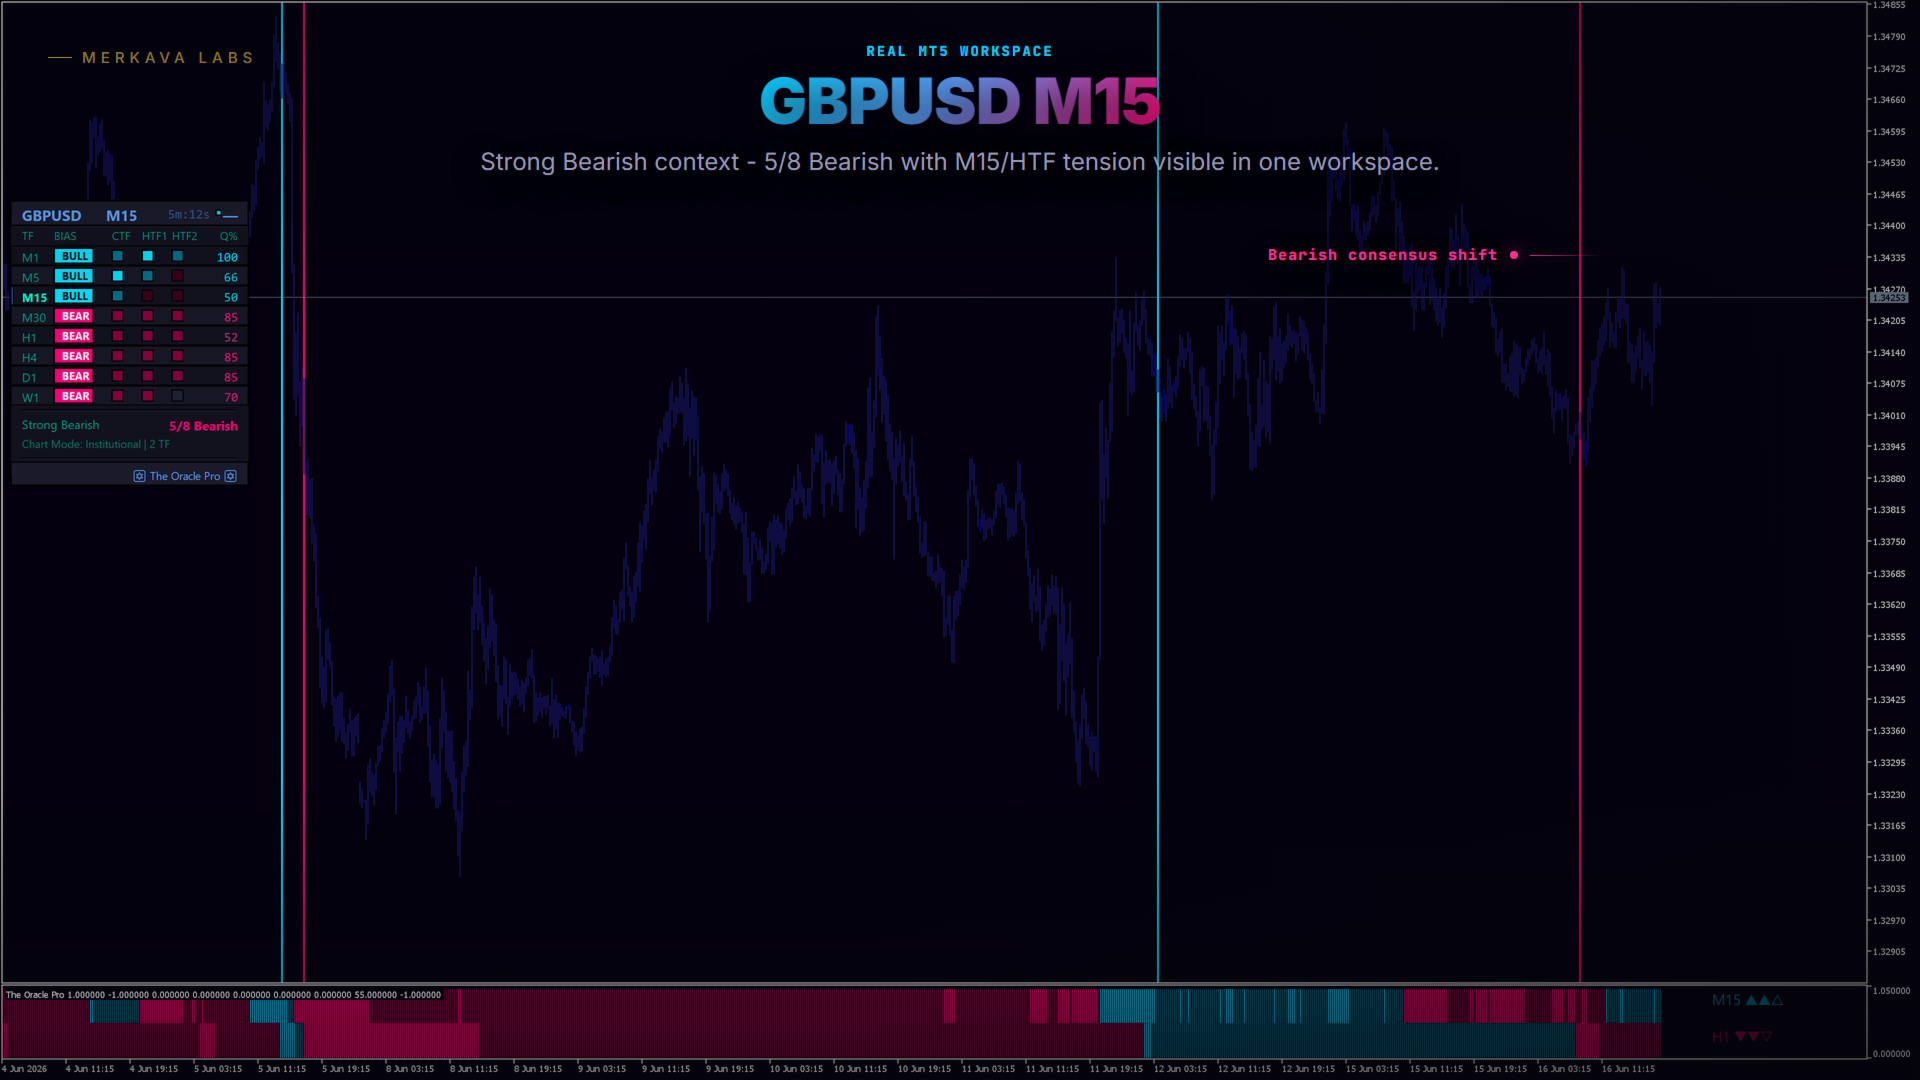
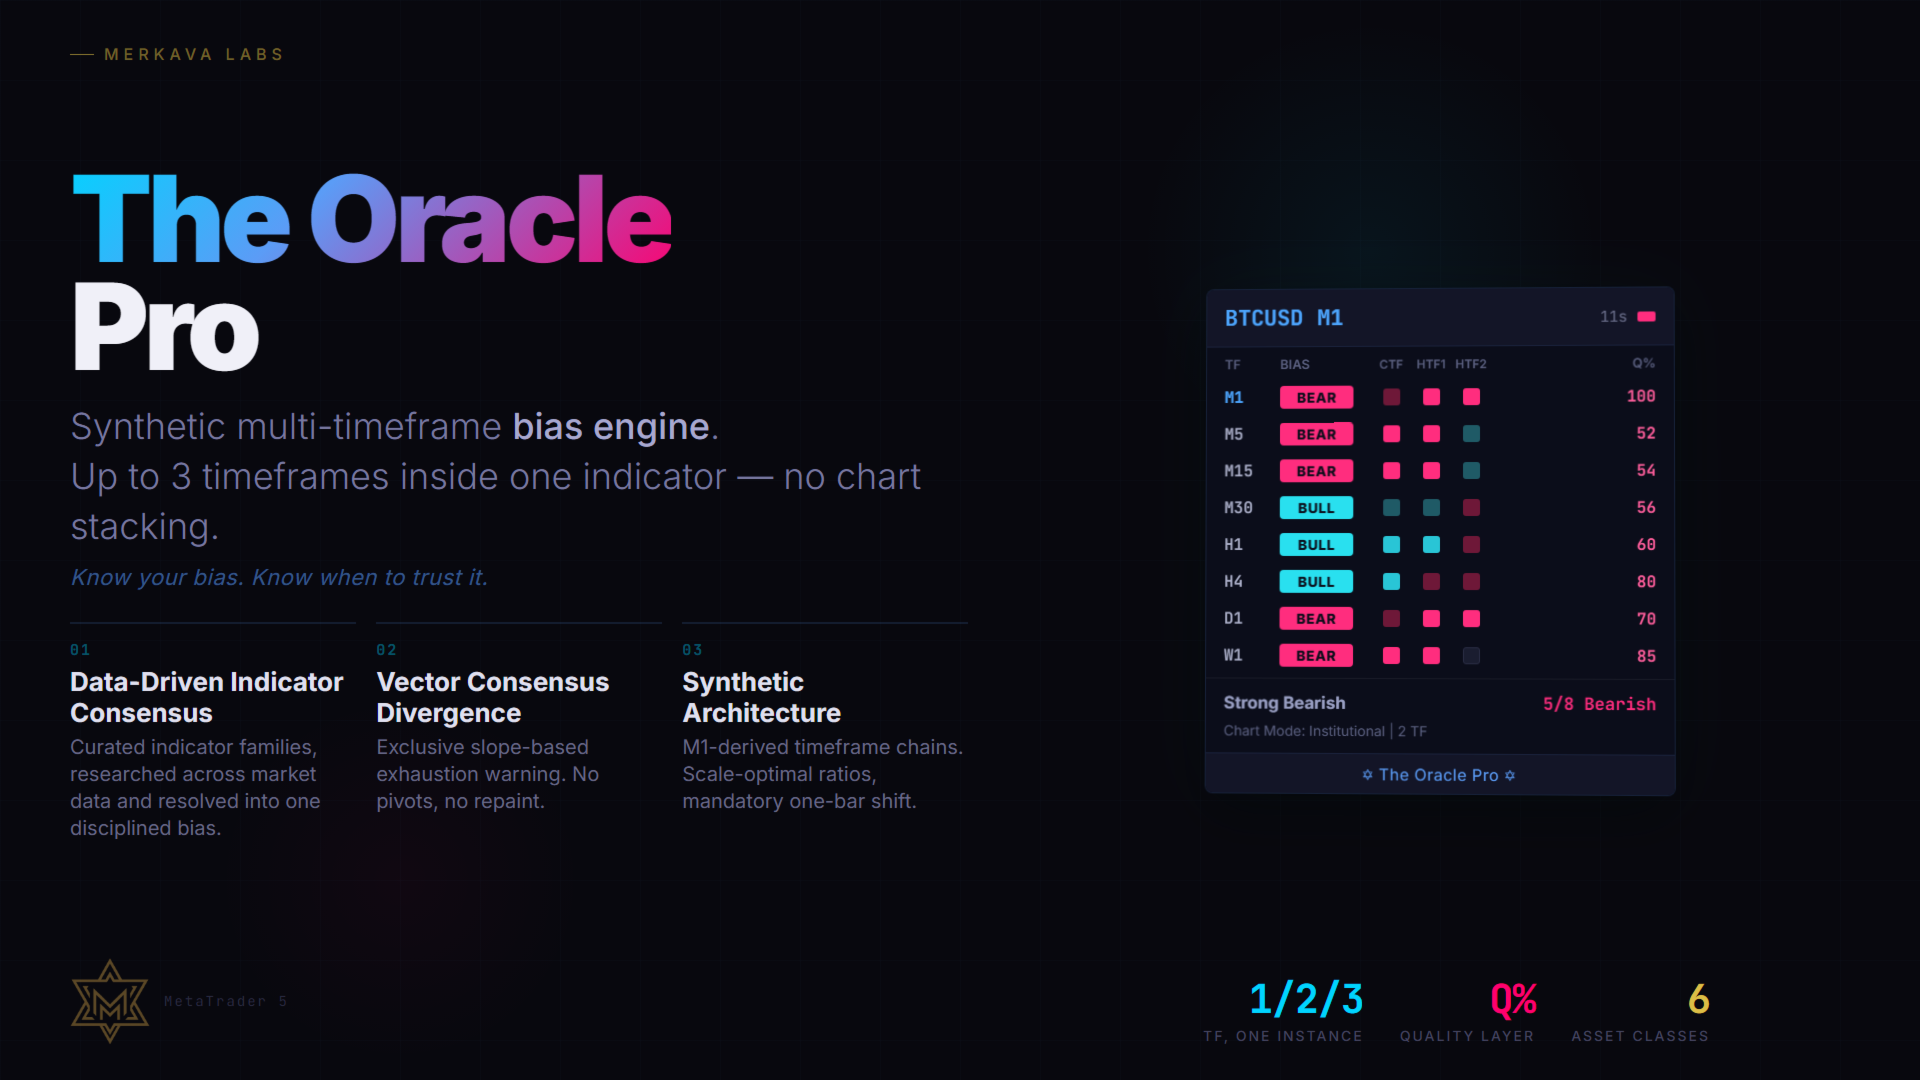
The Oracle Pro はマルチファクター・コンセンサス・システムです。独自のインジケーターと最適化されたアルゴリズムを単一の高度なコンセンサス・ベクトルに統合し、それを単一のインジケーター・インスタンス内で現在足と上位足のスタックにわたって読み取ります。複数のチャートにばらばらのツールを積み重ねる代わりに、です。

これは Oracle コンセンサス手法のプロフェッショナルな進化形です。深さ、マルチタイムフレームの文脈、ダイバージェンスの知見をひとつの規律ある作業フローに収めたいトレーダーのための、プレミアム操作コンソールとして完全に再構築されました。

シグナル発生器ではなく、バイアスエンジン

The Oracle Pro はその正体を明確にしています。規律ある方向の文脈を与えるマルチタイムフレーム・マルチファクターのバイアス・インジケーターです。シグナル発生器ではありません。エントリー、エグジット、利益を約束しません。バイアスは文脈です。あなたは自分のセットアップをその方向で取引し、コンセンサスが分裂しているか低品質のときは見送ります。正直に「今はやめておけ」と言うフィルターこそ、「今だ」と言うときに信頼できるものです。

要求の高いトレーダーのために

  • 高度なマルチファクター・コンセンサス — 方向の読み取りは、単一のオシレーターやトレンドラインではなく、複数の市場次元にまたがる非公開のマルチモデル・アーキテクチャから構築されます。
  • 1インスタンスの MTF スタック — 現在足に加えて第1・第2の上位足が1つのインジケーターで処理され、ブローカーを考慮したアンカリングにより、セッションのギャップや週末明けの再構築でも堅牢に動作します。
  • 独占的な Vector Consensus Divergence — VCD は Merkava Labs のラインナップの中で The Oracle Pro にのみ搭載されています。
  • デュアル・ステート・エンジン — あなたのスタイルに合う方向エンジンを選択:Trend State または Momentum State。
  • 操作コンソール — コンセンサス・バンド、パネル、スキャナー、品質表示、ダイバージェンス・マーカー、EA対応バッファが、ひとつのプロフェッショナルな作業フローとして設計されています。

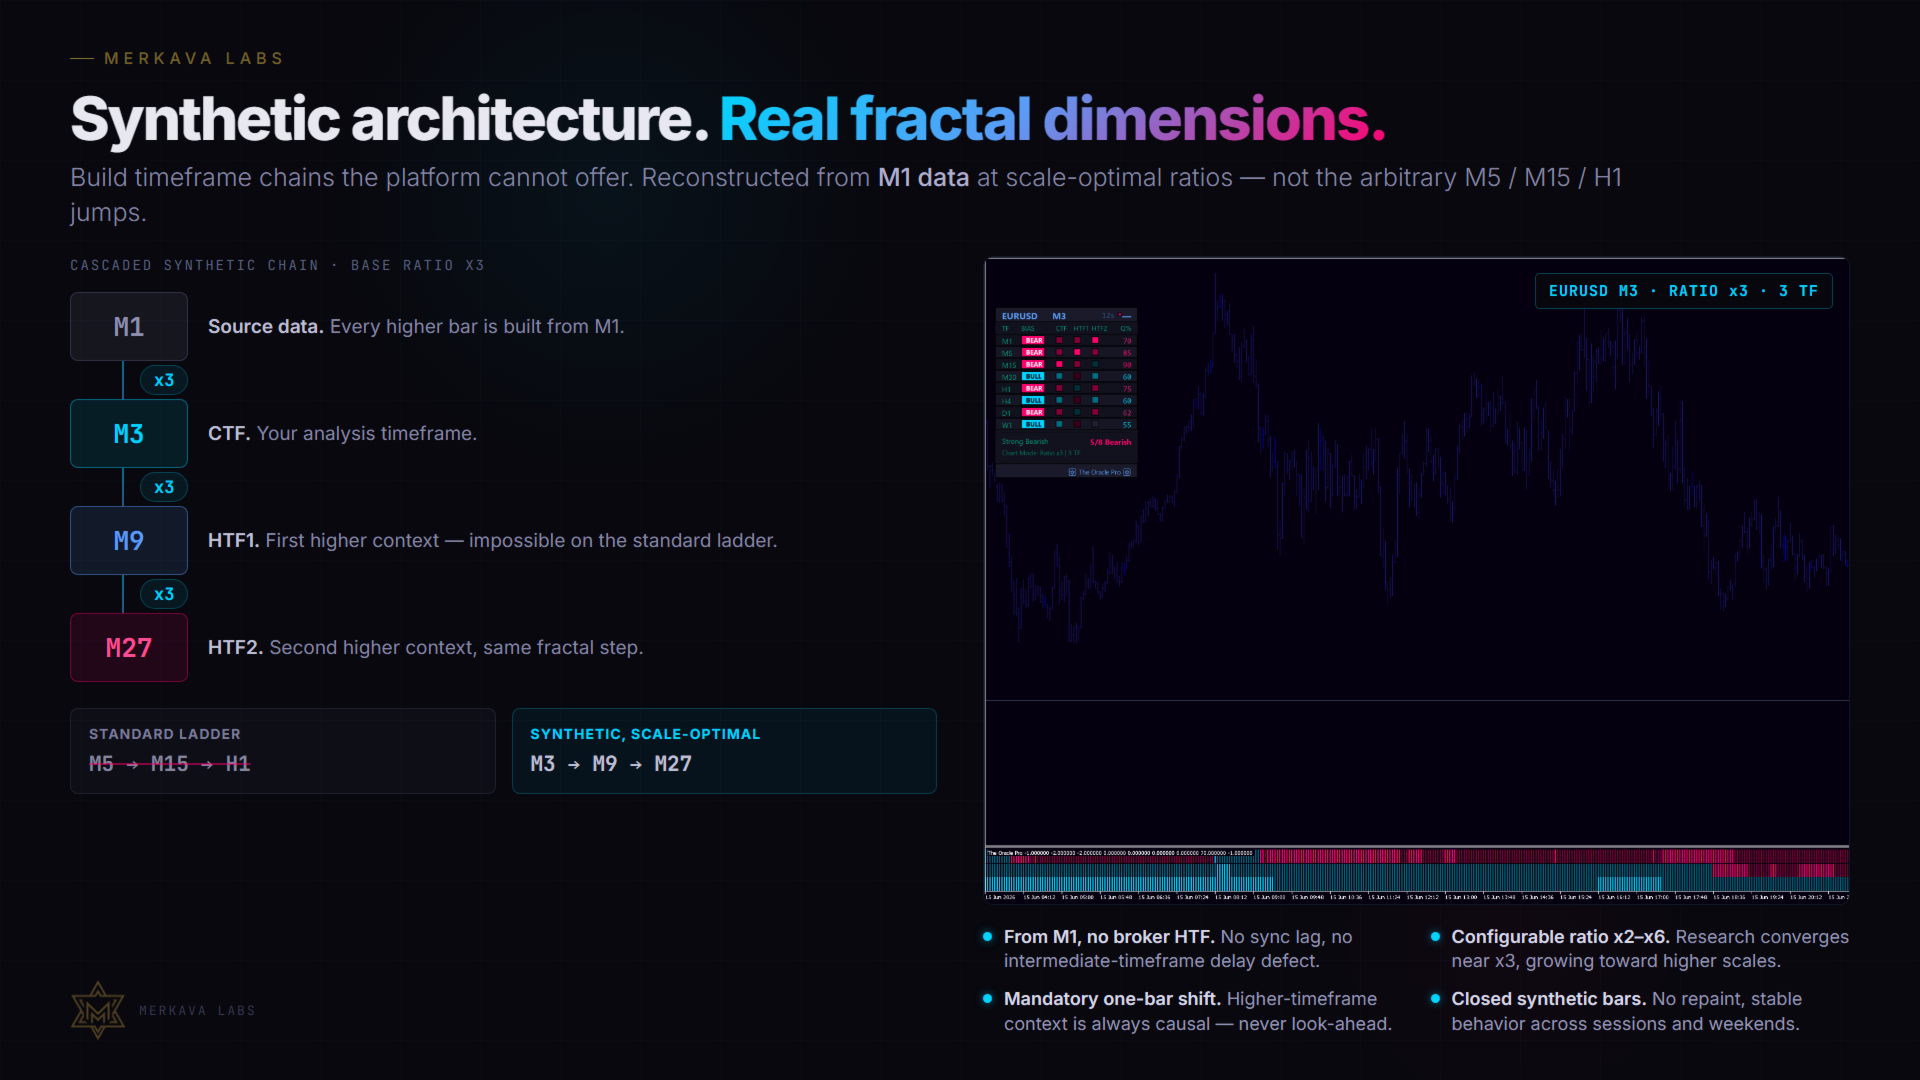
合成タイムフレーム・アーキテクチャ:本物のフラクタル次元

The Oracle Pro は、上位足を M1 データからカスケード・フィードで合成的に再構築します。これにより、脆弱なブローカーの上位足データや、文書化された中間タイムフレームの遅延欠陥への依存がなくなり、ほとんどのインジケーターにはできないことが可能になります。すなわち、標準プラットフォームの段階構成では提供されないタイムフレーム・チェーンです。

設定可能な基準比率により、本当にスケール最適なチェーンを構築できます。たとえば M3 / M9 / M27 のように、恣意的な M5 / M15 / H1 の飛びを強いられることはありません。Merkava Labs の研究は、隣接する分析スケール間の科学的に最適な分離として 3x 付近の基準比率に収束し、上位足に向かって増大することを示しています。The Oracle Pro は、価格構造のこの本物のフラクタル次元を、確定した合成足の上で直接探索させ、上位足の文脈が常に因果的で先読みにならないよう必須の1足シフトを行います。

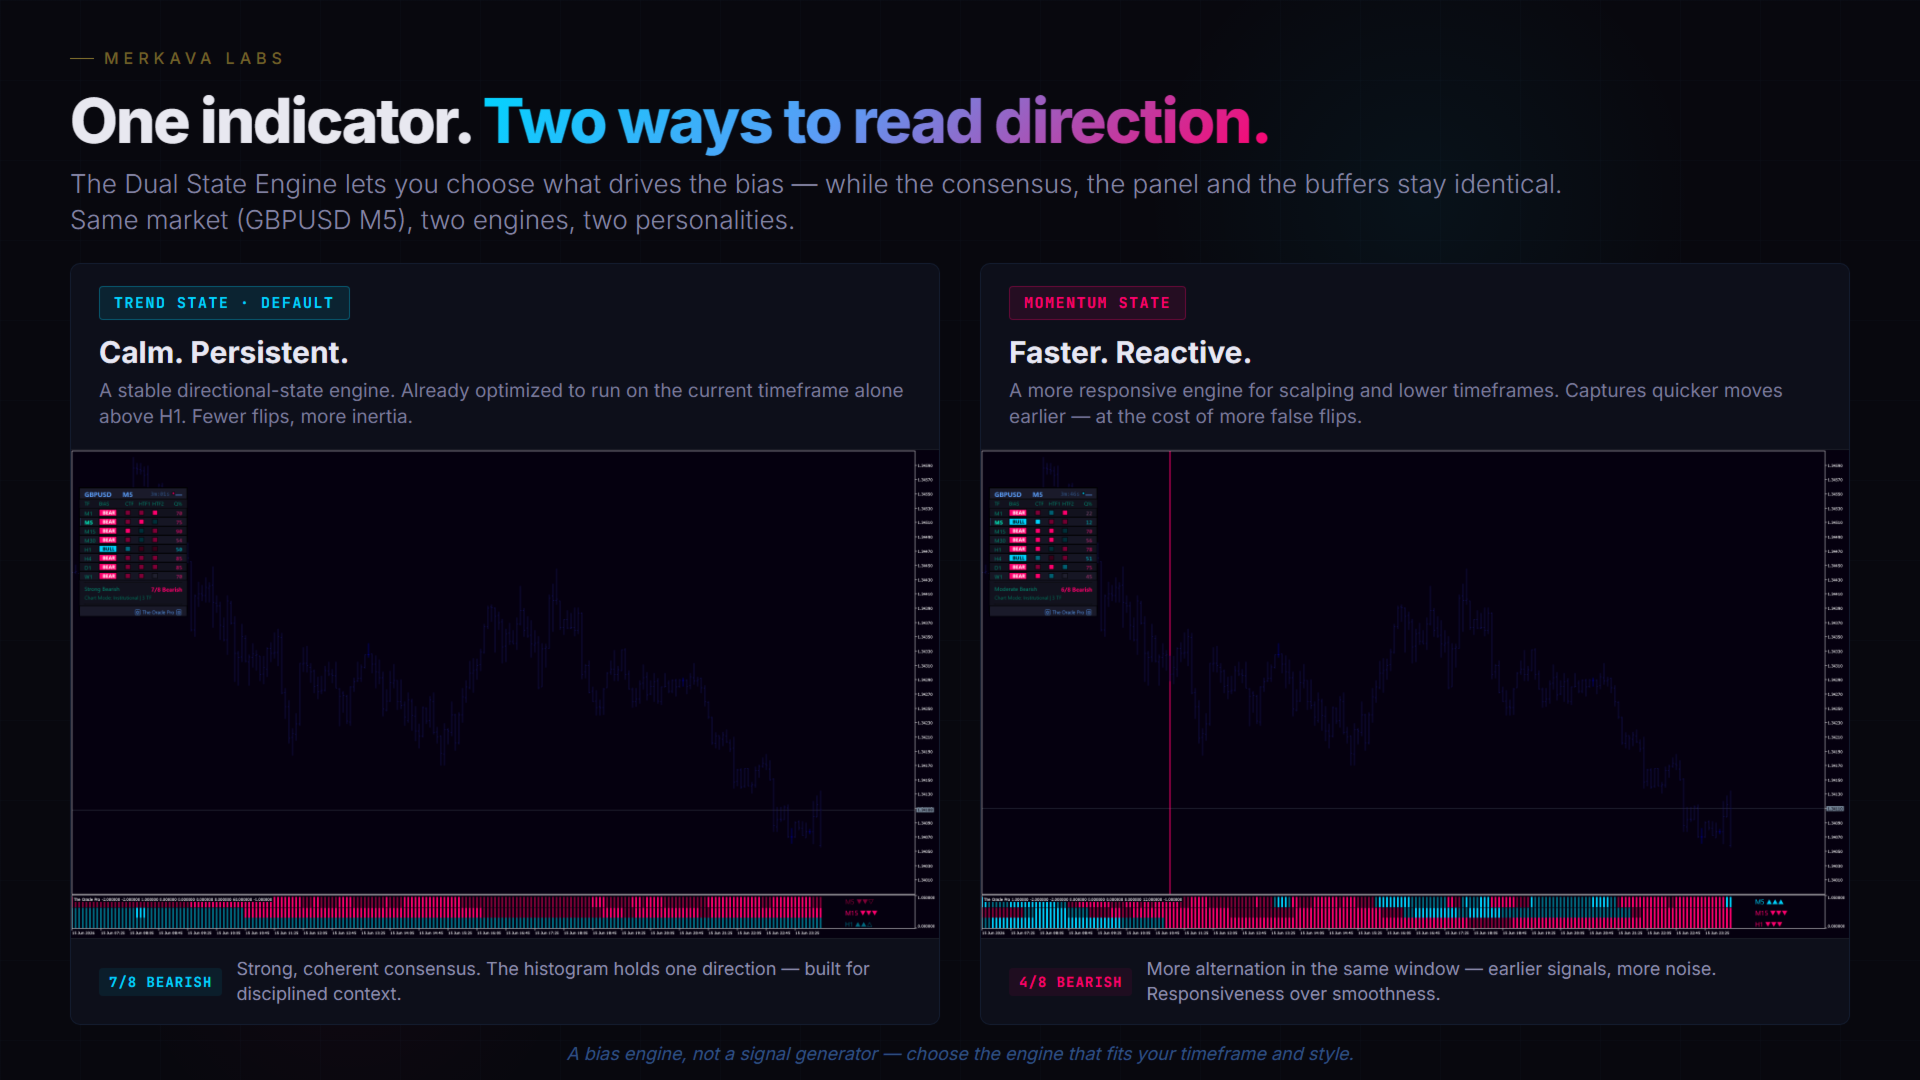
デュアル・ステート・エンジン

The Oracle Pro では、方向状態を駆動するエンジンを選択でき、コンセンサスの残りの部分、パネル、バッファは同一のままです:

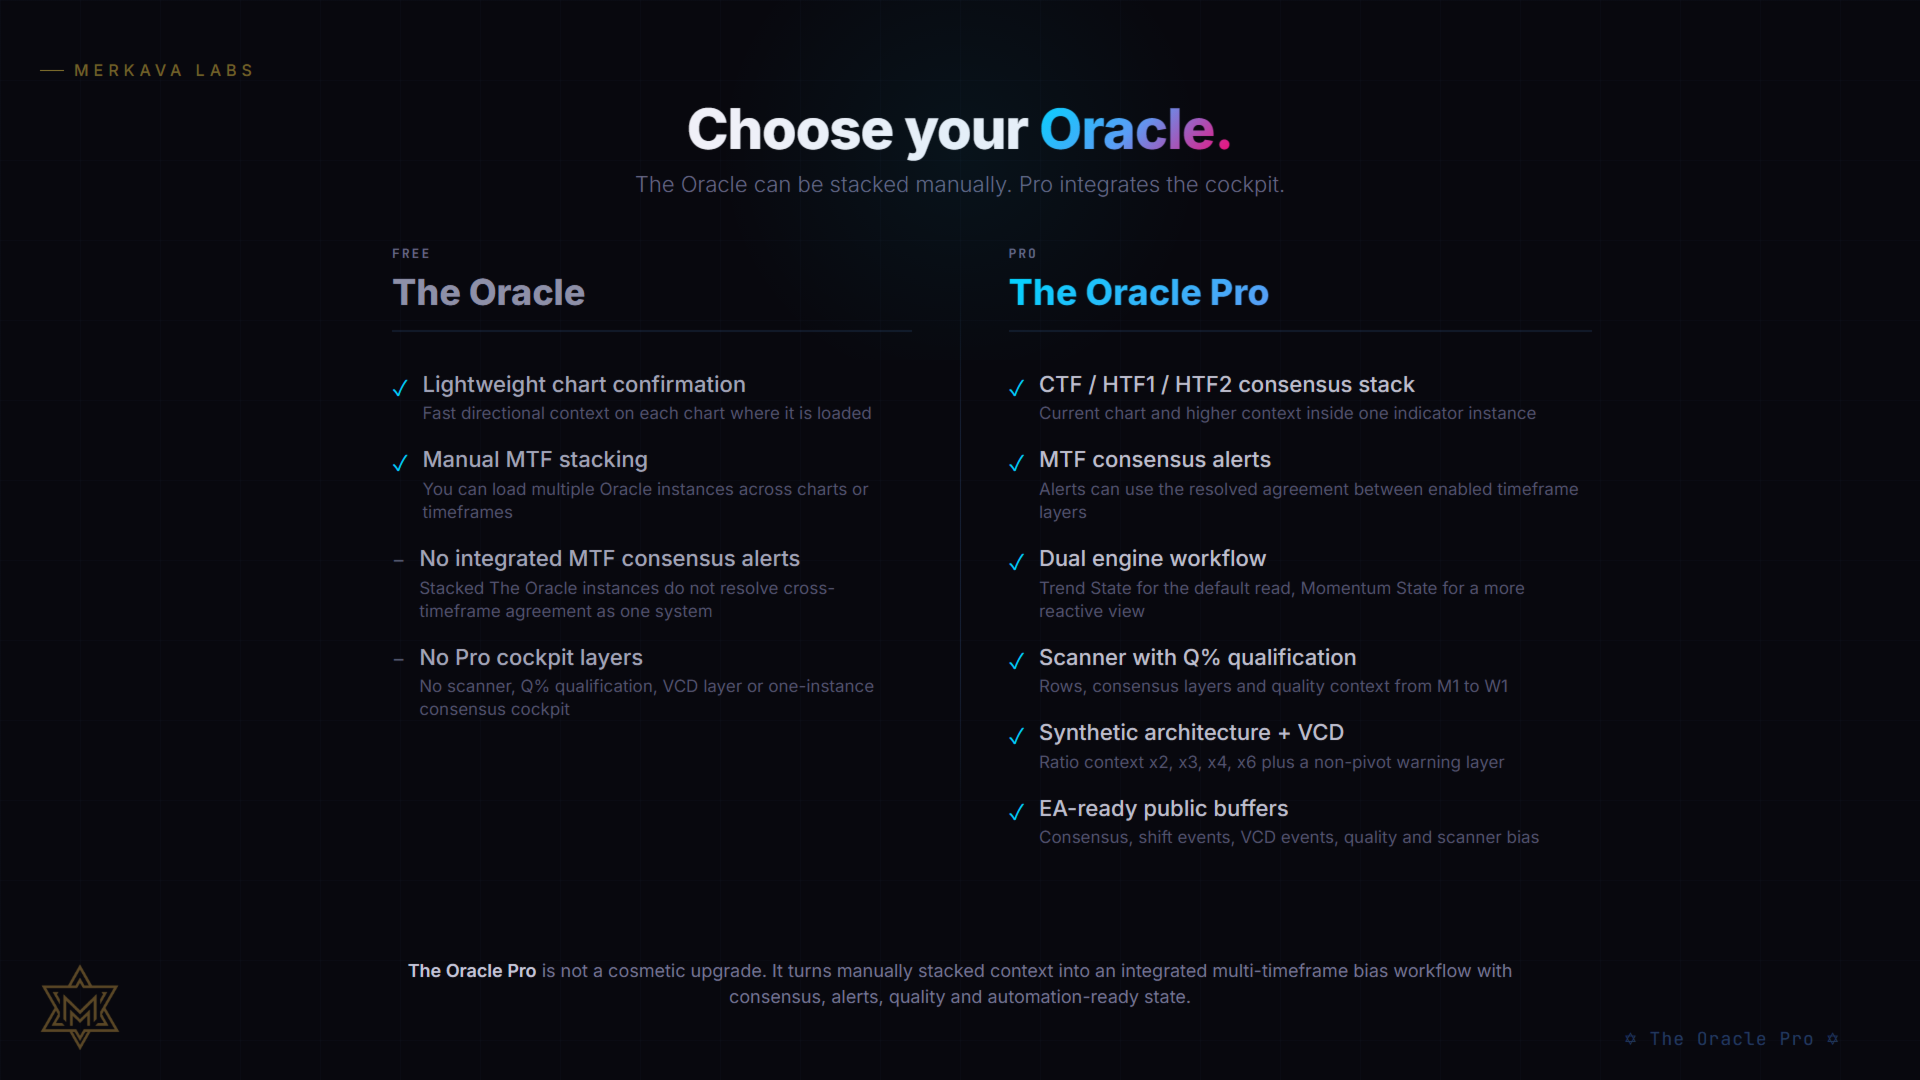
  • Trend State(既定)— 落ち着いた、持続的な方向状態エンジン。トレンドが持続しバイアスが安定する上位足(H1超)では、現在足単独で動作するようすでに最適化されています。上位足レイヤーを追加すると、構造的な確認と安全性が増しますが、バイアス変化の頻度も大幅に減少します。切り替えが減り、慣性が増します。
  • Momentum State — スキャルピングや下位足向けの、より速く反応的なエンジン。より早く速い動きを捉えますが、ダマシが増える代償があります。滑らかさよりも反応性が重要なときに使用します。

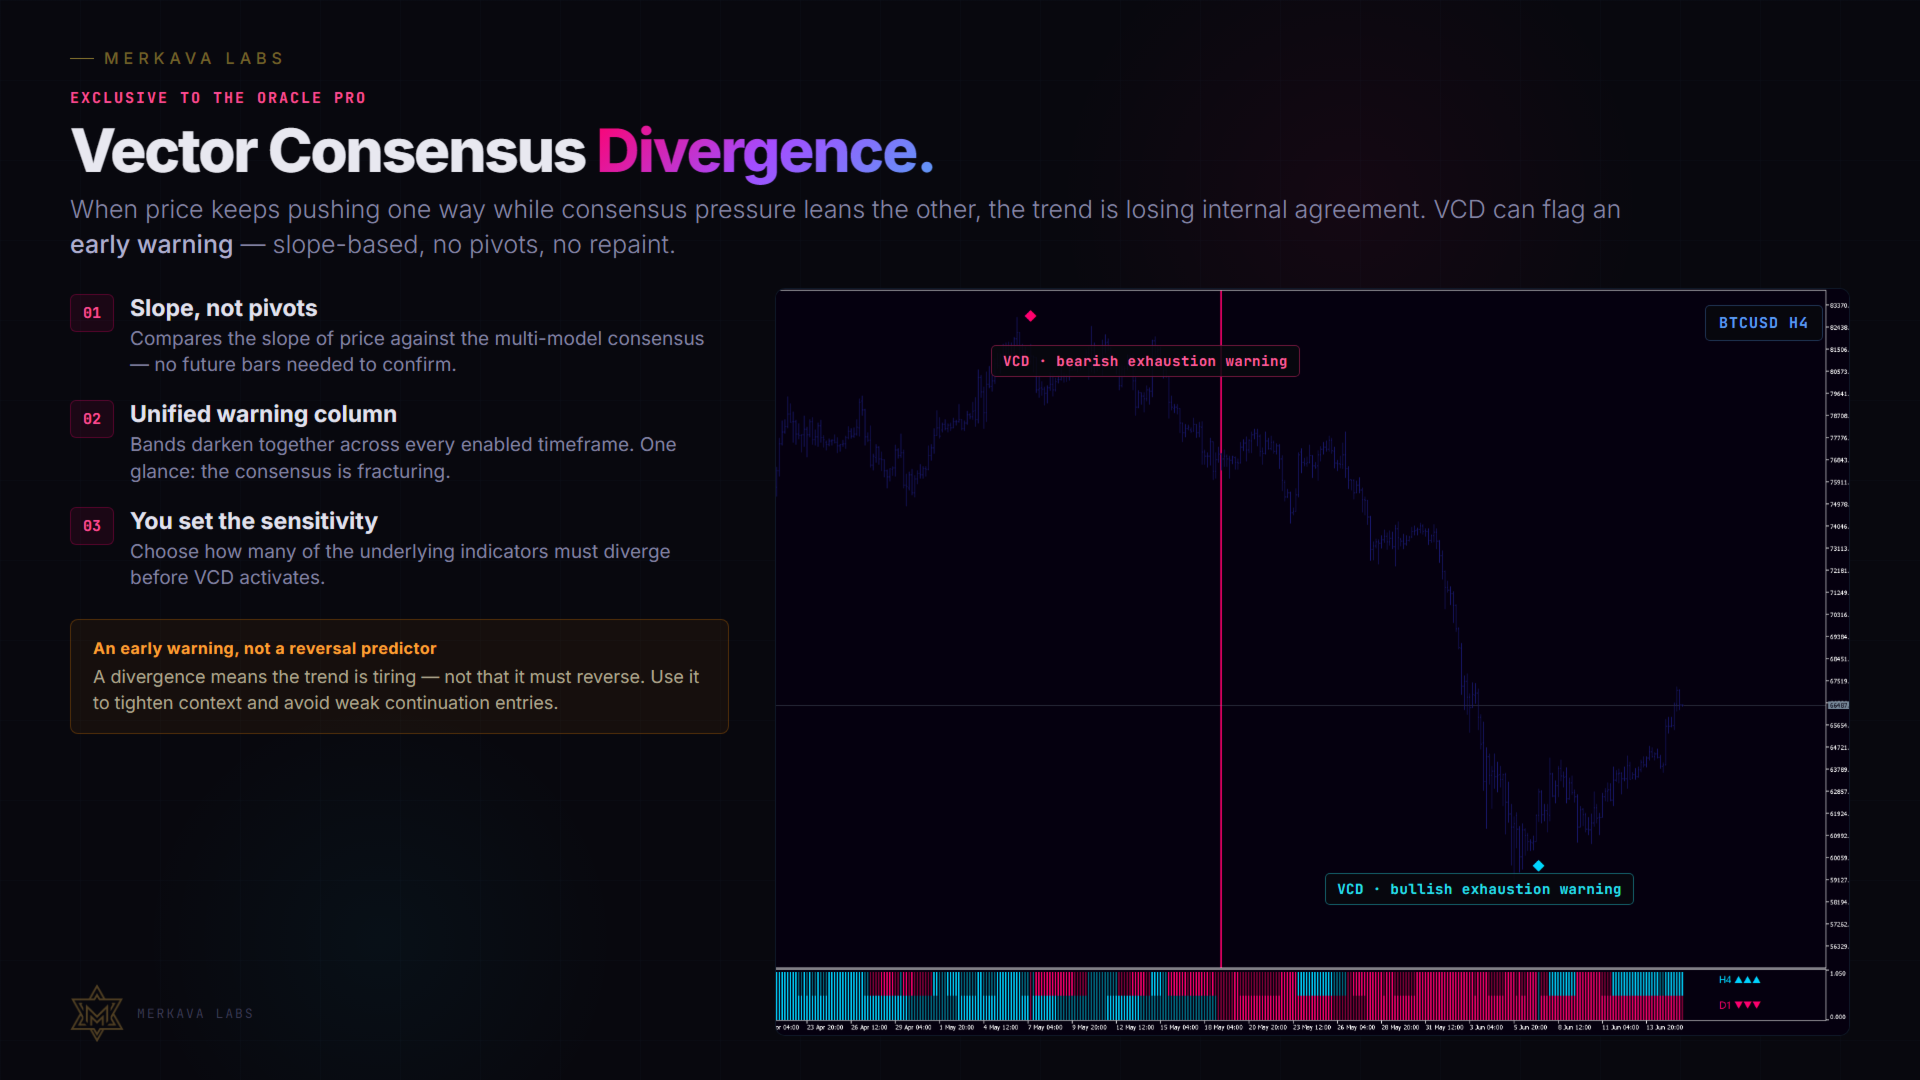
Vector Consensus Divergence

古典的なダイバージェンスはピボット点を待ちますが、それは構造上、確認のために未来の足を必要とします。VCD は異なります。有効化されたタイムフレームにわたって、価格と内部マルチモデル・コンセンサスとの傾きの関係を監視します。価格が一方向に押し続ける一方でコンセンサスの圧力が逆側に傾き始めると、The Oracle Pro はトレンド枯渇の可能性の警告を示し、ヒストグラム・スタックを単一の警告コラムへと暗転させ、任意で矢印を描画できます。

VCD は早期警告と文脈のレイヤーであり、反転の予測器ではありません。コンセンサスが分裂し始めたときに気づき、文脈を引き締め、弱い継続エントリーを避け、起こりうるレジーム転換により規律をもって備える助けとなるよう設計されています。VCD が作動する前に、基礎となるインジケーターのうち何個が乖離する必要があるかをあなたが制御します。

基本ワークフロー

  • CTF レイヤー はアクティブなチャートのタイムフレームを読み取ります。
  • HTF1 レイヤー は第1上位足のコンセンサス文脈を追加します。
  • HTF2 レイヤー は第2上位足のコンセンサス文脈を追加します。
  • コンビクション・バンド はレイヤーごとにバイアスの方向と強さ(強い/弱い)を示します。
  • コンセンサス・シフト・マーカー は、有効レイヤー全体で整合したコンセンサスが変化する箇所を強調します。
  • VCD マーカーと暗転バンド は、構造的な価格・コンセンサスの乖離を強調します。
  • 任意のスキャナー は同じロジックを複数のタイムフレーム行にまとめます。

パネル、スキャナー、品質表示

  • 右側にレイヤー・ラベルを備えた CTF / HTF1 / HTF2 の3バンド表示。
  • レイヤーごとのバイアス状態、コンビクション、0-100 の品質スコアを備えた任意のパネル。
  • 品質は、票差、バイアスの安定性、マルチタイムフレームの整合を組み合わせ、現在の文脈がどれだけ信頼できるかを素早く読み取れます。
  • 任意のマルチタイムフレーム・スキャナー・パネル。
  • 20のプロフェッショナルなカラーテーマ、任意のチャート背景、設定可能な矢印スタイルと表示密度。

タイムフレームの構造と解決

  • 構造 — 1、2、または3つのタイムフレームで運用(CTFのみ、CTF+上位1つ、または3レイヤーのフルスタック)。
  • HTF 解決 — インスティテューショナルの自動ラダー、手動の固定タイムフレーム、または合成比率プリセット(x2〜x6、既定 x3)。
  • HTF 形成足 — 形成中の上位足を任意でプレビュー。既定では確認済みの HTF 状態が優先されます。

EA と CopyBuffer のワークフロー

The Oracle Pro は安定した公開バッファを提供します:CTF / HTF1 / HTF2 のコンセンサス状態、コンセンサス・シフト・イベント、VCD イベント、品質スコア、スキャナー・バイアス。Expert Advisor やダッシュボード・ツールは、標準の MT5 CopyBuffer 呼び出しで状態を読み取ります。リペイント防止のロジックでは、常に確認済み(確定)の足を読み取ってください。

スタイル別の推奨利用法

  • スイング/ポジション — バイアスは H4-D1、確認は H1。現在足単独の Trend State は H1超ですでに強く安定した読み取りです。
  • デイトレード — M1-M15 で執行し、方向は上位足の文脈から取得します。新鮮なバイアスの方向に自分のセットアップを取引し、パネルが分裂または低品質のコンセンサスを示すときは見送ります。
  • スキャルピング — より速い反応(切り替えが増える)には Momentum State を検討し、タイトでスケール最適な HTF 文脈のために合成比率チェーンを活用します。

技術的な注意事項

  • プラットフォーム:MetaTrader 5
  • 製品タイプ:カスタム・インジケーター
  • 市場:FX、暗号資産、指数、貴金属、エネルギー、株式
  • 既定の構造:現在足(必要に応じて HTF1 / HTF2 を追加)
  • 確定足ロジック、必須の HTF 1足シフト、リペイントなし
  • ストラテジーテスター対応
  • マルチインスタンス対応
  • DLL なし

重要: The Oracle Pro はテクニカル分析と意思決定支援のためのツールです。利益を約束するものではなく、リスク管理、ポジションサイジング、トレーダー自身の判断に取って代わるものではありません。

ユーザーマニュアル: 完全版のPDFマニュアルはこちらからダウンロードできます: https://www.mql5.com/go?link=https://merkavalabs.com/docs.html

サポート: MQL5 の製品コメントおよびプライベートメッセージを通じて提供されます。製品のアップデートは購入後に含まれます。
レビュー 1
Juan March
68
Juan March 2026.07.11 10:46 
 

After several weeks of using The Oracle Pro as part of my daily trading routine, I feel I now have enough experience to give an honest opinion.

This is simply my personal experience using Oracle as part of my own trading workflow.

I mainly trade lower timeframes, especially M5, where it's very easy to become focused on what's happening on your chart and lose sight of the bigger market picture. That's where Oracle has genuinely helped me broaden the way I analyse each trade.

The biggest impact Oracle has had on my trading is the way I interpret its signals. Instead of looking at them in isolation, I now analyse them within a much broader market context. That's where I've noticed the biggest improvement in the way I approach my trading decisions.

One of the things I appreciate most is the confidence that comes from being able to verify that the idea I'm seeing on my trading timeframe is aligned with the higher-timeframe picture. It doesn't mean the trade is guaranteed to work—that's never how markets work—but it does make me feel that every decision is much better supported before I commit to it.

Before using Oracle, I tended to focus mainly on the opportunities that appeared on my trading timeframe. Now, beyond simply seeing an opportunity, I have a much clearer understanding of why it makes sense to take it—or why it's better to wait for a higher-quality setup. It may seem like a small change, but it has made me approach trading with much more confidence and discipline.

Interestingly, the biggest difference hasn't been the trades I've decided to take, but the trades I've chosen not to take after evaluating the broader market picture. In many cases, avoiding a trade has been just as valuable as finding a good one.

Over the past few weeks, Oracle and Azimuth have naturally become part of a single workflow for me. Oracle helps me understand the broader market context, while Azimuth helps me read price structure and identify trade opportunities. To me, they don't compete with each other—they complement each other because each one addresses a different part of the decision-making process.

If I could suggest one possible direction for future development, it would be the continued evolution of the Oracle + Azimuth ecosystem.

Azimuth provides a very clear view of market structure through its swing analysis. In my opinion, that information adds another valuable layer to understanding how price is developing at any given moment.

It would be very interesting to explore an optional way of incorporating that structural information as an additional layer during context validation. I believe that could further improve the synchronisation between higher-timeframe context, price structure and execution timing.

Although I notice this particularly because I do a lot of M5 scalping, I believe the idea is equally applicable to any timeframe. The relationship between context, structure and timing exists regardless of the timeframe or trading style.

I think this could become a very valuable evolution for traders who already use both tools together as part of the same analytical workflow.

Another aspect I've really appreciated is the support. Whenever I've had a question or needed clarification, the team has always been approachable, willing to help, and happy to explain things in detail. You never get the feeling that you're left on your own after purchasing the product. That level of support gives you confidence, especially when you're investing time learning a professional trading tool. On top of that, it's clear that they genuinely listen to user feedback and are committed to continuously improving the ecosystem, which, in my opinion, adds significant value beyond the products themselves.

Overall, my experience with Oracle has been genuinely positive. Oracle hasn't changed the way I find trading opportunities; it has changed the way I decide whether those opportunities are worth taking. Now I spend much more time validating whether a trade idea truly makes sense before entering the market. That has made me far more selective and, above all, has given me greater confidence that the decisions I make are built on a much stronger foundation.

Looking back, that's probably been the biggest improvement in my trading since I started using Oracle.

おすすめのプロダクト
GDS Renko Entry Helper - Free Renko Price Interaction Indicator for MetaTrader 5 GDS Renko Entry Helper is a free Renko price interaction indicator for MetaTrader 5. It helps traders highlight important areas where price reacts, slows down, returns to a zone or changes behavior around support and resistance. The tool is designed for manual Renko analysis. It does not generate buy or sell signals and does not tell the trader when to enter the market. Its purpose is to help focus attention on area
インディケータは現在のクオートを作成し、これを過去のものと比較して、これに基づいて価格変動予測を行います。インジケータには、目的の日付にすばやく移動するためのテキスト フィールドがあります。 オプション: シンボル - インジケーターが表示するシンボルの選択; SymbolPeriod - 指標がデータを取る期間の選択; IndicatorColor - インジケータの色; HorisontalShift - 指定されたバー数だけインディケータによって描画されたクオートのシフト; Inverse - true は引用符を逆にします。false - 元のビュー。 ChartVerticalShiftStep - チャートを垂直方向にシフトします (キーボードの上下矢印)。 次は日付を入力できるテキストフィールドの設定で、「Enter」を押すとすぐにジャンプできます。
Elite Harmony Signals Pro Panoramica Elite Harmony Signals è un indicatore sofisticato di analisi tecnica che visualizza rettangoli dinamici che forniscono zone di trading chiare e segnali di conferma per decisioni migliorate. Caratteristiche Principali Zone Rettangolo Dinamiche Estensione in Tempo Reale : I rettangoli si estendono automaticamente all'azione corrente del prezzo Chiusura Intelligente : I rettangoli si chiudono solo quando appaiono segnali opposti Conferma Visiva : Zone di trading
PatternScope — Multi-Pattern Recognition for MT5 PatternScope is a multi-pattern recognition indicator for MetaTrader 5. It scans price action for classic chart patterns, confirms breakouts, and draws clear   Entry, Stop Loss and Take Profit   levels. A compact dashboard shows the latest pattern, bias and Risk:Reward. Patterns:   Double Top/Bottom, Triple Top/Bottom, Head and Shoulders (and inverted), Bullish & Bearish Flag, Pennant, Rising & Falling Wedge, Triangle, Rectangle, Cup and Handle —
PipFinite Exit EDGE MT5
Karlo Wilson Vendiola
4.88 (32)
Did You Have A Profitable Trade But Suddenly Reversed? In a solid strategy, exiting a trade is equally important as entering. Exit EDGE helps maximize your current trade profit and avoid turning winning trades to losers. Never Miss An Exit Signal Again Monitor all pairs and timeframes in just 1 chart www.mql5.com/en/blogs/post/726558 How To Trade You can close your open trades as soon as you receive a signal Close your Buy orders if you receive an Exit Buy Signal. Close your Sell orders if
RBreaker Gold Indicatorsは、金先物の短期日内取引戦略であり、トレンドフォローと日内反転の2つの取引手法を組み合わせたものです。トレンド相場での利益を捉えるだけでなく、相場が反転した際には迅速に利確し、その流れに沿ってポジションを反転させることができます。 この戦略は、アメリカの雑誌『Futures Truth』において、15年連続で最も収益性の高い取引戦略トップ10に選ばれた実績を持ち、非常に長いライフサイクルを誇り、現在も国内外で広く使用・研究されています。 本インディケーターは、2026年の金先物の値動きに対応し、14日間のATR指標に基づいて、ブレイクアウト係数A、観察係数B、リバーサル係数Rをより合理的な値で定義しています。非常に優れたインディケーターであり、安定的な年間収益を実現しています。ぜひおすすめします〜
Mahra Pro Indicator MT5 Overview Mahra Pro is a MetaTrader 5 chart indicator designed to support structured analysis of XAUUSD (Gold). It combines trend, momentum, volatility and price-structure conditions to identify potential buy and sell setups and display them directly on the chart. The indicator does not open, modify or close trades. All trading decisions and order execution remain under the user's control. Main features • Buy and sell signal arrows on the chart. • Fast and slow EMA lines w
GDS Renko Pip ST Chart - Pip-Based Renko Chart Indicator for MetaTrader 5 GDS Renko Pip ST Chart is a pip-based Renko chart indicator for MetaTrader 5. It helps traders build and study cleaner Renko price movement using a practical fixed pip or point-based brick structure. This tool is designed as a Renko chart foundation for manual analysis. It does not predict the market, does not generate buy or sell signals and does not decide whether a trade should be opened. Renko EDGE EA Golden Delta | A
Our BOOM SELL ALERT indicator is specifically engineered to   take candles on BOOM 1000 , BOOM 500 is tool is optimized for M1 (1-minute) timeframe, ensuring you receive timely and actionable insights.   The indicator is a combination of   many indicators. -        AO Oscillator -        Stochastic   HOW TO USE THIS INDICATOR To use well this indicator , it   need to use SCHAFF TREND RSX ( 5 MIN OR M5) IF SCHAFF trend RSX is GREEN and you have a signal then SELL when you have ENTRY and out with
GoldPro Max
Taher Ahmed Mohamed Taha Elshafei
GOLDPRO MAX Advanced Multi-Timeframe and Smart Money Market Analysis for MetaTrader 5 GoldPro Max is a professional market analysis indicator for MetaTrader 5 designed to help traders study market direction, price structure, liquidity, market imbalance and potential trading areas from multiple perspectives. The indicator combines Multi-Timeframe Analysis, Smart Money Concepts, Market Structure, Liquidity Analysis, Order Blocks, Fair Value Gaps, Premium and Discount analysis, Smart Analytical Eng
Was: $249  Now: $99   Market Profile defines a number of day types that can help the trader to determine market behaviour. A key feature is the Value Area, representing the range of price action where 70% of trading took place. Understanding the Value Area can give traders valuable insight into market direction and establish the higher odds trade. It is an excellent addition to any system you may be using. Inspired by Jim Dalton’s book “Mind Over Markets”, this indicator is designed to suit the
Trend and Signals MT5  indicator scans  30 trading Instruments (Forex, Metals and Indices).     It uses special algorithm on the  current market   based on   Pure Price Action   and display the overall trend and signal on the dashboard. When signals are produced the indicator sends alert and notification. Strategy for Signals This indicator uses the daily timeframe to determine the direction of the trend. The hourly timeframe is used to identify possible entries. Main trend and is determined by
CosmiCLab SMC FIBO CosmiCLab SMC FIBO is a professional trading indicator designed for traders who use Smart Money Concepts (SMC), market structure analysis and Fibonacci retracement levels. The indicator automatically detects market swings and builds Fibonacci levels based on the latest impulse movement. It also identifies market structure changes such as BOS (Break of Structure) and CHOCH (Change of Character), helping traders understand the current market direction. CosmiCLab SMC FIBO also pr
Enhanced Elliott Wave Pro – Advanced Market Structure & Wave Analysis   Enhanced Elliott Wave Pro is a lightweight, institutional-grade MT5 indicator that eliminates chart clutter by detecting and displaying only the current, active market structure: the 1-2-3-4-5 Impulse wave and the subsequent A-B-C Correction.   Built with classic Prechter wave rules and ATR-adaptive pivot detection, it delivers clean, real-time wave counts without bogging down your terminal.   ――――――――――――――――――――――――――――
Japanese このインジケーターは、チャートパターンでのトレードを好むトレーダーにとって、高度なチャート分析アシスタントとして機能します。目視での分析負担を軽減し、利益を上げるための精度を高めるように設計されています。 実際の使用においての、このインジケーターの主な利点と特徴は以下の通りです: 1. 自動パターン検出 (Automated Pattern Detection) 時間の節約とバイアスの軽減: 手動でトレンドラインを引く必要はありません。価格のスイングポイント(Pivot High/Low)を検索し、価格構造が条件を満たすと、ライジングウェッジ(上昇楔形)とフォーリングウェッジ(下降楔形)を自動的に描画します。 あらゆる状況を網羅: パターン形成中、ブレイクアウト、さらにはパターン失敗(Failed)まで検出でき、市場の全体像を明確に把握できます。 2. ターゲットとフィボナッチTPの内蔵 (Built-in Targets & Fibonacci TP) ターゲットを自動計算: ブレイクアウトが発生すると、システムはウェッジの開き幅に基づいてメインターゲットの距離を即
Price Magnet — Price Density and Attraction Levels Indicator Price Magnet is a professional analytical tool designed to identify key support and resistance levels based on statistical Price Density. The indicator analyzes a specified historical period and detects price levels where the market spent the most time. These zones act as “magnets,” attracting price action or forming a structural base for potential reversals. Unlike traditional Volume Profile tools, Price Magnet focuses on price-time d
IVISTscalp5
Vadym Zhukovskyi
5 (6)
[iVISTscalp5]:時間を通じた市場行動研究ラボ TLV Framework | Liquidity Activation Points ⸻ 概要 iVISTscalp5 は、VISTmany プロジェクトの一環として開発された、多層型のタイミングおよび価格構造インジケーターです。 このシステムは、Liquidity Activation Points(タイミング)を通じて、 動きが発生する時間 方向性 値動きの範囲 を予測します。 iVISTscalp5 インジケーターは、デフォルト設定のまま、あらゆる金融商品に使用できます。 ⸻ 実践的価値 iVISTscalp5 は、一般的なテクニカル指標として開発されたものではありません。 開発の中心的な理念は次の通りです。 あらゆる人が「時間」を通じて市場行動を研究できるようにすること。 ⸻ Time Language VISTmany (TLV) — プロジェクトの主要概念 t(p) t(p) は、タイミングが活性化する価格レベルです。 ⸻ p(p) p(p) は
概要 ATRマルチレベルおよび移動平均バンドインジケーターは、トレーダーが市場のトレンド、サポートおよびレジスタンスレベル、ボラティリティを特定するのを支援する強力なツールです。このインジケーターは、価格変動の周りにビジュアルバンドを作成するために、複数の移動平均とATR(平均真の範囲)乗数を組み合わせています。これにより、トレーダーは潜在的な反転ポイント、トレンド条件、および市場の統合ゾーンを検出するのに役立ちます。 特徴 複数バンドの視覚化: トレンドを簡単に識別するために、赤、オレンジ、黄色、緑、青、紫などの異なる色で、6つの動的バンドを表示します。 ATRボラティリティバンド: 市場のボラティリティに基づいてバンドのグラフを調整し、反転または価格の継続の可能性について明確な視覚的信号を提供します。 カスタマイズ可能なパラメーター: ATR乗数と移動平均の期間を調整可能で、市場の異なる条件やトレーディング戦略に適応します。 トレンドの明確な識別: バンドはボラティリティに応じて拡張および収縮し、トレーダーがトレンド、統合期間、および潜在的なブレイクポイントを簡単に視認できます。
FREE
プレミアムレベルは、正しい予測の精度が80%を超える独自の指標です。 この指標は、最高のトレーディングスペシャリストによって2か月以上テストされています。 あなたが他のどこにも見つけられない作者の指標! スクリーンショットから、このツールの正確さを自分で確認できます。 1は、1キャンドルの有効期限を持つバイナリーオプションの取引に最適です。 2はすべての通貨ペア、株式、商品、暗号通貨で機能します 手順: 赤い矢印が表示されたらすぐにダウントレードを開き、青い矢印が表示されたら閉じます。青い矢印の後に開くこともできます。 試してテストしてください!推奨設定はデフォルトです! 日足チャートで最高の精度を示します! インディケータは、2600 Pipsの収益性に対して、約10Pipsという非常に小さなマージンを使用します。
https://youtu.be/JJanqcNzLGM ,  https://youtu.be/l70MIHaQQa4 ,  https://youtu.be/pg0oiT5_8y0   Automated Supply and Demand Trading Edge MT5. These videos demonstrate how we apply the supply and demand system to our latest trading review and market analysis Enhance your Trading Strategy with the Supply and Demand Trading Edge MT5. Gain a competitive market advantage with the Supply and Demand Trading Edge MT5 indicator, a powerful tool that combines MACD signals with supply and demand zones. By
Ing (inguz,ingwar) - the 23rd rune of the elder Futhark ᛝ, Unicode+16DD. Add some runic magic to your trading strategies. The correct marking of the daily chart will indicate to you the successful moments for counter-trend trading. Simple to use, has high efficiency in volatile areas. Be careful in lateral movements. Signals ᛝ are generated when the main lines of construction intersect. Red arrow down - recommended sales Blue up arrow - recommended purchases rare purple arrows indicate exce
通貨強さウィザードは、取引を成功させるためのオールインワン ソリューションを提供する非常に強力な指標です。このインジケーターは、複数の時間枠のすべての通貨のデータを使用して、このまたはその外国為替ペアのパワーを計算します。このデータは、使いやすい通貨インデックスと通貨パワーラインの形式で表され、特定の通貨のパワーを確認するために使用できます。 必要なのは、取引したいチャートにインジケーターを接続することだけです。インジケーターは、取引する通貨の実際の強さを示します。このインジケーターは、トレンドに合わせて取引するときに有利に利用できる売買高の圧力の極値も示します。このインジケーターには、フィボナッチに基づく可能なターゲットも表示されます。 このインジケーターは、PUSH 通知を含むあらゆるタイプのアラートを提供します。 購入後ご連絡下さい。私の取引のヒントをあなたと共有し、素晴らしいボーナスインジケーターを無料で提供します! 幸せで有益な取引をお祈りします。

NeuralTickによるCleanTrend — 過去を決して書き換えないトレンド指標。履歴上は美しいのに、ライブトレードではシグナルを書き換えてしまう指標にうんざりしていませんか? ノイズと欺瞞にうんざりしているトレーダーがCleanTrendを選ぶ3つの理由: 100%再描画なし。 ラインの色は永久に固定されます。過去のバーが後から変わることは一切ありません — ストラテジーテスターでご確認ください。 デュアルノイズフィルター。 価格が設定したしきい値(MinMove)を超えかつ複数のバーにわたって方向を維持した(ConfirmBars)場合にのみシグナルが出現します。レンジ相場での「ノコギリ刃」とはおさらばです。 状況を逃さないアラートシステム。 ポップアップウィンドウ、サウンド、ジャーナル記録、スマートフォンへのプッシュ通知(MetaTrader 5アプリ)。ターミナルが閉じていても、トレンド変化を即座に把握できます。 CleanTrendはチャートをパネルで埋め尽くしません — シンプルなカラーラインのみ:青(買い) または 赤(売り)。エントリー価
Structure King AI Signal Structure King AI Signal is a professional MetaTrader 5 trading indicator designed to help traders analyze market structure, trend direction, multi-timeframe confirmation and trade management from one clean dashboard. Key Features • Market Structure & Trend Analysis • BUY / SELL Signals • Multi-Timeframe (HTF) Confirmation • Entry Price Levels • Dynamic Stop Loss (SL) • TP1 / TP2 / TP3 Levels • ATR Volatility Analysis • ADX Trend Strength Filter • Adaptive Market Filter
Introducing "X Marks the Spot" – Your Ultimate MetaTrader 5 Indicator for Perfect Trades! Are you tired of the guesswork in trading? Ready to take your MetaTrader 5 experience to a whole new level? Look no further – "X Marks the Spot" is here to revolutionize your trading strategy! What is "X Marks the Spot"? "X Marks the Spot" is not just another indicator – it's your personal trading compass that works seamlessly on all timeframes . Whether you're a beginner or an experienced trader,
SmartScalp Scannerは、MetaTrader 5 (MT5) 専用に開発された、強力かつリアルタイムなマルチフィルター・スキャルピング・インジケーターです。最先端のAI分析と独自の取引戦略を融合させた高度なアルゴリズムを搭載しています。トレンド分析(EMA)、モメンタム・オシレーター(RSI)、高度なローソク足パターン認識を組み合わせることで、高精度かつ高確率なスキャルピング・シグナルを生成します。 有料版をご購入いただく前に、デモ版をお試しいただけます! 主要なFX通貨ペア、金(XAUUSD)、仮想通貨など、どのような市場でも、SmartScalp Scannerは市場のノイズを排除し、質の高いセットアップ(取引機会)に集中できるようサポートします。 === 主な機能 === • 多層的なシグナル・フィルタリング:トレンド、モメンタム、ローソク足の形状を総合的に評価してからシグナルを発生させ、精度の高さを確保します。 • 動的なフローティング・パネル:現在のローソク足の残り時間、価格変動(pips)、トレンド状態、RSIレベルをチャート上に直接表示します。 • 精密
Moving Average Multicurrency Scanner MT5を紹介します。これは、さまざまな時間枠で複数の通貨ペアを監視することで、あなたのトレーディング体験を向上させるために設計された最先端のインジケーターです。このツールは、トレンドを特定し、情報に基づいたトレーディング決定を行うために移動平均に依存するトレーダーに最適です。 Moving Average Multicurrency Scanner MT5を使用すると、市場の動きを簡単に分析し、タイムリーなシグナルを受け取ることができ、リアルタイムでトレーディングの機会を活用できます。複数の時間枠と通貨ペアをシームレスに調整して、トレーディング戦略をカスタマイズする能力を想像してみてください。 MQL製品のインストールガイド | MT4/MT5で購入したMQL製品の更新 | 一般的なトラブルシューティングガイド | インジケーター設定 / ガイド 主な機能 バッファ統合: インジケーターの値をアクセス可能なバッファとして公開し、Expert Advisorがシグナルベースのトレーディング戦略を利用できるようにしま
SAIKO – Smart Buy & Sell Indicator SAIKO is an advanced intelligent trading indicator engineered with exceptional precision and designed to simplify professional market analysis. Built upon a sophisticated multi-layered trading system, SAIKO combines several powerful analytical methods into one seamless solution. Instead of relying on a single indicator, SAIKO continuously analyzes and combines data from multiple technical indicators, moving averages, market momentum, trend strength, liquidity b
7FIGURES TREND — MT5 Trend & Signal Indicator See the trend. Read the market. Trade with greater clarity. 7FIGURES TREND is a professional MetaTrader 5 trend and signal indicator designed for traders who want a cleaner and simpler view of market direction without filling their charts with unnecessary technical information. The indicator performs its analysis in the background and presents the trader with clear information directly on the chart. WHAT 7FIGURES TREND SHOWS The system identifies the
Enigmera MT5
Ivan Stefanov
3.67 (3)
Enigmera は MetaTrader 5 用の手動インジケーターおよびトレーディングシステムです。フラクタルサイクルを用いてサポートとレジスタンスの水準を計算し、蓄積局面を示し、現在の値動きの方向とターゲットを描画します。この分析はトレンド局面でも調整局面でも利用できます。 本インジケーターはチャート上のボタンで手動操作します。MetaTrader のストラテジーテスターのビジュアルモードで起動し、購入前に過去データ上の動作を確認できます。ボタンで操作する一部の機能は、テスターではライブチャートと同じように動作しない場合があります。 動作の仕組み 銘柄のフラクタルサイクルから、現在のトレンドのサポートライン、その周囲の許容偏差チャネル、3 つの偏差レベル、ターゲットラインを導き出します。サポートラインは相場の状態を示し、価格がその上を維持している間はトレンドが継続し、ラインを割るとトレンドの転換を意味します。いったん描画されたラインは再描画されません。 大半の機能はチャート左側のボタンで操作するため、相場環境の変化に合わせて表示をすばやく調整できます。 ボタン ON/OFF:イン
このプロダクトを購入した人は以下も購入しています
Neuro Poseidon is a new indicator by Daria Rezueva. It combines precise trading signals with adaptive TP/SL levels - creating best possible trades as a result! Message me and get  Neuro Poseidon Assistant  as a gift to automize your trading process! What makes it stand out? 1. Proven profitability on all assets and timeframes 2. Only confirmed BUY and SELL signals present on the chart 3. Adaptive TP & SL levels generated by the software for each trade 4. Easy to understand - suitable for al
UZFX {SSS} スキャルピング・スマートシグナル v5.0 MT5は、変動の激しい市場において正確かつリアルタイムのシグナルを求めるスキャルパー、デイトレーダー、スイングトレーダー向けに設計された、リペイントのない高性能な取引インジケーターです。(UZFX-LABS)によって開発されたこのインジケーターは、価格行動分析、トレンド確認、スマートフィルタリングを組み合わせることで、すべての通貨ペアおよび時間枠において、高確率の売買シグナル、警告シグナル、トレンド継続の機会を生成します。 トレードの判断に迷うのはもうやめましょう。明確さ、正確さ、そして規律ある市場執行を求めるトレーダーのために設計された、体系的なシグナルシステムに従い始めましょう。 間違いなく、MQL5で入手可能な最高のインジケーターの一つです。絶対に見逃さないでください!!「スマートなトレーダーのためのスマートシグナル」 最新バージョン5.0がリリースされました。価格は予告なく最大499.99ドルまで値上がりする可能性がありますので、チャンスを逃さないようお早めにお求めください!! 購入を決める前に!無料トライアル
Azimuth Pro
Ottaviano De Cicco
5 (7)
Azimuth Pro V2:MT5向けシンセティック・フラクタル構造分析と確認済みエントリー 概要 Azimuth Pro は Merkava Labs によるマルチレベルスイング構造インジケーターです。4つのネストされたスイングレイヤー、スイングアンカーVWAP、ABCパターン検出、3タイムフレーム構造フィルタリング、そして確定バーでの確認済みエントリー — 1つのチャートで、ミクロスイングからマクロサイクルまでを網羅するワークフロー。 これはブラインドシグナル製品ではありません。ロケーション、コンテキスト、タイミングを重視するトレーダーのための構造ファーストワークフローです。 ️ サマーセール — 夏至とThe Oracle Proの発売を記念して、Azimuth Proが30%オフ。現在279 USD(通常399 USD)。期間限定の夏季オファー。 1. V2での変更点 シンセティック・マルチタイムフレームエンジン 上位タイムフレーム分析をMeridian Proと同じ独自のシンセティックアーキテクチャで一から再構築。よりクリーンなHTFコンテキスト、安定したライブ動作、
ARICoin is a powerful trading companion designed to generate high-probability entry signals with dynamic TP/SL/DP levels based on volatility. Built-in performance tracking shows win/loss stats, PP1/PP2 hits, and success rates all updated live. Key Features: Buy/Sell signals with adaptive volatility bands Real-time TP/SL/DP levels based on ATR Built-in MA Filter with optional ATR/StdDev volatility Performance stats panel (Success, Profit/Loss, PP1/PP2) Alerts via popup, sound, push, or email Cust
This indicator automatically detects internal & swing market structure, Fibonacci Retracement and Fibo Levels. Features Full internal & swing market structure labeling in real-time Fibonacci Retracement Fibonacci Levels After purchasing the indicator, the full source code is provided, and via indicator buffers it can be easily integrated into your Expert Advisors (EAs) for automated trading strategies.
GEM Signal Pro GEM Signal Pro は、MetaTrader 5 向けのトレンドフォロー型インジケーターです。より明確なシグナル、より整理されたトレードセットアップ、そして実用的なリスク管理をチャート上で確認したいトレーダーのために設計されています。 単純な矢印だけを表示するのではなく、GEM Signal Pro はトレード全体の考え方を、より見やすく分かりやすい形で表示します。条件が確認されると、インジケーターはエントリー価格、ストップロス、利確目標をチャート上に表示し、トレードセットアップをより効率的に確認できるようにします。 動作の仕組み このインジケーターは、まず内部ロジックに基づいて有効なシードシグナルを検出します。 確認条件が満たされると、GEM Signal Pro はチャート上に完全なセットアップを表示します。これにより、トレーダーはトレード構造をより明確に把握し、手作業による分析を減らすことができます。 チャート上のトレードレベル 確認済みシグナルに対して、GEM Signal Pro は以下を表示できます。 エントリー価格 ストップロス テ
PrimeScalping is a powerful trading companion designed to generate high-probability entry signals with dynamic TP/SL/DP levels based on volatility. Built-in performance tracking shows win/loss stats, PP1/PP2 hits, and success rates — all updated live. Key Features: Buy/Sell signals with adaptive volatility bands Real-time TP/SL/DP levels based on ATR Built-in MA Filter with optional ATR/StdDev volatility Performance stats panel (Success, Profit/Loss, PP1/PP2) Alerts via popup, sound, push, or e
note: this indicator is for METATRADER4, if you want the version for METATRADER5 this is the link:  https://www.mql5.com/it/market/product/108106 TRENDMAESTRO ver 2.5 TRENDMAESTRO recognizes a new TREND from the start, he never makes mistakes. The certainty of identifying a new TREND is priceless. DESCRIPTION TRENDMAESTRO identifies a new TREND in the bud, this indicator examines the volatility, volumes and momentum to identify the moment in which there is an explosion of one or more of these da
Ace Trend
Mikhail Sergeev
5 (3)
私たちはあなたにトレンド取引の世界でゲームのルールを変える革命的な指標を提示します。 指標は、パフォーマンスを再考し、前例のない高さにあなたの取引経験を高めるように設計されています。 私たちの指標は、競合他社とは一線を画す高度な機能のユニークな組み合わせを誇っています。 "実質の価格設定要因"の先端技術は最も困難で、揮発市況の最高の安定性を保障する。 不安定なパターン、壊れた指標に別れを告げ、意識的で制御された取引を歓迎します。 指標は単なる美しい絵ではありません! 指標は、トレーダーの側にオッズをシフトし、それによって利益を得る必要があります。 インジケータ信号(完全自動モード)に基づいて取引結果に慣れる: https://www.mql5.com/ja/signals/2339244 AceTrendは、rbtiバージョンによるトレンド指標のランキングで第一位にランクされています。AceTrend-取引における最大の収益性と制御。 私たちの指標は、歴史ではなく、現在の市場相場に基づいて収益性を強調しています。 革命に参加-あなたの取引経験の可能性のロックを解除! インジケーターは、
MasterTrend Indicator for MT5 A powerful trend-following and signal-evaluation tool MasterTrend   is a custom MT5 indicator that combines Moving Averages and ATR-based risk/reward logic to generate clear buy/sell signals. It visualizes dynamic SL/TP levels, evaluates past trade outcomes, and displays win/loss statistics in a clean on-chart panel. Key features include: Buy/Sell signals based on MA crossovers ATR-based SL/TP1/TP2/TP3 levels with visual lines and labels Signal outcome tracking wit
ScalpPoint is a powerful trading companion designed to generate high-probability entry signals with dynamic TP/SL/DP levels based on volatility. Built-in performance tracking shows win/loss stats, PP1/PP2 hits, and success rates — all updated live. Key Features: Buy/Sell signals with adaptive volatility bands Real-time TP/SL/DP levels based on ATR Built-in MA Filter with optional ATR/StdDev volatility Performance stats panel (Success, Profit/Loss, PP1/PP2) Alerts via popup, sound, push, or emai
Boom & Crash & PainX & GainX Ultimate Spike Detector Trade Spikes With Confidence — Not Guesswork Catching spikes should be one of the most profitable strategies in synthetic markets. But for most traders, it becomes one of the most frustrating. You enter too early… price goes against you. You wait for a spike… it never comes. You finally catch one… but don’t know whether to hold or close. You make profit… then give it all back because there’s no exit plan. This is exactly the problem the Ultim
このインジケーターは、市場で 関心が示されたゾーン をハイライトし、その後に 注文の蓄積ゾーン を表示します。 これは、大規模な**板情報(オーダーブック)**のように機能します。 これは、 巨大な資金 のためのインジケーターです。その性能は卓越しています。 市場にどんな関心が存在していても、 必ず目に見えるようになります 。 (これは 完全に再設計され、自動化されたバージョン です。もはや手動分析は必要ありません。) トランザクションスピード(取引速度) は新しい概念のインジケーターで、市場で大口注文が どこに・いつ 集中しているかを示し、それに基づいたチャンスを提供します。 トレンドの変化を 非常に早い段階 で察知することができます。 FXでは「出来高」と呼ばれているものは誤解されています。実際には、これは 時間あたりの価格変動量 です。したがって、正しい名称は トランザクションスピード です。 考え方・行動・分析の仕方すべてが問われます。 分析パラダイムの転換は非常に重要です。 このインジケーターは、FXにおける出来高の考え方を 根本から再定義 し、論理的な形で正確に活用する、
RelicusRoad Pro: 定量的市場オペレーティングシステム 【期間限定】無制限アクセス 70% OFF - 2,000人超のトレーダーと共に なぜ多くのトレーダーは「完璧な」インジケーターを使っても失敗するのでしょうか? それは、文脈を無視して 単一の概念 だけでトレードしているからです。文脈のないシグナルは単なるギャンブルです。勝ち続けるには、 根拠の重なり(コンフルエンス) が必要です。 RelicusRoad Proは単なる矢印インジケーターではありません。完全な 定量的市場エコシステム です。独自のボラティリティモデリングを用いて、価格が推移する「適正価値の道(Fair Value Road)」をマッピングし、ノイズと真の構造的ブレイクを判別します。 推測はやめましょう。機関投資家レベルの「ロード・ロジック」でトレードを。 コアエンジン:「Road」アルゴリズム システムの中心となる Road Algo は、市場環境にリアルタイムで適応するダイナミックなボラティリティチャネルです。 安全ライン(平衡点) と、価格が数学的に反転しやすい 拡張レベル を投影します。 Si
相場が本当は何をしているのかを見抜く。   3つの市場フェーズ(収縮・拡張・トレンド)を目の前でライブに捉え、トレンド・フェーズの初期段階でより優れたエントリーを取りましょう   。      当て推量はもう終わり。機関投資家やスマートマネーのように相場を読み始めましょう。   Apex Market Structure Pro(MT5版)は、ノイズを取り除き、あらゆるローソク足の下にある真の構造を見せる高精度のスマートマネー分析ツ   ールです。流動性、構造転換、蓄積ゾーン、トレンドバイアスを、ひとつのクリーンでプロフェッショナルなオーバーレイに集約します。遅行   指標に見切りをつけ、明晰さをもってトレードする準備のできた本気のトレーダーのために作られました。   重要:本インジケーターは Heikin Ashi(平均足)ローソク足での動作を前提に設計されています。使用前にチャートを Heikin Ashi   に設定し、その真価を解き放ってください。分析のすべては Heikin Ashi の価格の流れを軸に構築されています。Apex Market Structure Pr
多くの矢印インジケーターは、シグナルだけを表示して、その後の判断をすべてトレーダーに任せてしまいます。KT Alpha Hunter Arrows は、完整なトレードプランをチャート上に提示します。 各シグナル矢印が表示されるたびに、エントリーライン、ストップロス、4つのテイクプロフィット水準、そして現在の銘柄と時間足が今トレードに値するかどうかを示すリアルタイムのエッジ判定が、すでに描画された状態で表示されます。付属の Trade Manager EA は、あなたが手動でエントリーした後の実行管理を担当し、相場が荒れて判断がぶれやすい場面でも規律あるトレードを保ちやすくします。リペイントなし。確定足シグナルのみ。Forex、ゴールド、指数、その他あなたが取引するあらゆる銘柄に対応します。 主な機能 リペイントしない買い矢印と売り矢印を、足の確定後にのみ表示。 各シグナルに、エントリーライン、構造的ストップロス、4つのテイクプロフィット水準を表示。 Edge Dashboard が、現在のチャートで買いセットアップと売りセットアップを別々に評価。 判定システム:No Edge、Mar
AriX
Temirlan Kdyrkhan
1 (4)
AriX Indicator for MT5 A powerful trend-following and signal-evaluation tool AriX is a custom MT5 indicator that combines Moving Averages and ATR-based risk/reward logic to generate clear buy/sell signals. It visualizes dynamic SL/TP levels, evaluates past trade outcomes, and displays win/loss statistics in a clean on-chart panel. Key features include: Buy/Sell signals based on MA crossovers ATR-based SL/TP1/TP2/TP3 levels with visual lines and labels Signal outcome tracking with real-time stat
Gold Uptrend Insider
Lawrence Chiiambb Mkandawi
5 (1)
Uptrend Insider A clean and powerful trend-following indicator that helps you catch the beginning of uptrends and exit before the market turns into a range or downtrend. How it works:   Green → Uptrend signal (potential buying opportunity) Orange → Ranging / sideways market possibility but maintain the trend positions just keep an eye for possible ranges and reversals. Red → Downtrend or exit signal (time to close long positions) The indicator is designed to be extremely simple and visual. You o
Title:FX-AIEA Supply and Demand Zone Indicator (MT5) — Technical Overview Version: 2.51 | Platform: MetaTrader 5 Introduction Supply and demand zones are considered a core manifestation of institutional order flow, providing a more direct reflection of buying and selling pressure than traditional support/resistance levels. This indicator attempts to automate the identification of high-probability supply and demand zones using an adaptive ZigZag algorithm, reducing the subjectivity and time asso
マーケットメーカーのためのツール。 Meravith は次の機能を提供します: すべての時間足を分析し、現在有効なトレンドを表示します。 強気と弱気の出来高が等しくなる流動性ゾーン(出来高均衡)を強調表示します。 異なる時間足のすべての流動性レベルをチャート上に直接表示します。 テキスト形式の市場分析を生成し、参考情報として表示します。 現在のトレンドに基づいて目標値、サポートレベル、ストップロスを計算します。 取引のリスクリワード比を算出します。 口座残高に基づいてポジションサイズを計算し、潜在的な利益を推定します。 また、市場に大きな変化があった場合には警告を表示します。 インジケーターの主要ライン: 強気/弱気の出来高エグゾーストライン ― 目標値として機能します。 市場のトレンドを示すライン。市場が強気か弱気かによって色が変わり、トレンドのサポートとして機能します。主にその色が市場センチメントを示します。 出来高均衡ライン(Eq)。Eq(Volume Equilibrium)ラインはシステムの中核です。これは買い手と売り手の出来高のバランスポイントを表します。市場の流動性を示し
SMC Sweep Fvg MT5 — スマートマネーと同じ目線で、チャート上に市場を映す こんな経験はありませんか。価格がストップを巻き取り、反転し、まさに想定どおりの方向へ進む。方向は正しかった。間違えたのはエントリーだけです。 このインジケーターは、そうした場面を減らすために作られています。分析で最も重い部分——チャートのマークアップ——を引き受け、本当に重要な「判断」をあなたに残します。 チャートに表示されるもの マーケットストラクチャー — 実際の構造的高値・安値に HH / HL / LH / LL ラベルとレベルライン。トレンドが一目で分かり、推測は不要です。 インバランスゾーン(FVG) — 価格が急ぎ過ぎて通過し、後で戻りやすい領域。未埋めと既埋めのゾーンは別色で表示されます。 流動性の動き — 反転前に市場がレベルを巻き取る瞬間を追跡します。 トレード設計の完成形 — エントリー矢印、ストップロス、利益目標。すべて描画済みで、頭の中で計算する必要はありません。 トレンドフィルター — 上位足のラインで、主戦場の動きの側に立ち続けられます。 インジケーターは
トレーダーの皆さん、こんにちは! 多くの個人トレーダーは、動作の遅いウェブスクリプトに頼っています。真の収益性を実現するには、体系化されたフレームワークが必要です。 Astro AIインジケーターは、一般的なチャートオーバーレイではありません。これは、ターミナル上で直接動作する2つのエージェントを含む、コンパイル済みのニューラルネットワークです。 システムの具体的な技術は以下のとおりです。 1. エージェント1:アナリスト(グラフィカルニューラルネットワーク - GNN) 市場は孤立した価格バーではなく、相互に連結されたデータネットワークです。 機能:エージェント1は、グラフィカルニューラルネットワークを使用して、これらの複雑で非線形な関係をマッピングします。 利点:一般的なインジケーターは過去の移動平均しか考慮しませんが、当社のGNNは市場の深い構造的関係をリアルタイムで処理し、個人トレーダーの取引量が大きな影響を与える前に、隠れた相関関係を明らかにします。 2. エージェント2:エグゼキューター(近接戦略最適化 - PPO) パターン認識は、戦いの半分に過ぎません
The Zone Trading Indicator is a technical analysis tool for MetaTrader 5 that automatically identifies and displays tradable price zones across multiple timeframes to assist with structured market analysis. The indicator plots Monthly, Weekly, Daily, and H4 tradable zones , allowing traders to view higher- and lower-timeframe price areas simultaneously. These zones are designed to support one-candle–based entry approaches by highlighting predefined areas where price interaction may be monitored.
VTrende Pro
Andrii Diachenko
5 (1)
VTrende Pro - MTF indicator for trend trading with a display panel for MT5 *** Videos can be translated into any language using subtitles (video language - Russian) Although the signals of the VTrende Pro indicator can be used as signals of a full-fledged trading system, it is recommended to use them in conjunction with the Bill Williams TS. VTrende Pro is an extended version of the VTrende indicator. Difference between Pro version and VTrende: - Time zones - Signal V - signal 1-2 waves -    S
Brandon Angelo Flag Pattern — how it works This indicator automatically detects classic bull and bear flag chart patterns in real time. The detection happens in three stages for each bar. First it looks for a flagpole — a sharp, strong directional move over a configurable number of bars ( FlagpoleBars , default 5) that must exceed a minimum percentage size ( FlagpoleMinPct ). For a bullish flag the pole must close net higher than it opened; for a bearish flag, net lower. Second it identifies th
SmartScalping is a powerful trading companion designed to generate high-probability entry signals with dynamic TP/SL/DP levels based on volatility. Built-in performance tracking shows win/loss stats, PP1/PP2 hits, and success rates — all updated live. Key Features: Buy/Sell signals with adaptive volatility bands Real-time TP/SL/DP levels based on ATR Built-in MA Filter with optional ATR/StdDev volatility Performance stats panel (Success, Profit/Loss, PP1/PP2) Alerts via popup, sound, push, or e
MasterTrend Indicator for MT5 A powerful trend-following and signal-evaluation tool MasterTrend   is a custom MT5 indicator that combines Moving Averages and ATR-based risk/reward logic to generate clear buy/sell signals. It visualizes dynamic SL/TP levels, evaluates past trade outcomes, and displays win/loss statistics in a clean on-chart panel. Key features include: Buy/Sell signals based on MA crossovers ATR-based SL/TP1/TP2/TP3 levels with visual lines and labels Signal outcome tracking wit
以下は Chimera Volume の日本語訳です。 MetaTrader 5用 Chimera Volume 高度な出来高分析と市場活動の可視化 Chimera Volumeは、MetaTrader 5向けに設計されたカスタムインジケーターです。正規化された出来高の動きを分析し、動的な視覚的フレームワークを通じて市場参加者の変化をリアルタイムで表示します。 このインジケーターは、適応型正規化アルゴリズムを用いてティック出来高データを処理し、出来高の強さ、蓄積フェーズ、および異なる市場条件下での活動シフトを構造化して表現します。 生の出来高を表示する標準的なインジケーターとは異なり、Chimera Volumeは追加の計算を適用することで、市場活動の相対的な変化を強調し、チャートの視認性を向上させます。 主な機能 ルート・インテント・ヒストグラム (Root Intent Histogram): 正規化された出来高の強さと市場参加度を視覚化する動的ヒストグラムです。適応型カラー・トランジションを採用しており、活動の活発化と参加の減少を明確に区別します。 慣性ライン (Inertia
==================================================================== SMC Pro v6.1 APEX AI — XAUUSD Gold Empire MetaTrader 5 インジケーター · Smart Money Concepts · 予測インテリジェンス・エンジン ==================================================================== SMC Pro v6.1 APEX AI は、MetaTrader 5 上の XAUUSD(ゴールド)専用に構築された、プロフェッショナルな Smart Money Concepts インジケーターシステムです。 完全な SMC フレームワーク — Order Blocks、Liquidity sweeps(流動性スイープ)、Fair Value Gaps、Break of Structure、Change of Character — に加え、AI を活用した 8 つの新モジュールを組み合わせ、精密なビ
作者のその他のプロダクト
Azimuth Pro
Ottaviano De Cicco
5 (7)
Azimuth Pro V2:MT5向けシンセティック・フラクタル構造分析と確認済みエントリー 概要 Azimuth Pro は Merkava Labs によるマルチレベルスイング構造インジケーターです。4つのネストされたスイングレイヤー、スイングアンカーVWAP、ABCパターン検出、3タイムフレーム構造フィルタリング、そして確定バーでの確認済みエントリー — 1つのチャートで、ミクロスイングからマクロサイクルまでを網羅するワークフロー。 これはブラインドシグナル製品ではありません。ロケーション、コンテキスト、タイミングを重視するトレーダーのための構造ファーストワークフローです。 ️ サマーセール — 夏至とThe Oracle Proの発売を記念して、Azimuth Proが30%オフ。現在279 USD(通常399 USD)。期間限定の夏季オファー。 1. V2での変更点 シンセティック・マルチタイムフレームエンジン 上位タイムフレーム分析をMeridian Proと同じ独自のシンセティックアーキテクチャで一から再構築。よりクリーンなHTFコンテキスト、安定したライブ動作、
Meridian Pro
Ottaviano De Cicco
4 (3)
Meridian Pro 2.00:MT5向けプロ仕様マルチタイムフレーム・トレンドマトリクス Meridian Pro 2.00 は、MetaTrader 5 向けのプロ仕様の適応型トレンドマトリクスです。オリジナルの Meridian トレンドエンジン、クリーンなチャート ribbon、確定足ベースのシグナル矢印、8時間足 dashboard、Fuel momentum、weighted consensus、synthetic HTF processing、そしてチャート上に直接表示される上位足コンテキストラインを統合します。 目的はシンプルです。現在のトレンド、マルチタイムフレーム構造、強度、momentum、EA-ready 状態を、複数チャートに無関係なインジケータを重ねるのではなく、1つの整理された workflow で読むことです。 ️ サマーセール — 夏至とThe Oracle Proの発売を記念して、Meridian Proが現在99 USD(通常149 USD)。期間限定の夏季オファー。 Meridian Pro の違い 1つの適応型エンジン - 同じ vola
Azimuth
Ottaviano De Cicco
5 (6)
Azimuth: Multi-Level Swing Structure Indicator for MT5 概要 Azimuth は Merkava Labs によるマルチレベルのスイング構造インジケーターです。4つの入れ子になったスイング階層、スイングアンカーVWAP、ABCパターン検出、そして確定足ベースの確認済みエントリー矢印を、Meridianアダプティブトレンドエンジンとともに一つのチャートに統合しています。ミクロなスイングからマクロなサイクルまで、ひとつのワークフローで確認できます。 多くのZigZagインジケーターは大きなスイングしか表示しませんが、Azimuthは4つの構造レベルを同時に表示し、早期サイクルのエントリー、後期サイクルの警告、完全な構造コンテキストを提供します。 1. 主な機能 Meridian Adaptive Trend Engine モメンタム・ゲーティングと動的ボラティリティ適応を備えたアダプティブ・トレンドリボンです。ローソク足カラーはトレンド状態に連動し、構造の読み取りをより明確にします。調整可能な3つのパラメータ: Period、Dep
FREE
TheOracle
Ottaviano De Cicco
4.7 (10)
The Oracleは、複数のインジケーターを管理することなく正確な市場分析を必要とするトレーダーに最適なパートナーです。 ほとんどのインジケーターが単一視点のシグナルを表示する中、The Oracleは科学的に実証された手法と独自の改良を一つのコンセンサスヒストグラムに統合します。 Ehlersスムージングアルゴリズムを搭載したUltimate Flow Index(UFI)を含む7つのモデルが、各バーで独立して投票します。 設定した閾値(4/7アグレッシブから7/7コンサバティブまで)に十分なモデルが一致すると、方向性が明確になります。 主な機能 7モデルコンセンサスシステム - 実績あるインジケーターと独自モデルの組み合わせ - 高度なスムージングを備えたUFI(Ultimate Flow Index)を搭載 - 事前最適化されたパラメーター(設定不要) 設定可能なアラート閾値 - 4/7モデル:アグレッシブ(早期シグナル、ノイズ多め) - 5/7モデル:スタンダード(バランス型) - 6/7モデル:推奨(最適なシグナル/ノイズ比) - 7/7モデル:コンサバティブ
FREE
Trinity Zones
Ottaviano De Cicco
5 (1)
Trinity Zones:MT5のための、セッションレベル付き高出来高ピボット・サポート&レジスタンス 概要 Trinity Zones は Merkava Labs によるサポート/レジスタンス・マッピングインジケーターです。高出来高ピボットが形成された価格帯をマークし、価格が各ゾーンとどう反応するかを追跡し、プロのトレーダーが注目するセッション基準レベルを重ねます — 前日高値/安値、フロアピボット、Central Pivot Range、オプションの Volume Profile。1枚のチャートで、価格が反応しやすい場所の地図が手に入ります。 判断する前に構造と文脈を見たいトレーダーのための、「場所優先」の地図です。 無料。 1. 機能の概要 Trinity Zones は 高出来高ピボット を検出し、それぞれの周りにサポートまたはレジスタンスゾーンを描画します。ピボットは、その出来高が適応的なしきい値を超えた場合にのみゾーンになります。これにより、チャートにはあらゆる小さなスイングではなく、実際に重要な活動があった領域だけが表示されます。 さらに各ゾーンは 役割 を持ちま
FREE
ほとんどのトレンド指標は選択を迫ります:頻繁なダマシを伴う素早いシグナル、それとも20本遅れるスムーズな出力。問題は移動平均線ではありません——ボラティリティが変化するのに指標が追随しないことが問題です。 Meridian Trendは、ボラティリティ正規化とモメンタムフィルタリングを内蔵した適応型トレンド指標です。リアルタイムで適応——EURUSD、ビットコイン、ナスダックのいずれでも同一の動作。銘柄ごとの調整不要。1つの設定、あらゆる資産、あらゆる時間足。 仕組み Meridian Trendは、トレンド方向に厳密にラチェット進行するボラティリティ適応型エンベロープを通じて価格を追跡します: • 上昇トレンドでは、エンベロープは上方にロック——上昇のみ可能で下落はしない • 下降トレンドでは、エンベロープは下方にロック——下落のみ可能で上昇はしない • 反転時には、モメンタムでフィルタリングされたクロスオーバーが方向転換を確認——リボンが反転し、矢印がそのバーをマーク
FREE
フィルタ:
Juan March
68
Juan March 2026.07.11 10:46 
 

After several weeks of using The Oracle Pro as part of my daily trading routine, I feel I now have enough experience to give an honest opinion.

This is simply my personal experience using Oracle as part of my own trading workflow.

I mainly trade lower timeframes, especially M5, where it's very easy to become focused on what's happening on your chart and lose sight of the bigger market picture. That's where Oracle has genuinely helped me broaden the way I analyse each trade.

The biggest impact Oracle has had on my trading is the way I interpret its signals. Instead of looking at them in isolation, I now analyse them within a much broader market context. That's where I've noticed the biggest improvement in the way I approach my trading decisions.

One of the things I appreciate most is the confidence that comes from being able to verify that the idea I'm seeing on my trading timeframe is aligned with the higher-timeframe picture. It doesn't mean the trade is guaranteed to work—that's never how markets work—but it does make me feel that every decision is much better supported before I commit to it.

Before using Oracle, I tended to focus mainly on the opportunities that appeared on my trading timeframe. Now, beyond simply seeing an opportunity, I have a much clearer understanding of why it makes sense to take it—or why it's better to wait for a higher-quality setup. It may seem like a small change, but it has made me approach trading with much more confidence and discipline.

Interestingly, the biggest difference hasn't been the trades I've decided to take, but the trades I've chosen not to take after evaluating the broader market picture. In many cases, avoiding a trade has been just as valuable as finding a good one.

Over the past few weeks, Oracle and Azimuth have naturally become part of a single workflow for me. Oracle helps me understand the broader market context, while Azimuth helps me read price structure and identify trade opportunities. To me, they don't compete with each other—they complement each other because each one addresses a different part of the decision-making process.

If I could suggest one possible direction for future development, it would be the continued evolution of the Oracle + Azimuth ecosystem.

Azimuth provides a very clear view of market structure through its swing analysis. In my opinion, that information adds another valuable layer to understanding how price is developing at any given moment.

It would be very interesting to explore an optional way of incorporating that structural information as an additional layer during context validation. I believe that could further improve the synchronisation between higher-timeframe context, price structure and execution timing.

Although I notice this particularly because I do a lot of M5 scalping, I believe the idea is equally applicable to any timeframe. The relationship between context, structure and timing exists regardless of the timeframe or trading style.

I think this could become a very valuable evolution for traders who already use both tools together as part of the same analytical workflow.

Another aspect I've really appreciated is the support. Whenever I've had a question or needed clarification, the team has always been approachable, willing to help, and happy to explain things in detail. You never get the feeling that you're left on your own after purchasing the product. That level of support gives you confidence, especially when you're investing time learning a professional trading tool. On top of that, it's clear that they genuinely listen to user feedback and are committed to continuously improving the ecosystem, which, in my opinion, adds significant value beyond the products themselves.

Overall, my experience with Oracle has been genuinely positive. Oracle hasn't changed the way I find trading opportunities; it has changed the way I decide whether those opportunities are worth taking. Now I spend much more time validating whether a trade idea truly makes sense before entering the market. That has made me far more selective and, above all, has given me greater confidence that the decisions I make are built on a much stronger foundation.

Looking back, that's probably been the biggest improvement in my trading since I started using Oracle.

Ottaviano De Cicco
7461
開発者からの返信 Ottaviano De Cicco 2026.07.11 16:05
Thank you very much, Juan. This is exactly the kind of workflow The Oracle Pro was designed for: not as a “take every signal” tool, but as a broader context and bias layer that helps traders decide when a setup is supported enough, and when it is better to wait. I also agree with your view on Oracle + Azimuth. They are not meant to compete: The Oracle Pro reads multi-timeframe context and consensus, while Azimuth Pro focuses more on price structure, execution context and trade location. Used together, they can create a much more complete decision process. Your suggestion about a deeper Oracle + Azimuth ecosystem is very valuable, especially the idea of adding structural information as an optional context-validation layer. This is exactly the kind of user feedback that helps shape future development. Thanks again for the detailed review, for your trust, and for taking the time to share a real trading workflow rather than just a first impression.
レビューに返信