Harmony Signals Pro

Elite Harmony Signals Pro

Panoramica

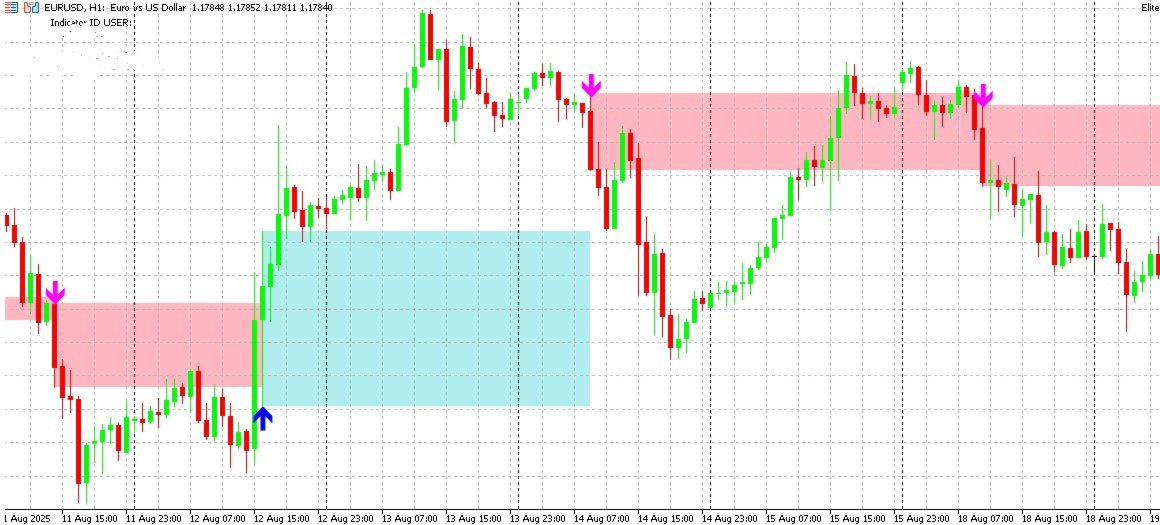
Elite Harmony Signals è un indicatore sofisticato di analisi tecnica che visualizza rettangoli dinamici che forniscono zone di trading chiare e segnali di conferma per decisioni migliorate.

Caratteristiche Principali

Zone Rettangolo Dinamiche

  • Estensione in Tempo Reale: I rettangoli si estendono automaticamente all'azione corrente del prezzo
  • Chiusura Intelligente: I rettangoli si chiudono solo quando appaiono segnali opposti
  • Conferma Visiva: Zone di trading chiare blu (BUY) e magenta (SELL)
  • Aspetto Personalizzabile: Colori e livelli di trasparenza regolabili

Metodologie di Trading

Strategia Conferma Rettangolo

Conferma BUY Potenziata: Quando viene creato un rettangolo BUY e la candela successiva chiude sopra la zona del rettangolo, questo fornisce conferma rialzista aggiuntiva

Conferma SELL Potenziata: Quando viene creato un rettangolo SELL e la candela successiva chiude sotto la zona del rettangolo, questo fornisce conferma ribassista aggiuntiva

Livelli di Filtro

  • Livello 1 (Flessibile)
  • Livello 2 (Standard)
  • Livello 3 (Restrittivo)

Applicazioni Pratiche

Trend Following

  • Identifica movimenti direzionali forti con conferma multi-indicatore
  • Usa rettangoli come zone dinamiche di supporto/resistenza
  • Filtra false rotture con allineamento momentum

Timing di Entrata

  • Aspetta conferma rettangolo prima dell'entrata in posizione
  • Usa chiusura candela sopra/sotto rettangolo come segnale trigger
  • Combina con price action per punti di entrata ottimali

Gestione del Rischio

  • I confini del rettangolo servono come riferimenti iniziali di stop-loss
  • Aggiusta dimensione posizione basata sulla confidenza del livello filtro

Parametri di Configurazione

Controlli Segnale

  • Livello Filtro: Scegli tra generazione segnali flessibile, standard o restrittiva
  • Timeframe Segnale: Analizza qualsiasi timeframe mentre visualizzi sul grafico corrente
  • Barre Storico: Limita visualizzazione segnali a periodi di mercato recenti
  • Anti-Spam: Barre minime tra segnali simili

Personalizzazione Visiva

  • Colori Rettangolo: Selezione colori BUY/SELL indipendente

Vantaggi

Affidabilità

  • Molteplici livelli di conferma riducono segnali falsi
  • Anti-repainting assicura accuratezza storica
  • Performance consistente attraverso condizioni di mercato

Chiarezza

  • Zone rettangolo visive eliminano interpretazione soggettiva
  • Frecce direzionali chiare per riconoscimento immediato
  • Aggiornamento dinamico mantiene rilevanza all'azione corrente del prezzo

Flessibilità

  • Adatto per scalping, day trading e swing trading
  • Adattabile a vari strumenti di mercato e timeframe
  • Sensibilità personalizzabile attraverso livelli filtro

Considerazioni Importanti

Condizioni di Mercato

  • Performa ottimamente in ambienti di mercato trending
  • Può generare meno segnali durante periodi di bassa volatilità
  • Considera contesto generale di mercato quando interpreti segnali

Disclaimer Rischio

  • Nessun indicatore garantisce operazioni profittevoli
  • Usa sempre tecniche appropriate di gestione rischio
  • Combina con analisi fondamentale e consapevolezza di mercato
  • Performance passata non predice risultati futuri

Ottimizzazione

  • Testa diversi livelli filtro per il tuo stile di trading
  • Aggiusta impostazioni anti-spam basate su preferenze timeframe
  • Considera analisi multi-timeframe per conferma segnali

  • Integrazione con Market Intelligence Hub (Consigliata)

    Per migliorare la qualità dei segnali, si consiglia vivamente di utilizzare il sistema insieme al Market Intelligence Hub (venduto separatamente). L'integrazione con MIH è progettata per filtrare i segnali a bassa probabilità analizzando il contesto di mercato.

    Perché l'integrazione con MIH è importante:

    • Conviction Scoring (0-100%): Misura la qualità del setup in base al contesto di mercato.

    • Sistema di Segnali: Un segnale Verde (Conviction superiore a 70%) indica un setup di alta qualità, un segnale Oro (50-69%) suggerisce cautela, mentre un segnale di Attesa (sotto il 50%) consiglia di non operare.

    • Regime di Mercato Globale: Rileva l'ambiente di mercato (Risk-On vs Risk-Off).

    • Rilevamento Anomalie: Avvisa di comportamenti di mercato insoliti.

    • Integrazione Calendario Economico: Filtra gli eventi di notizie ad alto impatto.

Elite Harmony Signals rappresenta un approccio comprensivo all'analisi tecnica, combinando metodologie provate con tecniche di visualizzazione moderne per supportare decisioni di trading informate attraverso varie condizioni di mercato e stili di trading.


おすすめのプロダクト
Ichimoku Kinko Hyo is a purpose-built trend trading charting system that has been successfully used in nearly every tradable market. It is unique in many ways, but its primary strength is its use of multiple data points to give the trader a deeper, more comprehensive view into price action. This deeper view, and the fact that Ichimoku is a very visual system, enables the trader to quickly discern and filter "at a glance" the low-probability trading setups from those of higher probability. This i
CosmiCLab SMC FIBO CosmiCLab SMC FIBO is a professional trading indicator designed for traders who use Smart Money Concepts (SMC), market structure analysis and Fibonacci retracement levels. The indicator automatically detects market swings and builds Fibonacci levels based on the latest impulse movement. It also identifies market structure changes such as BOS (Break of Structure) and CHOCH (Change of Character), helping traders understand the current market direction. CosmiCLab SMC FIBO also pr
TrendFollower (The Swiss Army Knife for Trends) Forget standard indicators. Discover TrendFollower – 5 strategies in one! Tired of indicators that show a buy signal when the market is long past its peak? Your moving averages are so laggy that they show last Tuesday's trend? Let's get this straightened out. I present to you TrendFollower – a powerful, modular framework (Institution-Grade) that analyzes market structure from five different perspectives. Whether you're a patient sw
Bober Real MT5
Arnold Bobrinskii
4.76 (17)
Bober Real MT5 is a fully automatic Forex trading Expert Advisor. This robot was made in 2014 year and did a lot of profitbale trades during this period. So far over 7000% growth on my personal account. There was many updates but 2019 update is the best one. The robot can run on any instrument, but the results are better with EURGBP, GBPUSD, on the M5 timeframe. Robot doesn't show good results in tester or live account if you run incorrect sets. Set files for Live accounts availible only for cu
プレミアムレベルは、正しい予測の精度が80%を超える独自の指標です。 この指標は、最高のトレーディングスペシャリストによって2か月以上テストされています。 あなたが他のどこにも見つけられない作者の指標! スクリーンショットから、このツールの正確さを自分で確認できます。 1は、1キャンドルの有効期限を持つバイナリーオプションの取引に最適です。 2はすべての通貨ペア、株式、商品、暗号通貨で機能します 手順: 赤い矢印が表示されたらすぐにダウントレードを開き、青い矢印が表示されたら閉じます。青い矢印の後に開くこともできます。 試してテストしてください!推奨設定はデフォルトです! 日足チャートで最高の精度を示します! インディケータは、2600 Pipsの収益性に対して、約10Pipsという非常に小さなマージンを使用します。
BREAK RETEST NON-REPAINT. WORKS BEST AT M15 AND ABOVE.  Benefits Fewer false breakouts . Combining close confirmation + retest + previous-close filter greatly reduces noise vs. raw high/low breaks. Tighter execution plans . The drawn level line gives an objective spot for entries, stop placement (just beyond the level), and partial-take-profit structure. Non-repainting confidence . Signals are placed on current bar. Flexible across markets . Works on FX, indices, metals, crypto; scalping on M15
Price Magnet — Price Density and Attraction Levels Indicator Price Magnet is a professional analytical tool designed to identify key support and resistance levels based on statistical Price Density. The indicator analyzes a specified historical period and detects price levels where the market spent the most time. These zones act as “magnets,” attracting price action or forming a structural base for potential reversals. Unlike traditional Volume Profile tools, Price Magnet focuses on price-time d
# RSI Pro Alert - Advanced RSI Indicator A powerful professional-grade RSI indicator with intelligent alerts, scheduled snapshots, and multi-dimensional notifications to help you capture market opportunities with precision! --- ## Key Features ### Smart Signal Detection - **Precision Cross Detection** : Automatically identifies critical moments when RSI crosses overbought/oversold levels - **State Tracking Mechanism** : Real-time monitoring of market state changes (Overbought/Overso
Gold Venamax - これは最高の株式テクニカル指標です。 指標アルゴリズムは資産の価格変動を分析し、ボラティリティと潜在的なエントリーゾーンを反映します。 インジケーターの機能: これは、快適で収益性の高い取引のためのマジックとトレンド矢印の 2 つのブロックを備えたスーパー インジケーターです。 チャート上にブロックを切り替えるための赤いボタンが表示されます。 マジックはインジケーター設定で設定されているため、異なるブロックを表示する 2 つのチャートにインジケーターをインストールできます。 Gold Venamax は、異なる矢印バッファー (GV と SD) を備えた 2 つのチャートに配置できます。 これを行うには、設定で異なる Magic を選択する必要があります。たとえば、あるマジック = 999、別のマジック = 666 を選択します。次に、チャート上の赤いボタンで矢印バッファを選択できます。 インジケーター設定の各矢印バッファー (GV および SD) には、快適で収益性の高い取引のための個別の矢印フィルターがあります (UseFiltrGV = true;
Apex Fibo Tracer — Smart Auto-Fibonacci Tool Apex Fibo Tracer is a professional analytical indicator that automates one of the most powerful methods in technical analysis — Fibonacci retracement levels. By combining a high-precision ZigZag algorithm with dynamic Fibonacci plotting, the tool delivers instant and accurate visualization of market structure directly on your chart. Most traders lose valuable seconds manually adjusting Fibonacci grids during high volatility. Apex Fibo Tracer eliminate
BlueBoat – Prime Cycle is a technical indicator for MetaTrader 5 that visualizes market cycles based on the Fimathe cycle model (Marcelo Ferreira) . It identifies and displays historic and live cycle structures such as CA, C1, C2, C3, etc., helping traders understand the rhythm and timing of price movement across multiple sessions. This tool is ideal for manual analysis or as a supporting signal in discretionary strategies. Key Features Historical Cycle Analysis – Backtest and visualize as many
RBreaker Gold Indicatorsは、金先物の短期日内取引戦略であり、トレンドフォローと日内反転の2つの取引手法を組み合わせたものです。トレンド相場での利益を捉えるだけでなく、相場が反転した際には迅速に利確し、その流れに沿ってポジションを反転させることができます。 この戦略は、アメリカの雑誌『Futures Truth』において、15年連続で最も収益性の高い取引戦略トップ10に選ばれた実績を持ち、非常に長いライフサイクルを誇り、現在も国内外で広く使用・研究されています。 本インディケーターは、2026年の金先物の値動きに対応し、14日間のATR指標に基づいて、ブレイクアウト係数A、観察係数B、リバーサル係数Rをより合理的な値で定義しています。非常に優れたインディケーターであり、安定的な年間収益を実現しています。ぜひおすすめします〜
Divergent Stochastic Filter II Catch Reversals Early, Filter Noise, Trade with Confidence The Edge: Why This Stochastic is Different  Every trader knows the Stochastic oscillator. But knowing when to trust its signals, that's the real challenge. The Divergent Stochastic Filter II transforms this classic indicator into a precision reversal detection system by adding critical elements: divergence intelligence, signal filtering and exhaustion detection.  While standard Stochastic oscillators fire s
SMC Venom Model BPR インジケーターは、スマート マネー (SMC) コンセプトで取引するトレーダー向けのプロフェッショナル ツールです。価格チャート上の 2 つの主要なパターンを自動的に識別します。 FVG   (フェアバリューギャップ) は、3 本のローソク足の組み合わせで、最初のローソク足と 3 番目のローソク足の間にギャップがあります。ボリュームサポートのないレベル間のゾーンを形成し、価格修正につながることがよくあります。 BPR   (バランス価格範囲) は、2 つの FVG パターンの組み合わせで、「ブリッジ」を形成します。これは、価格がボリュームアクティビティの少ない動きで動くときに、ブレイクアウトしてレベルに戻るゾーンで、ローソク足の間にギャップを作成します。 これらのパターンは、大規模な市場プレーヤーと一般参加者の相互作用が発生するチャート上のボリュームと価格動向の分析に基づいて、トレーダーが主要なサポート/レジスタンス レベル、ブレイクアウト ゾーン、エントリ ポイントを識別するのに役立ちます。 インジケーターは、長方形と矢印の形でパターンを視覚
Visual Dolphin Indicator
AL MOOSAWI ABDULLAH JAFFER BAQER
Visual Dolphin Indicator Unlock the rhythm of the market with the Visual Dolphin Indicator, your ultimate tool for identifying and capitalizing on market trends with clarity and confidence. Designed for both novice and experienced traders, this indicator eliminates the noise and guesswork, providing crystal-clear buy and sell signals directly on your chart. The Logic Behind the Waves The core of the Visual Dolphin Indicator is a sophisticated yet intuitive dual-wave system based on moving avera
SlopeChannelB – 価格の傾斜チャネルを構築するテクニカル分析ツールで、市場の現状を評価し、取引シグナルを見つけるためのユニークな機会を提供します。 インジケーターの主な特徴: 価格の傾斜チャネル : このインジケーターは、サポートとレジスタンスのレベルを視覚化するのに役立ち、トレンドの逆転または継続の可能性を示すことができます。 ラインの色と背景の強調表示が異なる : 傾斜したサポートとレジスタンスのレベルは異なる色で表示され、チャネル自体はさらに背景で強調され、チャートの視覚的分析を簡素化します。 ライン計算のための3つのオプション : このインジケーターは回帰分析を使用してチャネルラインを構築します。3つの方法から選択できます: Robust(デフォルト) – 外れ値に強い方法。 OLS(最小二乗法) . Median(中央値計算) . 最適なモデル選択 : SlopeChannelBは5つの品質基準の分析に基づいて最も適切なチャネルラインのバリエーションを自動的に選択します。 品質パラメータはチャートに直接表示され、結果の評価に役立ちます。また、ボタンを使
Trades History Visualizer is a MetaTrader 5 indicator that displays your trading history directly on the chart, providing a clear visual representation of past trades with additional information. Key Features: Visual trade history display with entry arrows Entry, Stop Loss, and Take Profit horizontal lines Color-coded connector lines between entry and exit points (green for profit, red for loss) Risk-Reward ratio display for each closed trade Profit/Loss amount display option Pip display option
VSAゴール この指標は、VSA(Volume Spread Analysis)システムを使用してチャート上のプロの買い手またはプロの売り手を識別し、これらのバー(ローソク足)および目標レベルに対す  特徴: 1. このインジケータでは、プロの買い手またはプロの売り手のみが決定され、両方のプロの参加者が同時に決定されるモードを選択することができます。 2. シンボルに任意の時間枠を設定して、サポートゾーンと目標レベルを決定することができます。 取引時には、サポートゾーンと目標レベルを決定するために大きな時間枠が設定され、取引自体はより正確な取引への参入のために小さな時間枠で実  3. インジケータ設定では、ティックボリュームが使用されている場合はティックボリュームを選択し、実際のボリュームが使用されている場合はリアルボリュームティックボリュームを選択することができます。 4. 大規模な販売者または購入者を決定するときは、ボリュームサイズとこのボリュームの検索期間を手動で選択できます。 5. 専門家を作成するために使用することができます。 説明: 緑色の点線は、購入者のサポートゾーンで
AlphaGain AI – 次世代AIによるエリートトレーディング精度 AlphaGain AIは、MetaTrader 5向けに設計された高性能エキスパートアドバイザー(EA)で、AIと過去10年以上のデータを活用し、マーケット環境に応じた自動適応戦略で正確なシグナルを提供します。 主な特徴: AIコア:ローソク足パターン、ボラティリティゾーン、モメンタムロジックを解析; 10年以上のヒストリカルデータで学習; 高度なエントリー/エグジットロジック:SL/TP、トレーリングストップ、ブレイクイーブン、ボラティリティに応じたTP; 資金保護:ドローダウン制限、エクイティガード、最大スプレッドフィルター、取引時間制限; 完全自動運用:人間の介入不要; 低レイテンシー対応:ECN環境に最適化。 推奨設定: 通貨ペア:EUR/USD 時間足:15分(M15) 最低残高:100ドル アカウントタイプ:ECNまたはRaw Spread レバレッジ:1:100以上 AlphaGain AIを選ぶ理由: 簡単導入:.ex5ファイル、.set設定、PDFガイド付属;
Stargogs Spike Catcher
Lorenzo Edward Beukes
4.56 (9)
Stargogs Spike Catcher V4.0 This Indicator is Developed To milk the BOOM and CRASH indices . Now Also work on weltrade for PAIN and GAIN indices. Send me Message if you need any help with the indicator.  CHECK OUT THE STARGOGS SPIKE CATCHER EA/ROBOT V3: CLICK HERE ALSO CHECK OUT SECOND TO NONEFX SPIKE CATCHER:   CLICK HERE STARGOGS SPIKE CATCHER V4.0 WHATS NEW! Brand New Strategy. This is the Indicator you need for 2025. New Trend Filter to minimize losses and maximize profits. New Trendline th
Overview SDZ Trend Pro is a professional Expert Advisor work for all symbol, recommend  XAUUSD (Gold) trading on the H1 timeframe . It combines dynamic price action patterns, EMA filters, and strict session-based trading logic to identify precise market entries with optimal risk control. This EA is ideal for traders who prefer structured, time-filtered trading during active market hours. ️ Core Features Dynamic Stop Loss (SL) logic Automatically sets SL based on candle pattern Chooses the
+++++++++++++++++++++++++++++++++++++++++++++++++++++++++++++++++++++++++++++++++++++++++++++++++++++++ +++ Link to EURUSD Only Free Version -->  https://www.mql5.com/en/market/product/156904 +++ Full License -->  https://www.mql5.com/en/market/product/156842 +++++++++++++++++++++++++++++++++++++++++++++++++++++++++++++++++++++++++++++++++++++++++++++++++++++++ +++ XMAS SALE +++ Get this indicator for free when renting the Forecast System Full License  (one license for one account)   +++ Please
Short Description Swing Timing Breakout EA is a smart Expert Advisor for MetaTrader 5 that combines trend filtering, momentum timing, and dynamic risk management to capture high-probability swing and breakout opportunities. Full Description Swing Timing Breakout EA is a professional trading robot designed for MetaTrader 5, suitable for traders who want a balance between automation, control, and disciplined risk management. This EA uses a trend-following and momentum confirmation approach ,
SPIKE DETECTOR RADAR ALERT – Surgical Precision in Explosive Market Movements Master market spikes with early alerts and high probability accuracy. Spike Detector Radar Alert is an advanced indicator for MetaTrader 5, developed to identify sudden price movements (spikes) in advance with enhanced precision. By combining volatility analysis, momentum strength, and price acceleration, the algorithm delivers clear signals at key market moments. Why traders choose Spike Detector Radar Alert: Mul
Volume Profile for MetaTrader 5 Price movement alone does not explain where the market is actually traded . What matters is where volume is built and how these areas shift over time. This Volume Profile displays the volume distribution directly on the chart , making it clear which price levels were accepted by the market and where rejection occurred. This allows structurally relevant zones to be identified and integrated into individual decision-making processes. The tool is designed for high pe
Terra Infinity is a flat indicator. This improved version of the CalcFlat indicator has three additional lines that significantly increase its effectiveness. Unlike its predecessor with two static levels, Terra Infinity adds three dynamic lines above the main histogram, which are interpreted as follows: base signal line, minimum signal line, maximum signal line. These lines are formed using the additional parameter Avg, which is the average value of the histogram. Averaging produces a line cl
##   ONLY GOLD ##   Тiльки Золото ## **Mercaria Professional Trading Zones - Complete Guide** ## **Mercaria Professional Trading Zones - Повний посібник** ### **How Mercaria Zones Work / Як працюють зони Mercaria** **English:** Mercaria Zones is an advanced trading indicator that identifies high-probability support and resistance areas using ZigZag extremes combined with mathematical zone calculations. The indicator works on multiple timeframes simultaneously, providing a comprehensive view
Force Trade X MT5 is an EA based on Force Index. Force Index parameters such as Period, BuyShift, BuyValue, SellShift, and SellValue can be adjusted. Force Trade X MT5 applies BTN TECHNOLOGY's state-of-the-art intelligent technology to help you create optimal results for your trades. May your dreams come true through Force Trade X MT5. Good luck. === Inquiries === E-Mail:support@btntechfx.com
Fractal 358 Plus is a predictive indicator that provides the clearest sight of price movements. Identifying graphic patterns such as Caixote (Crate), Pivot and Inside Candle , it shows entries and exits spots, as well as threats to your trades in the markets. It comes ready to use with B3 Mini Index (WIN$ series) and can be adjusted to use with any asset and timeframe. Fractal 358 unravels price movement Based on the Fibonacci sequence, Fractal 358 is a new and different way of reading and und
インディケータは現在のクオートを作成し、これを過去のものと比較して、これに基づいて価格変動予測を行います。インジケータには、目的の日付にすばやく移動するためのテキスト フィールドがあります。 オプション: シンボル - インジケーターが表示するシンボルの選択; SymbolPeriod - 指標がデータを取る期間の選択; IndicatorColor - インジケータの色; HorisontalShift - 指定されたバー数だけインディケータによって描画されたクオートのシフト; Inverse - true は引用符を逆にします。false - 元のビュー。 ChartVerticalShiftStep - チャートを垂直方向にシフトします (キーボードの上下矢印)。 次は日付を入力できるテキストフィールドの設定で、「Enter」を押すとすぐにジャンプできます。
このプロダクトを購入した人は以下も購入しています
ARIPoint is a powerful trading companion designed to generate high-probability entry signals with dynamic TP/SL/DP levels based on volatility. Built-in performance tracking shows win/loss stats, PP1/PP2 hits, and success rates all updated live. Key Features: Buy/Sell signals with adaptive volatility bands Real-time TP/SL/DP levels based on ATR Built-in MA Filter with optional ATR/StdDev volatility Performance stats panel (Success, Profit/Loss, PP1/PP2) Alerts via popup, sound, push, or email Cu
このインジケーターを購入された方には、以下の特典を 無料 で提供しています: 各トレードを自動で管理し、ストップロスとテイクプロフィットを設定し、戦略ルールに基づいてポジションを決済する補助ツール 「Bomber Utility」 様々な銘柄に合わせたインジケーターの設定ファイル(セットファイル) 「最小リスク」、「バランスリスク」、「待機戦略」 の3つのモードで使用できる Bomber Utility 用の設定ファイル このトレーディング戦略をすぐに導入・設定・開始できる ステップバイステップのビデオマニュアル ご注意: 上記の特典を受け取るには、MQL5のプライベートメッセージシステムを通じて販売者にご連絡ください。 オリジナルのカスタムインジケーター 「Divergence Bomber(ダイバージェンス・ボンバー)」 をご紹介します。これは、MACDのダイバージェンス(乖離)戦略に基づいた 「オールインワン」型のトレーディングシステム です。 このテクニカルインジケーターの主な目的は、価格とMACDインジケーターの間に発生するダイバージェンスを検出 し、将来の価格の動きを示す
Quantum TrendPulse を ご紹介します。これは、   SuperTrend   、   RSI   、および Stochastic のパワーを 1 つの包括的なインジケーターに組み合わせて、取引の可能性を最大限に引き出す究極の取引ツールです。精度と効率を求めるトレーダー向けに設計されたこのインジケーターは、市場のトレンド、勢いの変化、最適なエントリー ポイントとエグジット ポイントを自信を持って特定するのに役立ちます。 主な特徴: SuperTrend 統合: 現在の市場動向に簡単に追従し、収益性の波に乗ることができます。 RSI精度: 買われすぎと売られすぎのレベルを検出し、市場の反転のタイミングに最適で、SuperTrendのフィルターとして使用されます。 確率的精度: 確率的振動を活用して、変動の激しい市場で隠れたチャンスを見つけます。SuperTrend のフィルターとして使用されます。 マルチタイムフレーム分析:   M5 から H1 または H4 まで、さまざまなタイムフレームで市場を常に把握します。 カスタマイズ可能なアラート: カスタム取引条件が満たされ
Azimuth Pro
Ottaviano De Cicco
5 (7)
Azimuth Pro V2:MT5向けシンセティック・フラクタル構造分析と確認済みエントリー 概要 Azimuth Pro は Merkava Labs によるマルチレベルスイング構造インジケーターです。4つのネストされたスイングレイヤー、スイングアンカーVWAP、ABCパターン検出、3タイムフレーム構造フィルタリング、そして確定バーでの確認済みエントリー — 1つのチャートで、ミクロスイングからマクロサイクルまでを網羅するワークフロー。 これはブラインドシグナル製品ではありません。ロケーション、コンテキスト、タイミングを重視するトレーダーのための構造ファーストワークフローです。 V2発売記念オファー — Azimuth Pro V2をUSD 399で(次の100本)。最終価格:USD 499。 1. V2での変更点 シンセティック・マルチタイムフレームエンジン 上位タイムフレーム分析をMeridian Proと同じ独自のシンセティックアーキテクチャで一から再構築。よりクリーンなHTFコンテキスト、安定したライブ動作、従来のMTF同期問題なし。シンセティックエンジンは 固定比率タ
OmniSync Projection
Antonio-alin Teculescu
5 (1)
Chronos Fractal Engine is an innovative price projection indicator for MetaTrader 5, designed to transform your technical analysis by intelligently identifying and projecting historical price patterns. Built upon an advanced correlation algorithm and the fractal principles of the market, this powerful tool visualizes potential future price movements, giving you a unique edge in your trading decisions. What is Chronos Fractal Engine? At its core, the Chronos Fractal Engine employs a sophisticat
トレンド スクリーナー インジケーターでトレンド取引の力を解き放ちます。ファジー ロジックと複数通貨システムを活用した究極のトレンド取引ソリューションです。 ファジー ロジックを活用した革新的なトレンド インジケーターである Trend Screener を使用して、トレンド取引を向上させます。 これは、13 を超えるプレミアム ツールと機能、および 3 つの取引戦略を組み合わせた強力なトレンド追跡インジケーターであり、Metatrader をトレンド アナライザーにする多用途の選択肢となります。 期間限定オファー : トレンド スクリーナー インジケーターは、わずか 100 ドルで生涯ご利用いただけます。 (元の価格 50$ ) (オファー延長) Trend Screener の 100% 非再描画精度の揺るぎない精度を体験して、取引の決定が過去の価格変動の影響を受けないようにしてください。 マルチタイムフレームおよびマルチ通貨機能の多用途性を解放し、比類のない自信を持って外国為替、商品、暗号通貨、インデックスの世界を取引できるようにします。 Trend Screener の包括的な
優れたテクニカルインジケーター「Grabber」をご紹介します。これは、すぐに使える「オールインワン」トレーディング戦略として機能します。 ひとつのコードに、市場のテクニカル分析ツール、取引シグナル(矢印)、アラート機能、プッシュ通知が強力に統合されています。 このインジケーターを購入された方には、以下の特典を無料で提供します: Grabberユーティリティ:オープンポジションを自動で管理するツール ステップバイステップのビデオマニュアル:インジケーターのインストール、設定、取引方法を解説 カスタムセットファイル:インジケーターをすばやく自動設定し、最大限の成果を出すための設定ファイル 他の戦略はもう忘れてください!Grabberだけが、あなたを新たなトレードの高みへと導いてくれるのです。 Grabber戦略の主な特徴: 推奨タイムフレーム:M5〜H4 対応通貨ペア・資産:どれでも使用可能ですが、私が実際に検証した以下を推奨します(GBPUSD、GBPCAD、GBPCHF、AUDCAD、AUDUSD、AUDSGD、AUDCHF、NZDUSD、NZDCAD、EURCAD、EURUSD、E
CGE Trading Suite
Carl Gustav Johan Ekstrom
5 (2)
Institutional-Grade Analytics for MT5 C GE Trading Suite delivers the analytical edge typically reserved for professional trading desks. The platform integrates a full suite of analytical tools into one seamless workflow: dynamic grid mapping, liquidity behavior analysis, ECM, trend lines, MIDAS, trade cycles, and directional channel projections. Together, these provide a unified view of market structure and momentum. Directional clarity is further enhanced by the capital flow index, which meas
SignalTech MT5 is a trading system for EURUSD, USDCHF, USDJPY, AUDUSD, NZDUSD, EURJPY, AUDJPY, NZDJPY, CADJPY H2 and H3 Timeframe.  It can generate signals with Buy/Sell Arrows and Pop-Up/Sound Alerts. Each signal has clear Entry and Stop Loss levels, which should be automatically flagged on the chart, as well as potential Targets 1, 2, and 3. The Entry and TP levels are fixed after the trade is taken. The exit level is dynamic. If there are signs of a potential short-term trend reversal, the
BTMM State Engine Pro is a MetaTrader 5 indicator for traders who use the Beat The Market Maker approach: Asian session context, kill zone timing, level progression, peak formation detection, and a multi-pair scanner from a single chart. It combines cycle state logic with a built-in scanner dashboard so you do not need the same tool on many charts at once. What it does Draws the Asian session range; session times can follow broker server offset or be set in inputs. Tracks level progression (L
ご紹介     Quantum Breakout PRO は 、ブレイクアウト ゾーンの取引方法を変革する画期的な MQL5 インジケーターです。 13年以上の取引経験を持つ経験豊富なトレーダーのチームによって開発されました。     クォンタム ブレイクアウト プロ   は、革新的でダイナミックなブレイクアウト ゾーン戦略により、あなたのトレーディングの旅を新たな高みに押し上げるように設計されています。 クォンタム ブレイクアウト インジケーターは、5 つの利益ターゲット ゾーンを備えたブレイクアウト ゾーン上のシグナル矢印と、ブレイクアウト ボックスに基づいたストップロスの提案を提供します。 初心者トレーダーにもプロのトレーダーにも適しています。 量子EAチャネル:       ここをクリック 重要!購入後、インストールマニュアルを受け取るためにプライベートメッセージを送ってください。 推奨事項: 時間枠: M15 通貨ペア: GBPJPY、EURJPY、USDJPY、NZDUSD、XAUUSD アカウントの種類: ECN、Raw、またはスプレッドが非常に低い R
Bill Williams Advanced is designed for automatic chart analysis using Bill Williams' "Profitunity" system. The indicator analyzes four timeframes at once. Manual (Be sure to read before purchasing) Advantages 1. Analyzes the chart using Bill Williams' "Profitunity" system. Signals are displayed in a table in the corner of the screen and on the price chart. 2. Finds all known AO and AC signals, as well as zone signals. Equipped with a trend filter based on the Alligator. 3. Finds "Divergence Bar
Berma Bands
Muhammad Elbermawi
5 (8)
Berma Bands (BBs) インジケーターは、市場のトレンドを特定して活用したいトレーダーにとって貴重なツールです。価格と BBs の関係を分析することで、トレーダーは市場がトレンド段階にあるか、レンジ段階にあるかを判断できます。 詳細については、[ Berma Home Blog ] をご覧ください。 バーマ バンドは、上部バーマ バンド、中部バーマ バンド、下部バーマ バンドの 3 つの異なる線で構成されています。これらの線は価格の周りにプロットされ、全体的な傾向に対する価格の動きを視覚的に表します。これらのバンド間の距離から、ボラティリティや潜在的な傾向の反転についての洞察を得ることができます。 バーマ バンドの線がそれぞれ離れると、市場が横ばいまたはレンジ相場の期間に入っていることを示すことがよくあります。これは、明確な方向性の偏りがないことを示しています。トレーダーは、これらの期間中にトレンドを特定するのが難しいと感じる可能性があり、より明確なトレンドが出現するまで待つ場合があります。 バーマ バンドの線が 1 本の線に収束すると、強いトレンド環境の兆候となること
ARICoin is a powerful trading companion designed to generate high-probability entry signals with dynamic TP/SL/DP levels based on volatility. Built-in performance tracking shows win/loss stats, PP1/PP2 hits, and success rates all updated live. Key Features: Buy/Sell signals with adaptive volatility bands Real-time TP/SL/DP levels based on ATR Built-in MA Filter with optional ATR/StdDev volatility Performance stats panel (Success, Profit/Loss, PP1/PP2) Alerts via popup, sound, push, or email Cust
Master Editionは、ボリュームとマネーフローの視点を通じて市場構造を可視化するために設計されたプロフェッショナルグレードの分析ツールです。標準のボリュームインジケーターとは異なり、このツールはチャート上に日足ボリュームプロファイルを直接表示し、価格発見がどこで行われたか、そして「スマートマネー」がどこに位置しているかを正確に確認できます。 このMaster Editionは、明確さとスピードを考慮して設計されており、ロード時にチャートレイアウトを即座に美化するユニークな自動テーマ同期システムを備えています。 主な機能: 真のマネーフロー計算: 標準のティックボリュームを超えます。「Use Money Flow」を有効にすると、ボリュームは価格によって重み付けされ、特定の価格レベルでの実際の資本コミットメントが明らかになります。 バリューエリア (VA) の可視化: バリューエリア(デフォルトではボリュームの70%)を自動的に計算します。 VA Fill: コントロールゾーンを即座に識別するために、バリューエリアの背景をシェーディングします。 主要レベル: コントロールポイン
Gannスクエアインジケーターは、W.D. Gannによって執筆された「市場予測のための数学的な式」の記事に基づく強力な市場分析ツールです。このツールは、解析に数学的な概念を応用し、Gann理論に基づいています。それは、144、90、52のスクエアや9のスクエアなど、Gannの関連テクニックの要素を取り入れています。さらに、の方法を組み込んでおり、9のスクエアとその関連性についてのチャネルやスターパターンに焦点を当てています。 ユーザーマニュアルと使用方法: このインジケーターを使用する前に、ユーザーマニュアルを読んで疑問点を解決するためにお問い合わせいただくことをお勧めします。ユーザーマニュアルの完全版は、当社のウェブサイトで入手できます。 MT5の完全版は購入できますし、MT4の無料版も試すことができます。両方のバージョンへのリンクを提供していますので、ご利用ください。 主な機能と機能: Gannスクエアインジケーターは、市場分析のための完全なツールセットを提供し、幾何学的な概念とGann理論に基づいて的確な判断を行う手助けをします。以下に主な機能を示します。 9のスクエアの分析:
Cvd Divergence
Thalles Nascimento De Carvalho
CVD Divergence ― オーダーフローとダイバージェンスのプロフェッショナル分析 CVD Divergence は、価格と Cumulative Delta Volume(CVD)との間に発生する信頼性の高いダイバージェンスを検出するために開発されたテクニカル指標です。実際の注文フローが価格の動きを確認していない局面を正確に捉え、反転、勢いの減衰、そして機関投資家による操作の可能性を示します。 このインジケーターは、アグレッシブボリュームの読み取りと価格構造の分析を組み合わせ、明確で客観的かつ先行性のあるシグナルを提供します。 インジケーターの機能 CVD Divergence は、累積デルタボリュームを用いて注文フローの方向と価格の方向を比較します。両者が大きく乖離した際、チャート上にマーカーを表示し、ダイバージェンスの方向を視覚的に示します。 検出できる内容: 強気ダイバージェンス(価格が下落しているが CVD が上昇している場合) 弱気ダイバージェンス(価格が上昇しているが CVD が下降している場合) 買い手・売り手の勢いの枯渇 機関投資家の不均衡によるフェイクムーブ
まず第一に、この取引ツールはノンリペイント、ノンリドロー、ノンラグの指標であり、プロの取引に理想的ですことを強調する価値があります。 オンラインコース、ユーザーマニュアル、デモ。 スマートプライスアクションコンセプトインジケーターは、新米から経験豊富なトレーダーまで、非常 に強力なツールです。Inner Circle Trader AnalysisやSmart Money Concepts Trading Strategiesなど、20以上の有用な指標を1つに組み合わせています。このインジケーターはスマートマネーコンセプトに焦点を当て、大手機関の取引方法を提供し、彼らの動きを予測するのに役立ちます。 特に、流動性分析に優れており、機関がどのように取引しているかを理解しやすくしています。市場のトレンドを予測し、価格の動きを慎重に分析するのに優れています。機関の戦略とトレードを合わせることで、市場の動向についてより正確な予測ができます。このインジケーターは多目的であり、市場構造を分析し、重要な注文ブロックを特定し、さまざまなパターンを認識するのに優れています。 このインジケーター
Gartley Hunter Multi - An indicator for searching for harmonic patterns simultaneously on dozens of trading instruments and on all possible timeframes. Manual (Be sure to read before purchasing) | Version for MT4 Advantages 1. Patterns: Gartley, Butterfly, Shark, Crab. Bat, Alternate Bat, Deep Crab, Cypher 2. Simultaneous search for patterns on dozens of trading instruments and on all possible timeframes 3. Search for patterns of all possible sizes. From the smallest to the largest 4. All fou
Introducing Indicator for PainX and GainX Indices Traders on Weltrade Get ready to experience the power of trading with our indicator, specifically designed for Weltrade   broker's PainX and GainX Indices.  Advanced Strategies for Unbeatable Insights Our indicator employs sophisticated strategies to analyze market trends, pinpointing optimal entry and exit points.  Optimized for Maximum Performance To ensure optimal results, our indicator is carefully calibrated for 5-minute timeframe charts on
Presenting one-of-a-kind Gann Indicator for XAUUSD IQ Gold Gann Levels is a non-repainting, precision tool designed exclusively for XAUUSD/Gold intraday trading. It uses W.D. Gann’s square root method to plot real-time support and resistance levels, helping traders spot high-probability entries with confidence and clarity. William Delbert Gann (W.D. Gann) was an exceptional market analyst whose trading technique was based on a complex blend of mathematics, geometry, astrology, and ancient calcul
RelicusRoad Pro: 定量的市場オペレーティングシステム 【期間限定】無制限アクセス 70% OFF - 2,000人超のトレーダーと共に なぜ多くのトレーダーは「完璧な」インジケーターを使っても失敗するのでしょうか? それは、文脈を無視して 単一の概念 だけでトレードしているからです。文脈のないシグナルは単なるギャンブルです。勝ち続けるには、 根拠の重なり(コンフルエンス) が必要です。 RelicusRoad Proは単なる矢印インジケーターではありません。完全な 定量的市場エコシステム です。独自のボラティリティモデリングを用いて、価格が推移する「適正価値の道(Fair Value Road)」をマッピングし、ノイズと真の構造的ブレイクを判別します。 推測はやめましょう。機関投資家レベルの「ロード・ロジック」でトレードを。 コアエンジン:「Road」アルゴリズム システムの中心となる Road Algo は、市場環境にリアルタイムで適応するダイナミックなボラティリティチャネルです。 安全ライン(平衡点) と、価格が数学的に反転しやすい 拡張レベル を投影します。 Si
「 Dynamic Scalper System MT5 」インジケーターは、トレンド波の中でスキャルピング取引を行う手法のために設計されています。 主要通貨ペアと金でテスト済みで、他の取引商品との互換性があります。 トレンドに沿った短期的なポジションオープンのシグナルを提供し、追加の価格変動サポートも提供します。 インジケーターの原理 大きな矢印はトレンドの方向を決定します。 トレンド波の中では、小さな矢印の形でスキャルピングシグナルを生成するアルゴリズムが機能します。 赤い矢印は強気方向、青い矢印は弱気方向です。 トレンドの方向には敏感な価格変動ラインが描かれ、小さな矢印のシグナルと連動します。 シグナルは次のように機能します。適切なタイミングでラインが現れるとエントリーシグナルが形成され、ラインが開いている間はポジションが保持され、完了すると取引が終了します。 推奨される動作時間枠はM1~H4です。 矢印は現在のローソク足に形成され、次のローソク足が開いている場合は、前のローソク足の矢印は再描画されません。 入力パラメータ Trend Wave Period - トレ
このインジケーターは、反転ポイントと価格戻りゾーンを正確に表示します。     主要プレーヤー 。新たなトレンドが形成される場所を把握し、最大限の精度で意思決定を行い、すべての取引をコントロールします。 TREND LINES PRO インジケーターと組み合わせることで、その潜在能力を最大限に発揮します。 VERSION MT4 インジケーターが示す内容: 新しいトレンドの始まりに活性化する反転構造と反転レベル。 リスクと報酬の比率を最小限に抑えた利益 確定 と 損失停止の レベルの表示     RR 1:2   。 インテリジェントな削減ロジックによるストップロス。 指定されたインジケーターから 2 つのトレンド タイプの反転パターンを表示します。 指標: トレンドを追う   TREND LINES PRO   (世界的なトレンドの変化) TREND PRO   (クイックトレンド変更) シンプルで効果的   スキャナー   リアルタイムトレンド(新機能)。 マルチタイムフレームのインストゥルメント フィルタリング。 画面   利益     LOGIC AI信号の後。 当日プラス方
AriX
Temirlan Kdyrkhan
1 (4)
AriX Indicator for MT5 A powerful trend-following and signal-evaluation tool AriX is a custom MT5 indicator that combines Moving Averages and ATR-based risk/reward logic to generate clear buy/sell signals. It visualizes dynamic SL/TP levels, evaluates past trade outcomes, and displays win/loss statistics in a clean on-chart panel. Key features include: Buy/Sell signals based on MA crossovers ATR-based SL/TP1/TP2/TP3 levels with visual lines and labels Signal outcome tracking with real-time stat
CRT Multi-Timeframe Market Structure & Liquidity Sweep Indicator Non-Repainting | Multi-Asset | MT4 Version Available MT4 Version: https://www.mql5.com/en/market/product/162556 Full Setup Guide: https://www.mql5.com/en/blogs/post/767525 Indicator Overview CRT Ghost Candle HTF Fractal is a complete institutional-grade market structure toolkit for MetaTrader 5. It projects higher-timeframe candle structure, CRT trap levels, session levels, previous period highs and lows, pivot points, and a real
Ziva LSE System
Hassan Abdullah Hassan Al Balushi
ZIVA LSE System A Professional Liquidity & Structure Execution Framework Executive Overview ZIVA LSE System is a professionally engineered analytical framework designed to interpret market behavior through structural logic and liquidity dynamics. It is not positioned as a conventional indicator. Rather, it functions as a structured execution environment that organizes price action into a clear, disciplined decision-making model. The system is built to deliver consistency, clarity, and controlle
機関投資家の視点で市場を見る:ノイズを減らし、質の高い機会に集中する 複数のチャートを切り替え続けたり、曖昧なシグナルに迷う必要はありません。 OmniView ICT Dashboard は Market Watch 内のすべての銘柄をリアルタイムでスキャンし、より価値の高いトレード機会を特定するのを支援します。 分析をより明確にし、意思決定をより効率的にします。 主な機能 複数銘柄の同時スキャン ICTロジックに基づくトレード機会の検出 各セットアップを 0〜100% でスコアリング ワンクリックでチャート同期 高品質な市場環境に集中できる設計 スコアリングシステム 市場構造、モメンタム、流動性の挙動を基に各機会を評価します: 85% – 100% → 複数要因が強く一致(優先度高) 70% – 84% → 明確な方向性と良好な確認 60% – 69% → 有効だが追加確認が必要 60%未満 → 市場形成段階 質の高い機会を絞り込み、弱いトレードを回避するのに役立ちます。 Smart Money ロジックベース システムは以下の主要な市場構造を自動で識別します:
ZIVA Signal Intelligence
Hassan Abdullah Hassan Al Balushi
ZIVA Signal Intelligence An Adaptive, Modular Market Intelligence System ZIVA Signal Intelligence is not positioned as a conventional trading indicator. It is a fully integrated, proprietary market intelligence system engineered to deliver structured, high-precision interpretation of price behavior within a controlled analytical environment. Developed through an independent architectural approach, ZIVA does not rely on, derive from, or replicate existing indicators. It represents a standalone
Volatility Trend System - a trading system that gives signals for entries. The volatility system gives linear and point signals in the direction of the trend, as well as signals to exit it, without redrawing and delays. The trend indicator monitors the direction of the medium-term trend, shows the direction and its change. The signal indicator is based on changes in volatility and shows market entries. The indicator is equipped with several types of alerts. Can be applied to various trading ins
作者のその他のプロダクト
L'indicatore "Heikin Ashi" è stato progettato per migliorare l'analisi dei grafici finanziari con un sistema di candele Heikin Ashi. Le candele Heikin Ashi sono un metodo avanzato per visualizzare il prezzo, che aiuta a filtrare il rumore del mercato, rendendo più chiara l'interpretazione dei trend e migliorando la qualità delle decisioni di trading. Questo indicatore consente di visualizzare le candele Heikin Ashi al posto delle candele giapponesi tradizionali, rendendo l'analisi grafica più pu
FREE
Pivot Points Classic – L’indicatore essenziale per ogni trader tecnico Questo indicatore disegna automaticamente i livelli di Pivot Point più utilizzati dai trader professionisti, con supporto completo a 4 metodi di calcolo:   Metodi supportati : • Traditional • Fibonacci • Woodie • Camarilla   Caratteristiche principali :  Calcolo su timeframe superiore (multi-timeframe)  Visualizzazione chiara dei livelli P, R1, R2, R3, S1, S2, S3   Etichette dinamiche con nome e valore del livello  Colori per
FREE
Il WaveForce Indicatorsu un sistema di doppia envelope esponenziale e smussamento dinamico, WaveForce separa matematicamente l'energia rialzista e ribassista, tracciando due curve (Bull e Bear) e una linea di segnale centrale. Questo consente al trader di percepire con chiarezza quale delle due forze stia guidando il mercato.  Caratteristiche principali: Calcola la pressione rialzista e ribassista separatamente Include una linea di segnale EMA adattiva per confermare inversioni Oscillatore fluid
FREE
To get started, subscribe to the RealTrend Telegram channel. t.me/RealTrendFree RealTrend is an EA that facilitates trading for expert users. The user's aim is to identify the right business trend and let RealTrend suggest the placement of pending orders in strategic points where the price will retrace and then continue its trend. RealTrend is very simple to use and includes a single user-defined stoploss input and an intuitive chart panel. The takeprofit is placed directly by the Bot. risk l
FREE
Market Intelligence Hub  contattatemi per ricevere template da usare conAI Descrizione generale Market Intelligence Hub è un indicatore professionale di analisi multi-asset progettato per MetaTrader 5. Trasforma la complessità dei mercati globali in una visione operativa chiara e sintetica, utile sia per trader discrezionali che per analisti quantitativi. Monitora oltre 25 strumenti suddivisi in cinque categorie chiave (USD, EUR, Risk Assets, Safe Haven, Volatility) e fornisce un quadro complet
Un potente indicatore multifunzione progettato per offrire una visione chiara e strutturata della forza del mercato, integrando tre strumenti tecnici in un'unica interfaccia intuitiva:   Caratteristiche principali:   Heikin Ashi RSI Normalizzato Calcolato sul RSI di medie Heikin Ashi, centrato su una scala da -50 a +50 Visualizzazione con candele colorate (blu/rosso) per una lettura chiara della direzione e del momentum   Stocastico Modificato %K e %D convertiti sulla stessa scala -50/+50 Opzion
Questo indicatore avanzato disegna automaticamente pivot High/Low e trendline su un timeframe selezionato (es. H4, D1, ecc.) e li rende visibili su tutti i timeframe inferiori. L'obiettivo principale è fornire un contesto strutturale multi-timeframe unito a segnali di tocco sulle trendline.  Caratteristiche principali:   Trendline Automatiche : Disegnate tra i pivot High e Low rilevati sul timeframe selezionato. Classificate in trendline rialziste (UpTrend), ribassiste (DownTrend) e rotte (Brok
Un indicatore avanzato che combina la regressione logaritmica dinamica con strumenti di analisi trend intelligente , visualizzazioni personalizzabili e filtri avanzati per confermare la direzione del mercato.   Come utilizzare l’indicatore Logarithmic Regression Channel - Trend (Disegnato su timeframe superiori)   Trend rialzista (slope ≥ +3) Si può acquistare in due modi: Quando il prezzo rimbalza sulla banda inferiore del canale (trendline bassa). Quando il prezzo supera la linea centrale del
Un indicatore avanzato che identifica in automatico le zone chiave di supporto e resistenza su tre timeframe diversi , mostrandole con rettangoli colorati direttamente sul grafico. Ogni zona viene estesa in avanti, etichettata e aggiornata dinamicamente con il movimento del prezzo.   Caratteristiche principali   3 Timeframe configurabili (es. M15, H1, H4)   Zone di resistenza e supporto calcolate automaticamente   Colori personalizzabili per ciascun timeframe   Etichette automatiche con indicazi
THUNDER WAVE ANALYZER – Professional Multi-Trend Analysis System Il Thunder Wave Analyzer è un indicatore avanzato multi-strumento che combina in un’unica interfaccia la potenza di diversi sistemi di analisi tecnica. Pensato per trader professionisti e scalper, questo tool permette di leggere la forza del trend , rilevare setup ad alta probabilità e individuare con precisione i momenti di pressione del mercato.  Cosa rende unico il Thunder Wave Analyzer?  In un solo indicatore integra più metod
ForceFlow – Momentum & Trend Predictor ForceFlow è un indicatore avanzato che combina la forza del Relative Strength Index (RSI) con un innovativo istogramma dinamico multi-livello , colorato in base alla direzione del trend. I colori si adattano in tempo reale, anticipando la formazione della prossima candela e filtrando i falsi segnali.  Caratteristiche principali: RSI dinamico a colori (blu per fase rialzista, rosso per fase ribassista). Istogramma multilivello  che rappresenta la forza e la
フィルタ:
レビューなし
レビューに返信