TrendFactor

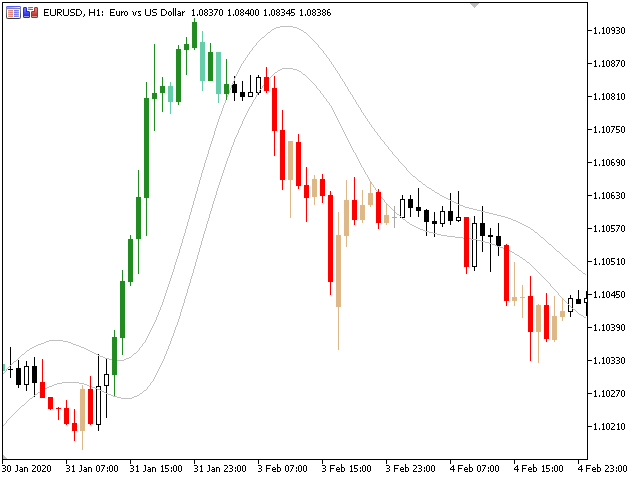
Trend Factor is an indicator based on the calculation of price values ​​to answer questions about what direction the trend is acting on the market at the moment and when this trend will end.

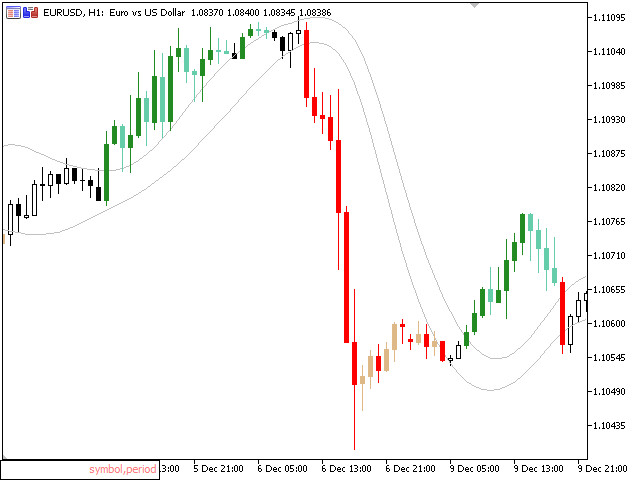
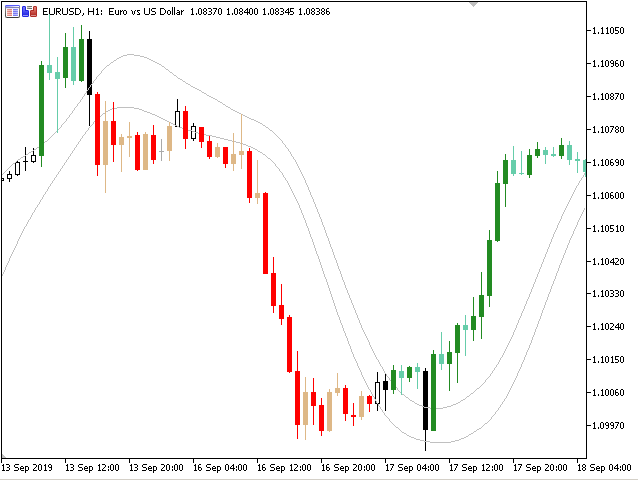
By launching the Trend Factor indicator, the user will see two lines and bars of different colors, which can change color to green during an uptrend, to red during a downtrend or to be yellow during an uncertainty.

The trader uses the Trend Factor indicator to determine the market situation. This is a trending algorithm that is convenient to download, install and use. If you want an understanding of the strength and duration of the current trend, then the Trend Factor indicator is for you.
おすすめのプロダクト
The Price Spectrum indicator reveals opportunities for detailed market analysis. Advantages: Market Volume Profile Creation : The indicator assists in analyzing the dynamics of trading volumes in the market. This allows traders to identify crucial support and resistance levels, as well as determine market structure. Filtering Insignificant Volumes : Using the indicator helps filter out insignificant volumes, enabling traders to focus on more significant market movements. Flexible Configuration S
Scalper Pro – XAUUSD、EURUSD、JPY向け高度スキャルピングインジケーター (M1/M5/M15)|出来高スパイク+マーケット構造ブレイク搭載 より賢く、より速く、Scalper Proで取引。 Scalper Proは、 MetaTrader 5用の高性能スキャルピングインジケーター で、 XAUUSDゴールドスキャルピング、EURUSDデイトレード、JPYブレイクアウト戦略 に特化した プロトレーダー向け に設計されています。 M1チャート精度 を重視し、 M5およびM15のマルチタイムフレーム確認 に対応、リアルタイムで 正確な売買シグナル を明確に提供します。 Scalper Proの主な特徴: XAUUSDスキャルピング最適化: ゴールドスキャルピングに特化した精密なエントリータイミング。 EURUSD & JPY対応: USDJPY、EURJPY、GBPJPYなど主要通貨ペアの市場変化を即検知。 マーケット構造ブレイク検出: 主要サポート/レジスタンスのブレイクを自動識別。 出来高スパイク確認: 注文フローの急増を検出し、シグナル精度を向上。 マルチ
This indicator shows external bars ("Aussenstäbe") in the chart in candle form. The colors of the candles can be set individually. Also different colors for bearish and bullish bars are possible. In addition, the color of the wicks or outlines is also adjustable. Outside bars are mentioned e.g. by Michael Voigt in the book "Das große Buch der Markttechnik". All other candles are inner bars.
MTF Levels And Moving Averages is a professional indicator designed to identify key support and resistance levels across multiple timeframes. The tool helps traders locate precise entry and exit points by analyzing market structure and price action patterns. Key Features The indicator provides multi-timeframe analysis covering H1, H4, D1, and W1 periods simultaneously. It identifies supply and demand zones where price typically reacts, using color-coded visualization to distinguish between dif
Intrade Sentinel BOS Assistant – スマート市場構造エンジン 精密な構造認識。自動化されたBOSロジック。 Intrade Sentinel BOS Assistant は MetaTrader 5 向けの強力なEAです。 S&P 500(US500 / SPX500) に特化して設計され、スマートマネーのロジックと統制されたリスク管理、そしてチャートパネルによる完全な手動制御を両立します。 全自動 および 半自動 の両方で運用可能。 構造ブレイク(BOS)を自動検出し、確認済みのインパルスにのみ反応します。マーチンゲールや危険なナンピンは一切使用しません。 主な機能 BOS(構造ブレイク)のリアルタイム検出 統合パネルによる全自動/半自動トレード 全ブローカー対応プロファイル(AUTO / SET_01 / SET_0.01 / DIRECT) S&P 500に最適化。制限なく DIRECT で全銘柄に最適化可能 エクイティ段階ベースのロット管理 多段階ダイナミック・トレーリングストップ 口座全体を保護するエクイティSL/TP インタラクティブ・パネル(
Do Youe use Multi Epert Advisor? You need this Indicator ... TradeResultsByMagic Overview This indicator creates a detailed trading report in a separate window, displaying performance metrics for trades grouped by magic numbers across multiple symbols. It shows various metrics including deal counts, lot sizes, prices, profits, win rates, and exposure percentages. Key Features Tracks multiple magic numbers (up to 1024) Supports multiple symbols per magic number (up to 100 per magic) Displays cus
This advisor is designed to work with a trading platform and implements an automated strategy for opening and closing positions based on technical indicators. It analyzes the current price in relation to a Simple Moving Average (SMA) over a specified period and uses the Average True Range (ATR) to determine potential stop-loss levels. The advisor aims to take action when the price deviates from the mean, applying user-defined input parameters such as lot size, stop-loss and take-profit levels, a
FULL FOREX MARKET VIEW ダッシュボードインジケーター MT5 これは、トレーダーに市場の全体像を提供するためにMT5プラットフォーム用に作成されたカスタムインジケーターです。リアルタイムデータを使用して市場を分析し、成功するために必要なすべての情報を表示します。 インストール方法: このインジケーターをチャートに適用する前に、MT5の「気配値表示」パネルで、不要または取引しない通貨ペアを非表示にし、必要なものだけを残してください。理由は、FFMVダッシュボードはMT5の「気配値表示」にあるすべての通貨ペアを表示するためです。最大で26ペアまで表示可能です。それ以上あると、FFMVダッシュボードのフォントや画像がぼやけ、崩れてしまいます!正しく表示されません。 使用目的: 単独取引用 バスケット取引用(スクリーンショット参照) 複数注文取引にも使用可能 自分の取引システムからのシグナルの確認 構成要素: 時間足: M1からMN1までの現在のローソク足の状態(買い/売り) トレンド: 通貨の全体的な傾向 インパクト: 通貨の動きの強さ/ボラティリティ(以下参照) Bu
KIOBI VISION KIOBI VISION is a multi-factor analysis indicator designed for professional traders who want a clear and structured view of the market across multiple time frames. Objective The indicator offers a unique summary table that combines several technical tools (RSI, MACD, Stochastics, Vortex, Momentum, PSAR, DMI, MFI, Fisher, and general trend) to provide reliable and quick-to-interpret buy and sell signals. Key Features Multi-timeframe analysis (M1 → MN): a consolidated view of the
VWAP (Volume Weighted Average Price) indicator with ±1σ and ±2σ bands calculated from real traded volume. The start and end times of the session are fully configurable, as well as the standard deviation levels and the number of bands displayed. It shows the day’s volume-weighted average price and helps traders identify value areas, price extremes, and intraday trading opportunities with precision.
FREE
Session Momentum Dashboard – 未来型トレーディング分析ツール アジア/ロンドン/ニューヨークの主要3セッションを分析し、Kill Zone検出、アジアレンジブレイクアウト、モメンタムスコアをリアルタイムで表示するプロフェッショナルダッシュボード。 Session Momentum Dashboard ICT/Smart Money トレーダー向けのオールインワン市場セッション監視ツール。 主な機能: 主要3セッション分析 アジア、ロンドン、ニューヨークセッションのリアルタイムステータス。 Kill Zone検出 ロンドン Kill Zone(7:00–9:00) ニューヨーク Kill Zone(12:00–14:00) 自動アラート付き。 アジアレンジブレイクアウト アジアレンジのグラフィカル表示 上方向/下方向のブレイクアウト検出 モメンタムスコアリング セッションごとのRSIベースのプログレスバー 出来高分析 出来高 vs 平均の比率 分類: LOW / NORMAL / HIGH トレードシグナル 以下が揃ったときに強力なシグナル: Kill Zon
Smart FVG Levels Indicator for MT5   Category   Platform Level   Type     Time frames   trader style market   ICT SMC Indicator Meta Trader 5 Level Indicator Level Indicator All Time frames Scalpers  Day Traders  Swing Traders  Position Traders All Type of Markets Introduction The Smart FVG Levels Indicator for MT5 is a powerful trading tool designed to help you identify Fair Value Gaps (FVGs) automatically on your charts. Whether you are a beginner or an experienced trader, this ind
Vision AGI
Franck Martin
4.78 (9)
Vision AGI is the result of over a year of development to create this expert. Equipped with an advanced algorithm and a combination of personalized indicators, this new version is even more powerful, making it one of the most complete robots of its generation. With its intelligent real-time technology and trading strategy inspired by the best traders, it offers reliable long-term trading and knows how to adapt to the situations it encounters over time. *** Compatible with Prop Firm ***   (see b
HTF Candle Plus Timer Upgrade your trading experience with HTF Candle Plus Timer, a smart indicator that displays higher timeframe candles directly on your current chart. It allows you to stay aligned with the bigger market picture while focusing on your preferred trading timeframe. Key Features: Higher Timeframe Candles Plot custom higher timeframe (HTF) candles such as H1, H4, D1, W1, or MN directly on lower timeframe charts for a clearer market overview. Current Candle Timer A live countdown
--- StudentK Sync Chart --- 1. Move charts at the same time 2. Cross check among different Symbols and Timeframes 3. Plan your own trading strategies --- Context --- StudentK is not indicated as a master or K Sir for knowledgeable person who claims for winning all the time. (But lots of traders should know the fact that it is rarely truth, especially in fluctuated period of time) StudentK is a group of years-experienced traders who want to share amazing tools in Free and Paid versions. Aiming
Hello! I am a professional trader with experience trading on the Forex and Moscow Exchange margin markets. Trading in total for about 14 years. For all the time of trading, I have gained tremendous knowledge, experience and understanding of the essence of the market. I want to tell you that for a beginner, the market seems like a place to make easy profits. But this is an illusion and a big mistake. The market changes all the time, volatility changes, trends are replaced by flats, and flats by t
Geek Engine EA is a professional-grade automated trading system that combines multiple proven technical analysis strategies with sophisticated risk management and performance tracking capabilities. Designed for both novice and experienced traders seeking consistent, rule-based trading execution. KEY FEATURES Multi-Strategy Trading System - MA Crossover Strategy with multi-timeframe confirmation - RSI Momentum Strategy with divergence detection - MACD Signal Strategy with histogram analysis -
Quant Fleet MT5 2.0 のご紹介 Quant Fleet は USDJPY(ドル円)にて動作し、5つの独立した戦略によって広範な分散を実現しています。前バージョンの Quant Fleet MT5 1.0 との違いは、パフォーマンスを補強する6つのサブ戦略が追加されている点です。 発売記念プロモーション: 最初の20本が販売された後、価格は引き上げられます。 公開グループ:  Join ドキュメントおよびプリセット:  click here シグナル:  click here 主な特長 簡単なインストール:数ステップで完了。アルゴリズムをUSDJPYチャートにドラッグして、セットファイルを読み込むだけです。 安全なリスク管理:マーチンゲールやグリッドなどのリスクの高い資金管理手法は一切使用していません。取引ごとのリスクは、口座残高に対する固定のパーセンテージで設定されています。 安定した成長:長期的な安定性を追求しており、ポートフォリオに追加するアルゴリズムとして最適です。 prop firm にも対応:日次ドローダウンが低く、過去の最大ド
Haven HTF Candle — あなたのチャートに上位足のパワーを Haven HTF Candle のご紹介 — 上位足(HTF)のローソク足をメインチャートに直接表示する強力なツールです。ウィンドウを常に切り替えるのをやめ、真の市場コンテキストを把握し始めましょう。これは、十分な情報に基づいた取引決定を下すための基盤となります。 その他の製品 -> こちら 。 主な機能と「Power of 3」コンセプト 「Power of 3」(AMD)コンセプトに基づく分析: インジケーターは HTFローソク足の始値 を明確に表示します。これはこの戦略の重要なレベルです。下位足にいながら、アキュムレーション(Accumulation)、マニピュレーション(Manipulation, Judas Swing)、ディストリビューション(Distribution)の各フェーズを簡単に特定できます。 トレンドの即時評価: 現在のタイムフレームでの動きが、より大きな全体像の中で推進波なのか調整波なのかを素早く理解できます。 視覚的な利便性: HTFローソク足の位置、色、数を完全にカスタマイズして
FREE
Automatically detect bullish or bearish order blocks to optimize your trade entries with our powerful indicator. Ideal for traders following ICT (The Inner Circle Trader). Works with any asset type, including cryptocurrencies, stocks, and forex. Displays order blocks on multiple timeframes, from M2 to W1. Alerts you when an order block is detected, migrated, or a higher timeframe order block is created/migrated. Perfect for both scalping and swing trading. Enhanced by strong VSA (Volume Spread A
E2C Lines
Eduardo Cristian De Carvalho
Descubra o poder do nosso indicador de alta precisão, projetado para identificar as regiões de alvo e exaustão de qualquer ativo. Testado e validado por mais de 3 anos nos mercados de mini dólar e mini índice, ele oferece confiabilidade e eficácia incomparáveis. Transforme sua estratégia de trading e alcance novos patamares de sucesso com nossa ferramenta inovadora.
The ONLY RSI Indicator You'll Ever Need - Works with ANY Broker, ANY Symbol! Finally, an RSI indicator that automatically adapts to YOUR broker's symbol naming conventions!   Whether you trade Forex, Gold, Bitcoin, or Stock Indices - this universal indicator detects and monitors related symbols automatically. KEY FEATURES & BENEFITS UNIVERSAL COMPATIBILITY Auto-Detects Broker Patterns : Works with ANY broker suffix (.m, .pro, .raw, etc.) All Asset Classes : Forex, Metals (Gold/Silver), Crypto,
FREE
Smart Exit Manager PRO Professional Version - Unlimited live trading on all pairs and timeframes. Try the FREE Version on demo accounts before upgrading to PRO. Overview Smart Exit Manager PRO automatically calculates the exact price level where closing all your positions will achieve your target profit. The target line updates in real-time as you open or close trades, accounting for broker commissions and providing a precise exit point visible on your chart. Perfect for traders managing mul
G Channels – Efficient Adaptive Channel Indicator Introduction Channel indicators are widely used in technical analysis, offering valuable insights into price movements, trend identification, and volatility. Most channel-based indicators, such as Bollinger Bands and Keltner Channels, rely on a central tendency estimator (e.g., a moving average) combined with a volatility component to define upper and lower bands. The G Channels indicator takes this concept further by leveraging a highly efficie
VIX Momentum Pro EA - 製品説明 概要 VIX Momentum Pro は、VIX75合成指数専用に設計された高度なアルゴリズム取引システムです。このアルゴリズムは、合成ボラティリティ市場において高確率の取引機会を特定するために、独自のモメンタム検出技術と組み合わせた先進的なマルチタイムフレーム分析を採用しています。 取引戦略 エキスパートアドバイザーは、複数のタイムフレームにわたって価格動向を分析する包括的なモメンタムベースのアプローチで動作します。システムは、VIX75の特性に特有の価格パターンの数学的分析を通じて方向性モメンタムを識別します。エントリーシグナルは、モメンタムの収束、ボラティリティ閾値、方向性バイアス確認など、複数の技術的条件が一致したときに生成されます。 この戦略は従来のインディケーターへの依存を避け、代わりに合成指数の動作に特化して校正された独自の数学モデルに依存しています。このアプローチにより、アルゴリズムは合成市場の独特な24時間年中無休の取引環境で効果的に動作できます。 リスク管理 VIX Momentum Pro は、利益ポテンシ
Wave Seeker
Gilbert Angoya Musakala
CAUTION: Wave Seeker operates optimally only on live market data. Due to its highly advanced integration with real-time APIs and AI-driven logic, traditional strategy testing may not accurately represent its real-world functionality or results. Introducing Wave Seeker — The Pinnacle of Intelligent Market Insight Step into a new frontier of trading innovation with Wave Seeker , a groundbreaking expert advisor engineered with precision, driven by deep-market understanding, and tailored for serious
ベータ指数、またはベータインジケーターは、ヘッジ機関の参考指標の一つです。 これは、通貨や商品などの個別資産の相対的なリスクを市場ポートフォリオ、通貨クロス、米ドル指数、株価指数と比較して測定するのに役立ちます。資産が市場基準と比較してどのように動くかを理解することで、投資リスクについてより明確な理解を得ることができます。 主な特徴: 正確なリスク評価:ベータ指数は、資産のリスクを市場全体と比較して正確に評価し、情報を元に投資判断を行うのに役立ちます。 分散戦略:この指数を活用して、さまざまな資産カテゴリーを横断して投資ポートフォリオを最適化し、分散戦略の機会を探ることができます。 マルチ通貨ヘッジに適しています:マルチ通貨ヘッジに参加する投資家は、この指数を重要な参考指標として考慮できます。 リアルタイムの洞察:タイムリーな意思決定のためにリアルタイムのデータ分析を利用できます。 ベータ指数を取引ツールに組み込むことで、データとリスク分析の力を活用できます。より賢明な選択をして、ポートフォリオの無駄なリスクを軽減しましょう。 β = 1:βが1と等しい場合、資産の価格変動は市場全体と
Z-Score Correlation(Zスコア相関) は、 強力なツール であり、統計学と市場分析を組み合わせて、 アービトラージ と トレンド取引 の両方において明確なシグナルを提供します。 機能: 2つの資産間の ダイナミックな相関関係 を測定します(例:EURUSD × GBPUSD)。 Zスコア を適用して、統計的基準を超える偏差を検出します。 資産が過度に乖離している場合に アービトラージのチャンス を特定します。 2つのペア間の Zスコアのクロス によって トレンドシグナル を生成します。 メリット: 統計的な反転 と トレンドの確認 の両方に対応。 市場の 本当の強さ を捉えるのに役立ちます。 FX、株価指数、金、暗号資産、B3 などに適用可能。 スキャルパー、デイトレーダー、スイングトレーダー、ペアトレード戦略 に最適。 理想的なユーザー: 統計的アービトラージ を狙うトレーダー。 Zスコアのクロス によって確認されたトレンド取引。 エントリーとエグジットの精度 を高めたい人。 このように取引できると想像してください: 相関関係が
算術平均または中央値を使用して、時系列の中心的な傾向の尺度を決定できます。どちらの方法にもいくつかの欠点があります。算術平均は、単純移動平均インジケーターによって計算されます。エミッションやノイズに敏感です。中央値はより安定して動作しますが、間隔の境界で情報が失われます。 これらの欠点を減らすために、疑似メディアン信号フィルタリングを使用できます。これを行うには、短い長さの中央値を取得し、調査中の財務時系列の期間のすべての値に再帰的に適用します。このアプローチのおかげで、インディケータを使用すると、定期的およびトレンドの価格変動をより正確に識別できます。 インジケーターの外部パラメーター: インジケーターを開始するとき、[パラメーター]タブで、計算に使用される価格定数を選択します(デフォルトでは閉じる)。 iPeriod-インジケーター期間。このパラメーターの値が高いほど、最新の価格変動に対するインジケーターの感度が低くなります。このパラメーターの最小値は3です。 MaxBars-計算の履歴の深さを制限します。インジケーターの起動に時間がかかる場合に便利です。 MaxBars = 0
[Power Volume Candle] - Indicator to see the comparison of bullish and bearish volume Volume comparison indicator on candlestick, by calculating the volume value of the specified candle history to determine the percentage of volume strength. calculates the percentage comparison of each time frame displayed on 1 screen. Subscribe the  MQL5 channel   for other interesting information :  (Automatic) Forex Tools Join new Public Group to Expressing Opinions and Sharing:  Auto Fx Investment See other
FREE
このプロダクトを購入した人は以下も購入しています
このインジケーターを購入すると、プロ仕様のトレードマネージャーを無料で差し上げます。 まず第一に、このトレーディングシステムがノンリペイント、ノンリドロー、ノンラグのインジケーターであることを強調する価値がある。これにより、手動取引とロボット取引の両方に理想的なものになっています。 オンラインコース、マニュアル、プリセットのダウンロード。 「スマートトレンドトレーディングシステム MT5」は、新規および経験豊富なトレーダー向けにカスタマイズされた包括的なトレーディングソリューションです。10以上のプレミアムインジケーターを組み合わせ、7つ以上の堅実なトレーディング戦略を備えており、多様な市場状況に対応する多目的な選択肢となっています。 トレンドフォロー戦略:トレンドを効果的に乗り越えるための正確なエントリーとストップロス管理を提供します。 リバーサル戦略:潜在的なトレンドの反転を特定し、トレーダーがレンジ相場を活用できるようにします。 スキャルピング戦略:高速で正確なデイトレードおよび短期取引のために設計されています。 安定性:すべてのインジケーターはノンリペイント、ノンリドロー、ノ
このインジケーターを購入された方には、以下の特典を 無料 で提供しています: 各トレードを自動で管理し、ストップロスとテイクプロフィットを設定し、戦略ルールに基づいてポジションを決済する補助ツール 「Bomber Utility」 様々な銘柄に合わせたインジケーターの設定ファイル(セットファイル) 「最小リスク」、「バランスリスク」、「待機戦略」 の3つのモードで使用できる Bomber Utility 用の設定ファイル このトレーディング戦略をすぐに導入・設定・開始できる ステップバイステップのビデオマニュアル ご注意: 上記の特典を受け取るには、MQL5のプライベートメッセージシステムを通じて販売者にご連絡ください。 オリジナルのカスタムインジケーター 「Divergence Bomber(ダイバージェンス・ボンバー)」 をご紹介します。これは、MACDのダイバージェンス(乖離)戦略に基づいた 「オールインワン」型のトレーディングシステム です。 このテクニカルインジケーターの主な目的は、価格とMACDインジケーターの間に発生するダイバージェンスを検出 し、将来の価格の動きを示す
Entry In The Zone and SMC Multi Timeframe は、Smart Money Concepts(SMC)に基づいて開発された リアルタイム市場分析ツール です。 本システムは、トレーダーがマーケットストラクチャーを体系的に分析し、市場全体の方向性をより明確に把握できるよう設計されています。 システムは複数の時間軸にわたり、 反転ポイント(Reversal Points)・主要ゾーン(Key Zones)・マーケットストラクチャー を自動的に解析します。さらに、 POI(Point of Interest)・ノーリペイントシグナル・Auto Fibonacci Levels を表示し、プルバックや反転ポイントを高精度で検出します。 リアルタイムシグナルとアラートにより、価格が主要ゾーンに到達したときや、ゾーン内で反転シグナルが発生した際に、重要な機会を逃すことはありません。 また、本システムは インジケーター と シグナルシステム の両方の機能を兼ね備えた 2-in-1ツール であり、ゾーン分析とリアルタイムエントリーシグナルを一体化しています。 さらに
まず第一に、この取引インジケーターは再描画されず、再描画されず、遅延しないことを強調する価値があります。これにより、手動取引とロボット取引の両方に理想的なものになります。 ユーザーマニュアル:設定、入力、戦略。 アトミックアナリストは、価格の強さとモメンタムを利用して市場でより良いエッジを見つけるためのPA価格アクションインジケーターです。ノイズや誤ったシグナルを除去し、取引ポテンシャルを高めるための高度なフィルターを備えています。複雑なインジケーターの複数のレイヤーを使用して、アトミックアナリストはチャートをスキャンし、複雑な数学的計算をシンプルなシグナルと色に変換します。これにより、どのような初心者トレーダーでも理解して使用し、一貫した取引の決定を行うことができます。 「アトミックアナリスト」は、新規および経験豊富なトレーダー向けにカスタマイズされた包括的な取引ソリューションです。プレミアムインジケーターとトップノッチの機能を1つの取引戦略に組み合わせ、すべてのタイプのトレーダーにとって汎用性のある選択肢にします。 デイリートレーディングとスキャルピング戦略:高速で正確なデイ
Azimuth Pro
Ottaviano De Cicco
5 (1)
発売プロモーション Azimuth Proは先着100名様限定で 299ドル でご提供します。最終価格は 499ドル となります。 リテールとインスティテューショナルのエントリーの違いはインジケーターではなく、ロケーションにあります。 多くのトレーダーは、モメンタムを追いかけたり、遅行シグナルに反応して、任意の価格レベルでエントリーします。機関投資家は、需給が実際にシフトする構造的なレベルに価格が到達するのを待ちます。 Azimuth Proはこれらのレベルを自動的にマッピングします:スイングアンカーVWAP、マルチタイムフレーム構造ライン、高確率ロケーションにのみ出現するABCパターン。 Azimuth Proは、構造分析とインテリジェントな自動化の両方を求めるプロフェッショナルトレーダー向けに構築されています。 Azimuthが外科的精度で市場構造をマッピングする一方、Azimuth Proはインテリジェンスレイヤーを追加します:トレーディングスタイルの自動検出、スマート設定された移動平均線、20年のデータでバックテストされた最適化パラメータ。その結果、お使いの銘柄と
Gold Sniper Scalper Proは、MetaTrader 5向けのプロフェッショナルなindicatorで、トレーダーがエントリーポイントを特定し、リスクを効果的に管理するために設計されています。 このindicatorは、シグナル検出システム、Entry/SL/TPの自動管理、ボリューム分析、リアルタイムパフォーマンス統計を含む包括的な分析ツールセットを提供します。 システムを理解するためのユーザーガイド   |   他の言語のユーザーガイド 主な機能 シグナル検出システム このindicatorは、price actionと市場構造の分析に基づいて潜在的なエントリーポイントを自動検出します。トレード機会を検出すると: - BUY(青)またはSELL(赤)の矢印がchart上に表示されます - ローソク足が色付けされ、シグナルゾーンが識別されます - Entry/SL/TPレベルが自動計算されます シグナルは価格がEntryレベルに触れた時のみ発動し、市場に確認されていないシグナルをフィルタリングします。 インテリジェントなEntry/SL/TP管理 - Ent
FX Power: 通貨の強弱を分析して、より賢い取引を実現 概要 FX Power は主要通貨と金の実際の強弱をあらゆる市場状況で理解するための必須ツールです。強い通貨を買い、弱い通貨を売ることで、 FX Power は取引の意思決定を簡素化し、高い確率の取引機会を見出します。トレンドを追従する場合でも、極端なデルタ値を使用して反転を予測する場合でも、このツールはあなたの取引スタイルに完全に適応します。ただ取引するだけではなく、 FX Power で賢く取引をしましょう。 1. なぜ FX Power がトレーダーにとって非常に有益なのか 通貨と金のリアルタイム強弱分析 • FX Power は主要通貨と金の相対的な強弱を計算し、マーケットダイナミクスに関する明確な洞察を提供します。 • どの資産がリードしているか、または後れを取っているかを監視して、取引するペアを賢く選びましょう。 マルチタイムフレームの包括的なビュー • 短期、中期、長期のタイムフレームで通貨と金の強弱を追跡し、マーケットトレンドに基づいて取引戦略を調整できます。 • スキャルピングからスイングトレード
Trend Ai indicatorは、トレンドの識別と実用的なエントリポイントと反転アラートを組み合わせることで、トレーダーの市場分析を強化する優れたツールです。 この指標は、ユーザーが自信と正確さで外国為替市場の複雑さをナビゲートすることを可能にします トレンドAiインジケーターは、主要なシグナル以外にも、プルバックやリトレースメント中に発生するセカンダリエントリポイントを識別し、トレーダーが確立されたトレンド内の価格修正を活用できるようにします。 重要な利点: *MT4およびMT5の仕事 *明確な買いまたは売りシグナル *再描画しません ·すべての資産で動作します 私はeaやセットをtelegram it詐欺で販売しないように注意してください。 すべての設定はここでブログで無料です。  重要! 指示とボーナスを得るために購入後すぐに私に連絡してください! 私の他のプロダクトと同様、実質操作の監視はここに見つけることができます: https://www.mql5.com/en/users/mechanic/seller&nbsp ; 設定および入力: すべての
Berma Bands
Muhammad Elbermawi
5 (7)
Berma Bands (BBs) インジケーターは、市場のトレンドを特定して活用したいトレーダーにとって貴重なツールです。価格と BBs の関係を分析することで、トレーダーは市場がトレンド段階にあるか、レンジ段階にあるかを判断できます。 詳細については、[ Berma Home Blog ] をご覧ください。 バーマ バンドは、上部バーマ バンド、中部バーマ バンド、下部バーマ バンドの 3 つの異なる線で構成されています。これらの線は価格の周りにプロットされ、全体的な傾向に対する価格の動きを視覚的に表します。これらのバンド間の距離から、ボラティリティや潜在的な傾向の反転についての洞察を得ることができます。 バーマ バンドの線がそれぞれ離れると、市場が横ばいまたはレンジ相場の期間に入っていることを示すことがよくあります。これは、明確な方向性の偏りがないことを示しています。トレーダーは、これらの期間中にトレンドを特定するのが難しいと感じる可能性があり、より明確なトレンドが出現するまで待つ場合があります。 バーマ バンドの線が 1 本の線に収束すると、強いトレンド環境の兆候となること
Quantum TrendPulse を ご紹介します。これは、   SuperTrend   、   RSI   、および Stochastic のパワーを 1 つの包括的なインジケーターに組み合わせて、取引の可能性を最大限に引き出す究極の取引ツールです。精度と効率を求めるトレーダー向けに設計されたこのインジケーターは、市場のトレンド、勢いの変化、最適なエントリー ポイントとエグジット ポイントを自信を持って特定するのに役立ちます。 主な特徴: SuperTrend 統合: 現在の市場動向に簡単に追従し、収益性の波に乗ることができます。 RSI精度: 買われすぎと売られすぎのレベルを検出し、市場の反転のタイミングに最適で、SuperTrendのフィルターとして使用されます。 確率的精度: 確率的振動を活用して、変動の激しい市場で隠れたチャンスを見つけます。SuperTrend のフィルターとして使用されます。 マルチタイムフレーム分析:   M5 から H1 または H4 まで、さまざまなタイムフレームで市場を常に把握します。 カスタマイズ可能なアラート: カスタム取引条件が満たされ
優れたテクニカルインジケーター「Grabber」をご紹介します。これは、すぐに使える「オールインワン」トレーディング戦略として機能します。 ひとつのコードに、市場のテクニカル分析ツール、取引シグナル(矢印)、アラート機能、プッシュ通知が強力に統合されています。 このインジケーターを購入された方には、以下の特典を無料で提供します: Grabberユーティリティ:オープンポジションを自動で管理するツール ステップバイステップのビデオマニュアル:インジケーターのインストール、設定、取引方法を解説 カスタムセットファイル:インジケーターをすばやく自動設定し、最大限の成果を出すための設定ファイル 他の戦略はもう忘れてください!Grabberだけが、あなたを新たなトレードの高みへと導いてくれるのです。 Grabber戦略の主な特徴: 推奨タイムフレーム:M5〜H4 対応通貨ペア・資産:どれでも使用可能ですが、私が実際に検証した以下を推奨します(GBPUSD、GBPCAD、GBPCHF、AUDCAD、AUDUSD、AUDSGD、AUDCHF、NZDUSD、NZDCAD、EURCAD、EURUSD、E
サポート線と抵抗線のプロットにうんざりしていませんか? サポートレジスタンス は、非常に興味深いひねりを加えてチャート内のサポートとレジスタンスラインを自動検出およびプロットするマルチタイムフレームインジケーターです。価格レベルは時間とともにテストされ、その重要性が高まるにつれて、ラインは太くなり、暗くなります。 [ インストールガイド | 更新ガイド | トラブルシューティング | よくある質問 | すべての製品 ] 一晩でテクニカル分析を強化 チャートを閲覧せずに重要な価格レベルを検出 一目ですべての価格レベルの相対的な強さを認識する すべての取引で最大30時間のプロットラインを節約 インジケーターは、すべての価格レベルの年齢を表示します インジケーターは再描画されていません 過去および現在の価格レベルは近接によって崩壊し、現在の市場行動に合わせて調整されます。動作は、必ずしもピークではない場所に線が引かれます。 価格レベルは、時間とともに拒否されるにつれて、より暗く、より広くなります ノイズを避けるために、重要でない価格レベルは定期的にクリアされます カスタマイズ可能な時間枠の
TrendLine PRO MT5
Evgenii Aksenov
4.67 (33)
The Trend Line PRO indicator is an independent trading strategy. It shows the trend change, the entry point to the transaction, as well as automatically calculates three levels of Take Profit and Stop Loss protection. Trend Line PRO is perfect for all Meta Trader symbols: currencies, metals, cryptocurrencies, stocks and indices. The indicator is used in trading on real accounts, which confirms the reliability of the strategy. Robots using   Trend Line PRO   and real Signals can be found here: 
ARIPoint
Temirlan Kdyrkhan
1 (1)
ARIPoint is a powerful trading companion designed to generate high-probability entry signals with dynamic TP/SL/DP levels based on volatility. Built-in performance tracking shows win/loss stats, PP1/PP2 hits, and success rates all updated live. Key Features: Buy/Sell signals with adaptive volatility bands Real-time TP/SL/DP levels based on ATR Built-in MA Filter with optional ATR/StdDev volatility Performance stats panel (Success, Profit/Loss, PP1/PP2) Alerts via popup, sound, push, or email Cu
これまでに、 素晴らしいバックテスト結果、 驚くべき数値を持つ ライブ口座のパフォーマンス証明 、そして あらゆる場所での統計情報 がある取引インジケーターを購入し、しかし使用後に 口座を破綻させてしまった ことは何度ありますか? シグナル単独を信用すべきではありません。そもそもなぜそれが表示されたのかを知る必要があります。そして、それこそがRelicusRoad Proの得意とすることです! ユーザーマニュアル + 戦略 + トレーニングビデオ + VIPアクセス付きプライベートグループ + モバイル版利用可能 市場の見方を変える新しい方法 RelicusRoadは、FX、先物、仮想通貨、株式、指数に対応する、 世界で最も強力で最高の取引インジケーター であり、トレーダーが口座を 成長させる ために必要なすべての情報とツールを提供します。 初心者 から 上級者 まで、 すべてのトレーダー が成功できるよう、 テクニカル分析 と 取引計画 を提供します。 これは、将来の市場を 予測する のに十分な情報を提供する 主要な取引インジケーター です。私たちは、チャート上で意味をなさない複
Gartley Hunter Multi - An indicator for searching for harmonic patterns simultaneously on dozens of trading instruments and on all possible timeframes. Manual (Be sure to read before purchasing) | Version for MT4 Advantages 1. Patterns: Gartley, Butterfly, Shark, Crab. Bat, Alternate Bat, Deep Crab, Cypher 2. Simultaneous search for patterns on dozens of trading instruments and on all possible timeframes 3. Search for patterns of all possible sizes. From the smallest to the largest 4. All fou
Weis Wave with Alert MT5
Trade The Volume Waves Single Member P.C.
4.94 (17)
Rental/Lifetime Package Options and Privileges  Rent Monthly Six Months   Yearly/Lifetime Weis Wave with Speed with Alert+Speed Index x x x Manual  x x x Quick Set up Video x x x Blog x x x Lifetime Updates x x x Setup and Training Material x x Discord Access Channel "The SI traders"          x Rectangle Break Alert Tool      x How to trade with it:    http://www.tradethevolumewaves.com   ** If you purchase please contact me to setup your  : Training Room and  complete manual access.  Wei
WARNING: This indicator is distributed EXCLUSIVELY on MQL5.com MT4 version:   https://www.mql5.com/it/market/product/160363 MT5 version:   https://www.mql5.com/it/market/product/160410 ============================================================================================= MAX RIBBON ver 1.00 The indicator that shows you the TREND clearly and unambiguously! ============================================================================================= DESCRIPTION MAX RIBBON is an advanced tre
次世代の自動化された需要と供給のゾーン。どのチャートでも機能する新しい革新的なアルゴリズム。すべてのゾーンは、市場の価格行動に従って動的に作成されています。 2種類のアラート --> 1) 価格がゾーンに達したとき 2) 新しいゾーンが形成されたとき もう 1 つの役に立たない指標はありません。実績のある完全な取引戦略を手に入れることができます。     新機能:     価格が需給ゾーンに達したときにアラートを出す     新しい需給ゾーンが作成されたときにアラートを発します     プッシュ通知アラート     ピップ単位のゾーン幅ラベル     MTF のもう 1 つのタイムフレーム。したがって、現在より 2 時間足高いのではなく、現在より 3 時間足し上に見えるようになります。     アラート/ゾーン/MTF 機能を有効/無効にするボタン あなたが得る利点:     取引から感情を取り除きます。     取引エントリをオブジェクト化します。     確率の高いセットアップで利益を上げましょう。     描画ゾーンから時間を節約します。
ACB Breakout Arrows MT5
KEENBASE SOFTWARE SOLUTIONS
5 (1)
ACB Breakout Arrows インジケーターは、特別なブレイクアウトパターンを検出することで、市場における重要なエントリーシグナルを提供します。このインジケーターはチャートを常に監視し、一方向に勢いが定着してきた段階で、主要な値動きの直前に精度の高いエントリーシグナルを表示します。 マルチシンボル・マルチタイムフレームスキャナーはこちらから - ACB Breakout Arrows MT5 用スキャナー 主な機能 ストップロスとテイクプロフィットの水準が自動で表示されます。 すべての時間足のブレイクアウトシグナルを監視できるMTFスキャナーダッシュボードを搭載。 デイトレーダー、スイングトレーダー、スキャルパーに最適。 シグナル精度を高めるための最適化されたアルゴリズム。 損益分岐点やスキャルピングターゲットに使える特別なライン(クイックプロフィットライン)。 勝率、平均利益などのパフォーマンス分析メトリクスを表示。 リペイントなし。 トレードの確認 - 低確率のトレードを除外するために ACB Trade Filter インジケーター を使用してください。 強い買い:
The Trend Forecaster indicator utilizes a unique proprietary algorithm to determine entry points for a breakout trading strategy. The indicator identifies price clusters, analyzes price movement near levels, and provides a signal when the price breaks through a level. The Trend Forecaster indicator is suitable for all financial assets, including currencies (Forex), metals, stocks, indices, and cryptocurrencies. You can also adjust the indicator to work on any time frames, although it is recommen
TREND FLOW PRO TREND FLOW PRO は、市場の方向を表示するリペイントなしのインジケーターです。トレンドの反転だけでなく、大口市場参加者の初回および再エントリーを特定します。チャート上の BOS マークは、実際のトレンド転換と上位タイムフレームの重要なレベルを示します。データはリペイントされず、各バーの確定後もチャート上に残ります。 戦略例を含む詳細な PDF ガイド は、プライベートメッセージでリクエストして受け取ることができます。 インジケーターの主な要素: BOS FLOW ― トレンド波動と実際のトレンド転換。これは大口参加者のエントリーと、その存在の確認を示します(数字で表示)。 BOS FILL ― トレンド方向にローソク足を着色します。大口プレイヤーのエントリーポイントや、トレンドが変化するポイントを示します。 シグナルレベル: BOS ― 強さが未確定な参加者のエントリー(多くの場合、メイントレンド内の調整)。 Move SL ― 大口参加者がポジションをどのように移動させているかを視覚的に表示します。トレーダーはストップロス調整の参考として使用
SynaptixQuant Dominance Matrix: Institutional-Grade Market State Extraction Engineered for traders who require a data-driven view of market behaviour beyond surface-level indicators. The Synaptix Quant (SQ) Dominance Matrix is not a conventional currency strength display. Behind its intentionally streamlined interface runs a sophisticated analytical architecture designed to quantify market conditions with precision. Every output is generated through layered signal processing built to identify d
Elliott Wave Trend was designed for the scientific wave counting. This tool focuses to get rid of the vagueness of the classic Elliott Wave Counting using the guideline from the template and pattern approach. In doing so, firstly Elliott Wave Trend offers the template for your wave counting. Secondly, it offers Wave Structural Score to assist to identify accurate wave formation. It offers both impulse wave Structural Score and corrective wave Structure Score. Structural Score is the rating to sh
これはほぼ間違いなく、MetaTraderプラットフォームで見つけることができる最も完全な調和価格形成自動認識インジケーターです。 19種類のパターンを検出し、フィボナッチプロジェクションをあなたと同じように真剣に受け止め、潜在的逆転ゾーン(PRZ)を表示し、適切なストップロスとテイクプロフィットレベルを見つけます。 [ インストールガイド | 更新ガイド | トラブルシューティング | よくある質問 | すべての製品 ] 19の異なる調和価格形成を検出します プライマリ、派生および補完フィボナッチ投影(PRZ)をプロットします 過去の価格行動を評価し、過去のすべてのパターンを表示します この指標は、独自の品質とパフォーマンスを分析します 適切なストップロスとテイクプロフィットのレベルを表示します ブレイクアウトを使用して適切な取引を通知します すべてのパターン比をグラフにプロットします 電子メール/音声/視覚アラートを実装します スコット・M・カーニーの本に着想を得て、この指標は最も純粋で急を要するトレーダーのニーズを満たすように設計されています。ただし、トレードを容易にする
現在33%オフ 初心者にもエキスパートトレーダーにも最適なソリューション このインジケーターは独自の機能と新しい公式を多数内蔵しており、ユニークで高品質かつ手頃な取引ツールです。このアップデートでは、2つの時間枠ゾーンを表示できるようになります。より長いTFだけでなく、チャートTFとより長いTF(ネストゾーンを表示)の両方を表示できます。すべてのSupply Demandトレーダーの皆さんのお気に召すはずです。:) 重要情報の公開 Advanced Supply Demandの可能性を最大化するには、 https://www.mql5.com/ja/blogs/post/720245 にアクセスしてください。   エントリーまたはターゲットの正確なトリガーポイントを正確に特定できれば取引がどのように改善されるか想像してみてください。新しい基盤となるアルゴリズムに基づいて構築されているため、買い手と売り手の間の潜在的な不均衡をさらに簡単に特定できます。これは、最も強い需要と供給のゾーンと、過去のパフォーマンス(古いゾーンを表示)がグラフィカルに表現されるためです。これらの機能は、最適な
スイングトレーディング は、トレンドの方向のスイングと可能な反転スイングを検出するように設計された最初のインジケーターです。トレーディングの文献で広く説明されているベースラインスイングトレーディングアプローチを使用します。インディケータは、いくつかの価格と時間のベクトルを調査して、全体的なトレンドの方向を追跡し、市場が売られ過ぎまたは買われ過ぎて修正の準備ができている状況を検出します。 [ インストールガイド | 更新ガイド | トラブルシューティング | よくある質問 | すべての製品 ] むち打ちを起こさずに市場スイングの利益 インジケーターは常にトレンドの方向を表示します 色付きの価格帯は機会のベースラインを表します 色付きのダッシュは、可能な反転スイングを表します この指標は、独自の品質とパフォーマンスを分析します 複数時間枠のダッシュボードを実装します カスタマイズ可能なトレンドおよびスイング期間 電子メール/サウンド/プッシュアラートを実装します インジケータは再描画またはバックペインティングではありません Swing Tradingとは Swing Tradingは
FX Volume MT5
Daniel Stein
4.79 (24)
FX Volume:ブローカー視点で捉える本物の市場センチメント クイック概要 トレード手法をさらに高めたいとお考えですか? FX Volume は、リテールトレーダーやブローカーのポジション状況をリアルタイムで提供します。これは、COTのような遅延レポートよりもはるかに早く知ることができます。安定した利益を目指す方も、さらなる優位性を求める方も、 FX Volume は大きな不均衡を見極め、ブレイクアウトを確認し、リスク管理を洗練させるのに役立ちます。今すぐ始めて、実際の出来高データがどのように意思決定を変革するかを体感してください! 1. FX Volume がトレーダーにとって非常に有益な理由 高精度の早期警戒シグナル • 各通貨ペアを売買しているトレーダー数を、他者よりも早く、ほぼリアルタイムで把握できます。 • FX Volume は、複数のリテールブローカーから得られる本物の出来高データを収集し、分かりやすい形式で提供する 唯一 のツールです。 強力なリスク管理 • ロングやショートの大きな偏り(インバランス)を特定し、潜在的なトレンド転換を見逃しません。ストップ
Matrix Arrow Indicator MT5
Juvenille Emperor Limited
5 (18)
マトリックスアローインジケーターMT5は、すべてのシンボル/商品(外国為替、商品、暗号通貨、インデックス、株式)で使用できる100%再描画されていないマルチタイムフレームインジケーターに続くユニークな10in1トレンドです。マトリックスアローインジケーターMT5は、初期段階で現在のトレンドを判断し、最大10の標準インジケーターから情報とデータを収集します。 平均方向移動指数(ADX) 商品チャネルインデックス(CCI) クラシック平研アシキャンドル 移動平均 移動平均収束発散(MACD) 相対活力指数(RVI) 相対力指数(RSI) 放物線SAR ストキャスティクス ウィリアムズのパーセント範囲 すべてのインジケーターが有効な買いまたは売りシグナルを与えると、対応する矢印がチャートに印刷され、次のろうそく/バーの開始時に強い上昇トレンド/下降トレンドを示します。ユーザーは、使用するインジケーターを選択し、各インジケーターのパラメーターを個別に調整できます。マトリックスアローインジケーターMT5は選択されたインディケーターからのみ情報を収集し、それらのデータのみに基づいてアローを印刷
まず第一に、この取引ツールはノンリペイント、ノンリドロー、ノンラグの指標であり、プロの取引に理想的ですことを強調する価値があります。 オンラインコース、ユーザーマニュアル、デモ。 スマートプライスアクションコンセプトインジケーターは、新米から経験豊富なトレーダーまで、非常 に強力なツールです。Inner Circle Trader AnalysisやSmart Money Concepts Trading Strategiesなど、20以上の有用な指標を1つに組み合わせています。このインジケーターはスマートマネーコンセプトに焦点を当て、大手機関の取引方法を提供し、彼らの動きを予測するのに役立ちます。 特に、流動性分析に優れており、機関がどのように取引しているかを理解しやすくしています。市場のトレンドを予測し、価格の動きを慎重に分析するのに優れています。機関の戦略とトレードを合わせることで、市場の動向についてより正確な予測ができます。このインジケーターは多目的であり、市場構造を分析し、重要な注文ブロックを特定し、さまざまなパターンを認識するのに優れています。 このインジケーター
作者のその他のプロダクト
The indicator calculates the saturation levels of the price chart. A signal to exit the resale area is a buy signal. A signal to exit the overbought area is a sell signal. Usually, you need to set relative values ​​for the overbought and oversold levels of Bottom and Top - for this indicator. Most often, a good trend is visible on the price chart visually. But an experienced trader must clearly understand the current balance of power in the market before entering. And the indicator will help t
This indicator can track the steady price movement in a certain direction. In this case, the movement itself can be downward, upward or lateral, when the market movement does not have a pronounced focus. The indicator works on the basis of two moving average as well as an oscillator. Using the signal search algorithm, the indicator generates signals in the form of arrows. Benefits. Allows you to determine the current trend. You can quickly enough understand which particular trend is currently
Dolphin Bands indicator works equally well on any timeframes. For medium-duration trends, it is recommended to use the standard setting. To study long-term trends, it is recommended to use an indicator value greater than the standard. To analyze short-term trends, it is better to use a lower indicator value. Most often, an exponential method is used to calculate the indicator, but other varieties can also be used. Dolphin Bands is a collection of lines. The two center lines of the indicator ar
Martingals indicator works on all currency pairs and on all timeframes. The arrows indicate the optimal entry points for future Martingale averaging, even with a zero exponent. The indicator shows a signal to close the series only if all previous signals can be closed in profit. After closing a series in profit, you need to immediately open an order in the direction of the signal. Thus, the close signal is at the same time the reverse opening point to the other side of the new order. The probabi
Levels Market is one of the simplest, but no less effective tools from this. Pivot points can be built from these levels, levels are constructed as statistical significance at a given point in time. Trading by levels is a classic in the work of a trader. You can use them as a ready-made trading strategy or as an additional filter in your trading system. In the settings you can specify the offset for building levels. Interpretation of levels: Lines 8/8 and 0/8 (Final Resistance). These lines ar
Trend New Trend Indicator, shows the signals for entry. Displays both entry points and the trend itself. Shows statistically calculated moments for entering the market with arrows. When using the indicator, it is possible to optimally distribute the risk factor. Settings: Uses all one parameter for settings. Selecting a parameter, it is necessary to visually resemble it so that the appropriate graph has a projection of extremes. Options: Length - the number of bars for calculating the indica
Condors TMA  ( Triangular Moving Average ) is a channel indicator without redrawing, built on the basis of moving averages. The key difference between the Condor TMA indicator and other channel indicators (for example, from the same Bollinger indicator) is that Condor TMA takes into account not simple moving averages, but twice smoothed ones, which allows one to more clearly determine the market movement, and on the other hand makes the indicator less sensitive.
Cancer indicator is great for trend trading! An intelligent indicator algorithm with high probability shows the points of potential market reversal. If you are trading in a trend, then a trading strategy built on the basis of this indicator is perfect for you. The indicator filters out market noise, almost everything and all the necessary functions for working with a thread are built into one tool. It works on all currency pairs and on all timeframes, indicator setting - according to your desire
A very simple and convenient trend indicator based on price divergence. He showed himself well in scalping. Help in finding entry points for analysis. It can be used as a filter in trade. It has two parameters: Period and Level. The Level parameter helps to filter out excess signals. For example, for EURUSD, the Level parameter may be 0.0001. The indicator can work both for entry points and as a filter. The indicator reflects information in a visual form. We must not forget that the approach to
Calculated trend indicator, can be used with an optimal risk to profit ratio, shows successful signals. Uses two options for settings. Shows favorable moments for entering the market with arrows. The probability of a successful trend is not very bad! The indicator can be used both for pipsing on small periods, and for long-term trading. The indicator does not redraw and does not lag. It works on all currency pairs and on all timeframes.
XStrain
Vitalii Zakharuk
The XStrain expert system works on all types of accounts. It works both in 4 and 5-digit quotes. Spread and requotes are not critical, any broker is suitable. To optimize the expert system, one year is recommended for the period H1 or H4. Optimization can be carried out at opening prices, the results differ little from testing on real ticks, since the bot works at opening prices. It is enough to optimize once a month! To get better results, it is recommended to work on several different pairs.
An expert of a new type Formulas has been created - it works using sharp tick movements. The uniqueness of the expert is that it can be launched on any hour period, any currency pair, and on the server of any broker. What makes the expert attractive enough to use for trading. It is recommended to work on liquid forex pairs with a low spread. The lower the commission and spread, the greater the profit. You can start using it with $ 100 and a lot of 0.01. A small initial deposit also contributes
The Trend Distinctive indicator smoothes price fluctuations during signal formation by averaging the data. This gives the trader the opportunity to visually determine what trend will be present at a particular time interval. This is an auxiliary tool for technical analysis, which helps to determine the exact direction of the trend: either an upward or downward movement of the price of a trading instrument. Although the indicator is a little late, it still generates the most reliable signals th
Red Bot
Vitalii Zakharuk
The mechanism of work of the Red Bot Expert Advisor is designed so that before opening a transaction, they undergo instant implicit filtering, which, if there are competent and practical settings, allows the buyer to level the number of unprofitable and unproductive transactions. The adviser has a large number of internal regulators, software installations and special codes that help to safely and efficiently trade. This is a fully automated Expert Advisor, built on the scalping strategy, work
Introduced expert system   Stable Ex works with the EURUSD currency pair and only with it. This system implemented the principle of five orders - that is, a maximum of five orders can be placed in one direction, after which the total position of the series must be closed by stops, either real or virtual. The trading system is designed to work separately with a series of buy orders and separately with a series of sell orders. which makes the trading system versatile enough. The expert passes all
The presented expert system works with the GBPUSD currency pair and only with it. This system implemented the principle of seven orders - that is, a maximum of seven orders can be made in one direction, after which the total position of the series should be closed by stops, either real or virtual. The trading system is designed to work separately with a series of buy orders and separately with a series of sell orders. which makes the trading system versatile enough. The expert passes all types
Transition indicator can track a steady price movement in a certain direction. In this case, the movement itself can be downward, upward or sideways, when the market movement does not have a pronounced focus. The indicator works on the basis of two moving average as well as an oscillator. Using the signal search algorithm, the indicator generates signals in the form of arrows. Trading based on trend indicators is the simplest and often the most effective. If you correctly determine the beginni
Global Trend Indicator, shows the signals for entry. Displays both entry points and the trend itself. Shows statistically calculated moments for entering the market with arrows. When using the indicator, the risk factor can be optimally distributed. Settings: Uses all one parameter for settings. Choosing a parameter, it is necessary to visually resemble it so that the appropriate graph has a projection of extremes. Parameters: Length - the number of bars for calculating the indicator. Use
Trend DI is an auxiliary tool for technical analysis that helps determine the exact direction of a trend: either an upward or downward movement of the price of a trading instrument. Although the Trend DI indicator is a bit late, it still generates the most reliable signals that a trader can safely navigate. The Trend DI indicator smooths price fluctuations during signal formation by averaging data. This gives the trader the opportunity to visually determine which trend will be present in a par
The Trend ZVD Trend Indicator is important for identifying trends in financial markets. However, this indicator works equally well during consolidation periods. The Trend ZVD trend indicator indicates the direction in which the asset of your choice can move. The Trend ZVD trend indicator copes with the main task of trading: to find the entry point to the market at the time the trend is created and the exit point at the time it is completed. A trend in trade is the steady movement of quotes in
An indicator from the zigzag family with levels. First of all, I will point out arguments in favor of the advisability of using a level indicator. They give the trader the following benefits: Alternative points of view - the level indicator helps to look at the levels from the side, compare them with several automatic systems, identify errors; Saving time - reducing the cost of effort for self-building lines; Exact mathematical calculation - quick calculation of levels, ratios of indicators
The Progress Scalp strategy is based on tick trading principles. At its core, this strategy is fenders, that is, the trader receives signals for opening positions during pullbacks from the main movement. A distinctive feature of this strategy is that transactions are concluded only during periods of strong tick movements in the forex market. The Progress Scalp strategy was developed for trading with different currency pairs. You need to choose a currency pair with the lowest spreads and virtual
Long
Vitalii Zakharuk
The Long expert system works with the EURUSD currency pair and only with it. The trading system is designed to work separately with a series of buy orders and separately with a series of sell orders. which makes the trading system versatile enough. The expert passes all types of testing throughout the history for the specified currency pair. Also, the expert system is tested with various delay values, it works in fully automatic mode! No settings are needed, use only the default settings. Thi
The indicator is simple and clear, making the work of the trader as easy as possible and giving clear signals to enter the market. This indicator has two settings for the period. Which makes it more flexible. And at the same time, many false signals do not appear. The larger the period, the smoother the indicator itself will be. It can be used both independently and together with other indicators of technical analysis (including with oscillators), as well as with another same indicator (with
Индикатор отображает регнессионный канал с сопровождением каналов фактически создавая уровни поддержки и сопротивления. Уровни поддержки и сопротивления являются одним из важнейших элементов технического анализа. С этим утверждением согласится любой трейдер. Уровни в трейдинге используются непосредственно, открывая и закрывая ордера у границ диапазона, очерченного ими. Также уровни применяют баланс спроса и предложения в своих торговых стратегиях на различных временных интервалах. Визуальное
An expert of a new type Anniversary - works using sharp tick movements, the algorithm that was created earlier is significantly improved. The uniqueness of the expert is that it can be launched on any hour period, any currency pair, and on the server of any broker. What makes the expert attractive enough to use for trading. It is recommended to work on liquid forex pairs with a low spread. The lower the commission and spread, the greater the profit. You can start using it with $ 100 and a lot o
The Trends Signal indicator displays the direction of the trend with arrows, works in a simple and clear way. It uses a combination of reliable and simple indicators to analyze prices. The signals of the Trends Signal indicator can be interpreted as follows: buy when the bars are colored blue, and sell when they are red. An effective indicator with a wide range of three parameters for trading. Parameters: Length - The number of bars to calculate. LevelUP, LevelDN - Levels for determining overb
The Open Trend indicator calculates the saturation levels of the price chart. Most often, a good trend is visible on a price chart visually. But an experienced trader should clearly understand the current balance of power in the market before entering. A signal to exit the oversold area is a buy signal. A signal to exit the overbought area is a sell signal. Usually, you need to set the relative values ​​for the overbought and oversold levels Bottom and Top for this indicator. The Open Trend i
Sharp
Vitalii Zakharuk
Sharp expert system works with a deposit of $ 100! The classic method of scalping. It is also worth noting that with the allowable level of the spread, the bot goes through any historical period on any currency pair. The key for the Sharp bot is the spread, it works with default settings, it is possible to work with a spread of up to 10. If the spread is more than 10, then you need to select other settings. Testing should be performed with a spread of up to 10 on all ticks. There is no point i
Are you tired of the constant ups and downs? It is not worth becoming a victim of unstable market movements, it is time to somehow get rid of it! Already now, you can use Business Trend solutions to balance the analysis of price movements and get a clearer picture of price behavior. Business Trend is a trend indicator for the MetaTrader 4 trading platform. This indicator allows you to find the most likely trend reversal points. You will no longer find a copyright indicator like this. A simple
フィルタ:
レビューなし
レビューに返信