Atbot

4.62

AtBot:

どのように機能し、どのように使用するか

### どのように機能するか MT5プラットフォーム用の「AtBot」インジケーターは、テクニカル分析ツールの組み合わせを使用して売買シグナルを生成します。単純移動平均(SMA)、指数移動平均(EMA)、および平均真実範囲(ATR)インデックスを統合して取引機会を特定します。さらに、Heikin Ashiキャンドルを使用してシグナルの精度を向上させることもできます。 購入後にレビューを残すと、特別なボーナスギフトを受け取ります。

### 主な機能:

- 再描画なし: シグナルはプロット後に変更されません。

- 再描画なし: シグナルは一貫しており、変更されません。

- 遅延なし: 遅延なくタイムリーなシグナルを提供します。

- 多様な時間枠: あらゆる時間枠で使用可能で、取引戦略に合わせることができます。

### 操作手順:

#### 入力と設定:

- firstkey (TrendValue): トレンド検出の感度を調整します。

- Secondkey (SignalValue): 売買シグナル生成の感度を定義します。

- masterkey (ExitValue): シグナルの出口戦略を制御します。

- h: Heikin Ashiキャンドルに基づいてシグナルを生成するかどうかを切り替えます(真/偽)。

- notifications: シグナルアラートの通知を有効または無効にします。

#### ATR計算: ATRは市場のボラティリティを測定し、ストップロスとテイクプロフィットのレベルを決定するために使用されます。

#### ストップロスとテイクプロフィットの計算: ATR値と感度設定を使用して計算されます。

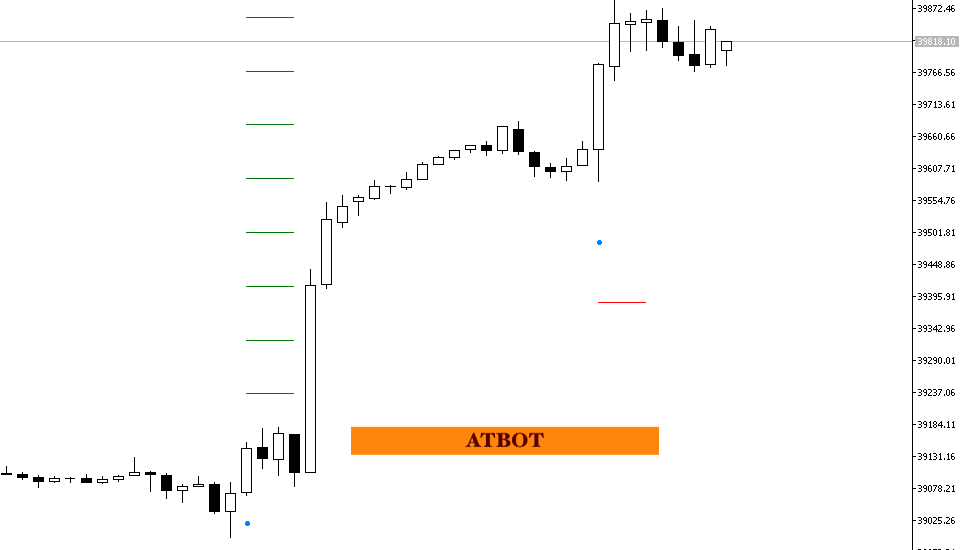
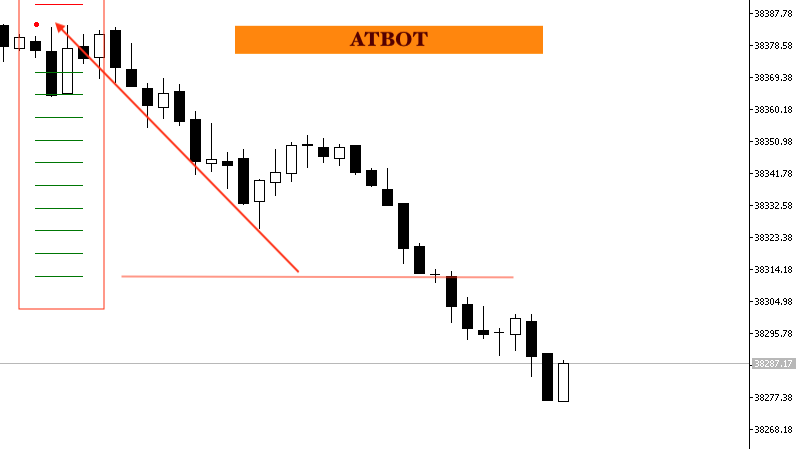
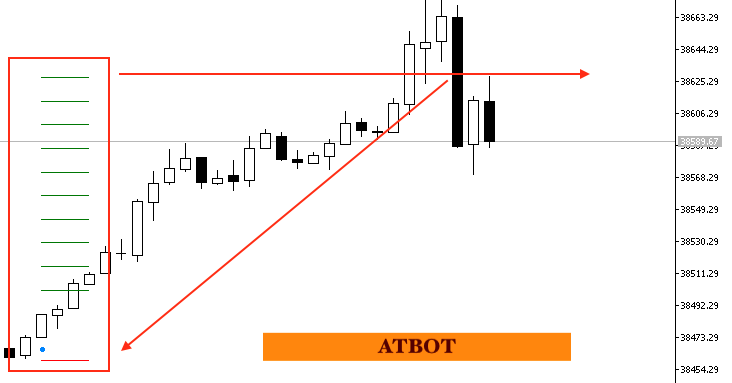
#### 売買シグナル生成: 価格がATRトレイリングストップレベルを超えると、買いシグナルが発生します。 価格がこのレベルを下回ると、売りシグナルが発生します。

#### 信号表示: 買いシグナルと売りシグナルは、チャート上で緑色と赤色の矢印で示されます。 ストップロスとテイクプロフィットのラインも表示されます。

### 使い方

#### インジケーターをチャートに追加:

1. MQL5.comを訪れてインジケーターをダウンロードします。

2. MT5で「ファイル」メニューに行き、「データフォルダーを開く」を選択します。

3. 「MQL5」フォルダーに移動し、「Indicators」に進みます。

4. ダウンロードした.ex5ファイルをこのフォルダーに置きます。

5. MT5を再起動して、インジケーターが「ナビゲーター」ウィンドウに表示されることを確認します。

6. 「ナビゲーター」ウィンドウからチャートにインジケーターをドラッグします。

#### パラメータの設定:

- firstkey (TrendValue): トレンド検出の感度を設定するために調整します。

- Secondkey (SignalValue): 売買シグナルの感度を定義するために設定します。

- masterkey (ExitValue): 退出戦略を管理するために設定します。

- h: シグナル生成のためにHeikin Ashiキャンドルを有効または無効にします。

- notifications: 取引アラートの通知を有効または無効にするために切り替えます。

#### シグナルの解釈: 買いシグナルは緑色の矢印で示されます。 売りシグナルは赤色の矢印で示されます。 取引を管理するためにストップロス(SL)とテイクプロフィット(TP)ラインを使用します。 #### アラートの使用: MT5でアラートを設定して、インジケーターの条件に基づいて売買シグナルを通知されるようにします。

### 重要な注意事項:

- リスク管理: 取引リスクを効果的に管理するためにストップロスポイントを使用します。

- テストと最適化: 実際の取引に適用する前に、デモ口座でインジケーターをテストおよび最適化します。

- 他の分析と組み合わせる: このインジケーターを他のテクニカルおよびファンダメンタル分析手法と組み合わせて、意思決定を改善します。

スクリプトをチャートに追加する: まず、TradingViewアカウントにログインします。

Pine Editorセクションに移動し、スクリプトコードを貼り付けます。 スクリプトを保存し、チャートに適用します。

パラメーターの設定: 必要に応じてa、c、hパラメーターを調整します。 インジケーターの感度を変更するには、aの値を変更します。 cの値を変更してATR期間を調整します。 平均足を使用したい場合は、hオプションを有効にします。

シグナルの解釈: 買い信号は緑の矢印で、売り信号は赤の矢印で表示されます。 ストップロス(SL)および利食い(TP)ラインもチャート上に表示され、リスク管理に使用できます。

アラートの使用: 特定の条件が満たされたときに通知を受けるように、買い・売り信号のアラートを設定できます。

重要なポイント リスク管理:常にストップロスポイントを使用して取引リスクを管理してください。 テストと最適化:実際のアカウントでこのインジケーターを使用する前に、デモアカウントでテストと最適化を行ってください。 他の分析と組み合わせる:このインジケーターを他の技術的および基本的分析手法と組み合わせて、より良い取引判断を下してください。

レビュー 68
Gomez1337
51
Gomez1337 2025.11.09 12:16 
 

Great Tool with very good price Always professional and fast support Works very fine

i.sebastien Isaac
36
i.sebastien Isaac 2025.10.10 20:50 
 

I've been testing and getting used to using the ATbot app for two weeks now. Today, it's an indispensable tool for my analysis and decision-making. Two weeks of testing, each time with the same starting capital and positive results. I recommend the app.

MarFapump
69
MarFapump 2025.09.30 14:51 
 

Dear Zaha Feiz, many thanks for the great working indicator. It´s especially for beginners with less money an enormous help to make profits quickly. What to do to get to the VUP Crypto Channel?

おすすめのプロダクト
VR Pivot - これは、主要なピボットポイント(pivot)の指標です。 ピボットポイントは、最強の価格帯を識別するために使用される特別なタイプのサポートレベル(support)と抵抗(resistance)です。プロのトレーダーは、価格の反転の高い確率がある価格を決定するために逆転のポイントを使用します.レベルは、特別な数式に従って計算され、終了、開口部、最大、前の期間の最小値の価格が考慮されます。最も効果的なのは、毎日の期間です。一見すると、これらのレベルに特別なものは何もないと思われるかもしれませんが、ピボットポイントのレベルの助けを借りて価格の動きを分析すると、ほとんどの場合、これらのレベルが良好で正確な結果を示していることがわかります。 テクニカルサポート、設定およびソフトウェアの体験版は、作者のプロファイルによりリクエスト できます。 逆転ポイントは、ピボットポイントとしてだけでなく、最大利益のために可能な限り効率的に使用できるレベルとして使用することができます, 損失を最小限に抑えるために損失を停止, リスクを軽減するために、損失ゾーンにポジションを転送. インジケ
The Central Bank Dealers Range (CBDR) is a key ICT concept, used to project potential highs and lows for the day based on market conditions during a specific time window. The CBDR is utilized to forecast price movements in both bullish and bearish market conditions. By identifying this range, traders can better anticipate the price levels that may form as the day progresses. CBDR and Standard Deviation A key feature of the CBDR is its application of standard deviation , a statistical measure u
FREE
Introducing the River Flow Divergence Indicator Are you ready to unlock your trading potential? Meet the River Flow Divergence Indicator, a powerful tool designed to help you navigate market trends and reversals with precision. This indicator is tailored for traders who are eager to fine-tune their strategies and take control of their success. Note: This indicator is not optimized out of the box. It’s crafted for you to customize and optimize according to your unique trading style and goals. Ho
Pivot Points MT5 is a universal color multicurrency/multisymbol indicator of the Pivot Points levels systems. You can select one of its three versions: Standard Old, Standard New and Fibo . It plots pivot levels for financial instruments in a separate window . The system will automatically calculate the Pivot Point on the basis of market data for the previous day ( PERIOD_D1 ) and the system of support and resistance levels, three in each. A user can choose colors for the indicator lines. The on
Detailed Description: The   Pivot Points Indicator   is designed for traders who rely on pivot points, midpoints and support/resistance levels for their trading strategies. By automatically calculating and plotting these levels (based on   the   previous period's high, low, and close prices) , the indicator provides a clear, visual representation of critical price areas where the market may reverse or break out.The tool is particularly useful for day traders and swing traders looking to base th
FREE
Control Trading Support And Resistance Es un indicador independiente del TimeFrame que permite proyectar niveles más relevantes del mercado en función del plazo de tiempo de la operativa. Los colores del indicador están escogidos para diferenciar entre los diferentes tipos de niveles y destacar a los más relevantes. Este indicador permite visualizar en un mismo gráfico los posibles objetivos relevantes que los diferentes traders pueden emplear siguiendo diferentes tipos de operativas en funció
Malaysian SNR (Support & Resistance) Indicator for MT5 Malaysian SNR is a support and resistance indicator designed to help traders identify key price levels on the chart. It automatically plots important zones based on market structure, making it easier to read price movements and potential reaction areas. The indicator displays support (green), resistance (red), and intermediate levels (OCL) to give a clearer view of price behavior. It is suitable for traders who rely on price action and mult
#ピボットポイント_スリム インジケーター #概要 6種類のピボットを搭載した、プロフェッショナル向けピボットポイントインジケーターです。 見やすいデザインで、重要なサポート・レジスタンスレベルを自動的にチャート上に表示します。 #カスタマイズ可能な表示設定 各レベル(P、S1-S5、R1-R5)の個別色設定 各レベルの表示/非表示切り替え ラベル表示/非表示 価格表示/非表示 ラベル位置(左/右) ラベルオフセット調整(ラインとテキストの間隔) ライン幅調整 履歴表示数(最大15期間) #基本パラメータ -Pivot Type - ピボット計算方式を選択 Traditional(トラディショナル) - 最も一般的な標準ピボット計算式(S1-S5、R1-R5)                                              - 5つのサポート・レジスタンスレベル                                               - あらゆるトレードスタイルに適用可能 Fibonacci(フィボナッチ) - フィボナッチ比率を使用した
FREE
This indicator automatically calculates and displays the 9 Murrey Math price levels (0/8 through 8/8) on your chart, derived from the highest and lowest prices over a configurable lookback period. Levels update in real time via a 1-second timer, keeping them aligned with current price action. Key Features: 9 Murrey Math Levels — From Ultimate Support (0/8) to Ultimate Resistance (8/8), each labeled with its traditional description (Pivot/Reverse, Weak/Stall/Reverse, Major S/R, Trading Range boun
FREE
Multichart V and H Line Sync Overview Multichart V and H Line Sync is the essential tool for multi-timeframe traders. It instantly synchronizes your Horizontal Support/Resistance Lines and Vertical Time Lines across all open charts of the same symbol. Stop drawing the same levels on M5, H1, and D1 charts manually. With this tool, draw a line once, and it automatically replicates on every other timeframe. Perfect for keeping your technical analysis consistent and your workspace clean. Key Feature
FREE
Simple supply and demand indicator which should help identify and visualize S&D zones. Settings: Color for supply zones, color for demand zones - default colors are set for dark (black) background. Number of how much zones should be created above and below current price - value "3" means there will be 3 zones above current price and 3 zones below current price. Principle: When price creates "V", reversal zone is registered. Rectangle filled based on zone type (supply / demand) is drawn if price
If you like this product, please give it a  5 star rating as a token of appreciation. This indicator calculates and draws pivot points and support/resistance levels for both daily and weekly timeframes: Pivot (central) level Support levels S1, S2, S3 Resistance levels R1, R2, R3 It allows showing daily, weekly, or both sets of pivots , giving traders visual references for potential support/resistance areas. Pivot mode: Choose which pivots to display (weekly, daily, or both). Colors and style: C
FREE
Multi Pivot Indicator - Professional Trading Tool MULTI PIVOT PRO INDICATOR Professional Multi Pivot Indicator for MT4 5-in-1 Pivot Indicator Professional Trading Tool for MetaTrader 4 ENGLISH TÜRKÇE Multi Pivot Indicator PRO Classic Fibonacci Camarilla Woodie DM What is Multi Pivot Indicator? Multi Pivot Indicator is a professional trading tool that displays 5 different pivot calculation methods on your MetaTrader 4 charts. Pivot points are critical support and resistance
This indicator automatically calculates and displays classic pivot points on your chart, helping identify key support and resistance levels for the current trading session. Features: · Plots Pivot (PP), Resistance 1-2 (R1, R2), and Support 1-2 (S1, S2) levels · Includes current close price line for reference · Color-coded lines: Blue for pivot, Red for resistances, Green for supports · Automatic calculation based on previous day's high, low, and close · Continuous lines across the chart for e
Dynamic Pivot Zones – Your Level Assistant on the Chart This indicator is a bit like a GPS for your trading . It shows you where the price likes to hang out, where it gets nervous, and where it flies through. No more calculating pivots by hand or guessing support and resistance levels. What it does: Automatically plots H1, H4, and D1 pivots . Shows support and resistance zones : R1, R2, S1, S2. Lines are colored and easy to read , so you can instantly see what’s hot or cold. Why you’ll love it:
FREE
Key level wedge MT5
Presley Annais Tatenda Meck
The   Key level wedge MT5   indicator automatically draws rising wedge pattern and falling wedge pattern for you on the chart. This pattern is really good when used as a confirmation entry at key support & resistance, supply & demand and reversal zones. Advantages  The   Key level wedge MT5   block DOES NOT RE-PAINT, giving you confidence when a signal appears and also helps when looking back.  The   Key level wedge MT5   includes an on/off button on the chart to easily keep the charts clean
Smart Auto Trendline Indicator は、MetaTrader 5 チャート上にサポートおよびレジスタンスのトレンドラインを自動的に描画します。トレンドラインは新しいバーが形成されたときのみ更新され、最適なパフォーマンスを保証します。 Smart Auto Trendline は、 DVN Core Trendline Breakout Expert Advisor を開発するための基盤として使用されるコアインジケーターであり、完全自動のトレーディングシステムで同じトレンドラインブレイクアウトの概念を実装しています。 Features ラインの幅、色、および極値サイド範囲のカスタマイズ可能なパラメータ。 ラインはサポート(ピンク)およびレジスタンス(青)として描画され、選択および調整可能なプロパティを備えています この EA を気に入っていただけた場合は、レビューを残してください。皆様のサポートが、製品の改善と開発を続ける大きな励みになります 成功するトレードをお祈りしています!
FREE
MeeKiew Dynamic MTF Pivot: The Future of Volatility-Based Levels Experience a high-performance Dynamic Pivot System with seamless Multi-Timeframe (MTF) integration. MeeKiew Dynamic MTF Pivot isn't just another indicator; it’s an adaptive analytical engine designed to reveal "True Price" exhaustion zones that static pivots miss. Why Choose Dynamic Over Static? Traditional pivots stay fixed regardless of market momentum. MeeKiew utilizes a proprietary Dynamic Volatility Algorithm that expands dur
Volume Statistic
Syamsurizal Dimjati
5 (1)
Ritz Volume Statistic – Color Volume Histogram & Market Flow Insight Ritz Volume Statistic is a clean and powerful volume analysis indicator designed to visualize bullish and bearish market pressure through a dynamic color-graded volume histogram . The indicator transforms raw tick volume into an intuitive color spectrum , allowing traders to instantly identify volume expansion, exhaustion, and dominance shifts between buyers and sellers. A built-in statistical panel summarizes total volume, bul
FREE
Gold Market Structure PRO MT5 Gold Market Structure PRO MT5 is a market structure analysis indicator for MetaTrader 5 designed to identify and display price structure based on swing highs and swing lows directly on the chart. The indicator classifies market movement into higher highs (HH), higher lows (HL), lower highs (LH), and lower lows (LL), and derives the current structure state such as uptrend, downtrend, range, or transition. It is particularly useful for gold trading (XAUUSD), where ma
To review our products, please click the link: LINK This Classic Pivot Point Indicator accurately calculates and displays 7 essential pivot levels , including the Pivot Point , 3 Support levels (S1–S3) , and 3 Resistance levels (R1–R3) based on the standard classic pivot formula . Designed for Forex, indices, commodities, and crypto trading , it supports multi-currency and multi-timeframe analysis in a clean, professional dashboard interface . With the built-in interactive dashboard , traders c
"Manual channel drawing? Not anymore. Let the market structure reveal itself automatically." "Track long-term price zones 24/7, in real-time." Real Trader Pain Points Identifying pivot points manually takes   huge time   and   effort Difficult to adapt to   high volatility   and pinpoint   reliable channels Copy Ideas "Markets never sleep. Why should your analysis stop?" "Dozens of assets a day—how do you keep up?" Core Claim AutoChannels   automatically reads market structure , reducin
SMC Workflow Auto EA
Choawana Malaikitsanachalee
English – Product Description (V1.42) SMC Workflow Auto EA — SR / OB / FVG with BOS–CHOCH Confirmation Smart-Money-Concepts Expert Advisor that trades only when a clean SMC setup appears: Order-Block retest after Break of Structure (BOS / CHOCH) confirmation, with optional SR and Fair Value Gap (FVG) confluence. The EA uses pending limit orders, fixed SL/TP or RR-based exits, step-lock trailing and strict risk-controls designed to pass broker validation. What it does Detects swing structure usi
FREE
Logiciel MQL5 – TIME BOX PRO v2.0 概要 TIME BOX PRO v2.0 , MetaTrader 5 Liste des prix ​ Description du produit :  Y EAR(年)、SEMESTRE(半期)、QUARTER(四半期)、MONT H, SEMAINE, JOUR, jour ( HB 90 %, 50 %, 10 %) Logiciel MQL5化されており、全ての重要期間を迅速かつ効率的に確認できます。 主な機能 マルチタイムフレーム : ANNÉE, SEMESTRE, TRIMESTRE, MOIS, SEMAINE, JOUR ️ タイムフレームごとのカラーボックス で価格レンジを視覚化 カスタマイズ可能な HBレベル (90%, 50%, 10%) ️ 動的ラベル により期間を表示 (ANNÉE, S1, Q1, M1, SEMAINE, JOUR) Processeur CPU  : タイムフレームごとの表示/非表示 を入力設定で切替可能 表示期間の制限 で最
O  GRIDBOT WIM  robô de investimento para Mini Índice. Parametrizado com grade linear ou zona de expansão (FIMATHE). CONFIGURAÇÕES: Ponto de entrada Pivot dia anterior    double r1 = pivot + distance;    double r2 = r1 + distance;    double r3 = r2 + distance;    double r4 = r3 + distance;    double r5 = r4 + distance;    double r6 = r5 + distance;    double r7 = r6 + distance;    double r8 = r7 + distance;    double r9 = r8 + distance;    double r10 = r9 + distance;        double s1 = pivot -
今日は。. UturnAnalysis - インジケータの品質を確認するには 私たちは、MICEXの先物および株式市場のためのこの指標に基づいて逆転に関するシグナルの試用版の無料配布を開始しました 技術サポート、私に書き込みます777basil@mail.ru 、またはコメントであなたのメールアドレスと私たちはあなたにアラートが送信されるアカウントの詳細を送信します無料で。 https://youtu.be/q228LvLec-Y   私たちは一度にいくつかのツールに置きます https://youtu.be/Wr7N2WEY8lA あなたが有用な何かを行うことができます信号の間に、モニターであなたの時間を節約します, 反転ゾーンインジケータは、一定の時間におけるシンボル状態の複雑な分析器として設計されています。 今日、我々はあなたが事前に反転レベルを知っていれば、フラットとオーバークロック預金戦略に適しているベタバージョンを提示します, その後、行動を起こして利益を修正したり、損益分岐点にストップロスを移動したり、必要に応じて追加のボリュームを追加して取引を拡大したり
WARNING: This indicator is distributed EXCLUSIVELY on MQL5.com MT4 version:   https://www.mql5.com/it/market/product/160363 MT5 version:   https://www.mql5.com/it/market/product/160410 ============================================================================================= MAX RIBBON ver 1.00 The indicator that shows you the TREND clearly and unambiguously! ============================================================================================= DESCRIPTION MAX RIBBON is an advanced tre
Point and Fignure (P&F) chart plots price against changes in direction by plotting a column of Xs as the price rises and a column of Os as the price falls. Features Support for several kinds of price types - High/Low and Close. Clean and easy-to-read chart. Displays column high and low prices as indicator values. Support for both 4 and 5-digit brokers. Customizeable colors. Advantages Filter insignificant price movements and noise. Less noise and more stable work. Focus on important price move
Visual Multi-Frame Volatility Gauge: See Inside the Market's Moves Unlock a deeper understanding of market dynamics with the Visual Multi-Frame Volatility Gauge. Standard indicators show you what happened, but this powerful tool shows you how it happened. It answers the critical question every trader asks: Is this a strong, directional trend or a volatile, uncertain battle? By visualizing the internal structure of each price bar, you gain a unique edge in confirming trends, spotting exhaustion,
FiboPivotsIndicator is the indicator for intraday traders looking for key breakout levels and target levels on the chart. It uses automatic Fibonacci extensions and pivot points to highlight price event areas.   FiboPivotsIndicator  is a unique combination of Fibonacci extensions and pivot points for price action traders. This breakout trading tool is suitable for both trend following and swing trading strategies. Indicators such as moving averages, stochastics and RSI are well suited for this
このプロダクトを購入した人は以下も購入しています
Azimuth Pro
Ottaviano De Cicco
5 (6)
発売プロモーション Azimuth Proは先着100名様限定で 299ドル でご提供します。最終価格は 499ドル となります。 リテールとインスティテューショナルのエントリーの違いはインジケーターではなく、ロケーションにあります。 多くのトレーダーは、モメンタムを追いかけたり、遅行シグナルに反応して、任意の価格レベルでエントリーします。機関投資家は、需給が実際にシフトする構造的なレベルに価格が到達するのを待ちます。 Azimuth Proはこれらのレベルを自動的にマッピングします:スイングアンカーVWAP、マルチタイムフレーム構造ライン、高確率ロケーションにのみ出現するABCパターン。 Azimuth Proは、構造分析とインテリジェントな自動化の両方を求めるプロフェッショナルトレーダー向けに構築されています。 Azimuthが外科的精度で市場構造をマッピングする一方、Azimuth Proはインテリジェンスレイヤーを追加します:トレーディングスタイルの自動検出、スマート設定された移動平均線、20年のデータでバックテストされた最適化パラメータ。その結果、お使いの銘柄と
このインジケーターを購入された方には、以下の特典を 無料 で提供しています: 各トレードを自動で管理し、ストップロスとテイクプロフィットを設定し、戦略ルールに基づいてポジションを決済する補助ツール 「Bomber Utility」 様々な銘柄に合わせたインジケーターの設定ファイル(セットファイル) 「最小リスク」、「バランスリスク」、「待機戦略」 の3つのモードで使用できる Bomber Utility 用の設定ファイル このトレーディング戦略をすぐに導入・設定・開始できる ステップバイステップのビデオマニュアル ご注意: 上記の特典を受け取るには、MQL5のプライベートメッセージシステムを通じて販売者にご連絡ください。 オリジナルのカスタムインジケーター 「Divergence Bomber(ダイバージェンス・ボンバー)」 をご紹介します。これは、MACDのダイバージェンス(乖離)戦略に基づいた 「オールインワン」型のトレーディングシステム です。 このテクニカルインジケーターの主な目的は、価格とMACDインジケーターの間に発生するダイバージェンスを検出 し、将来の価格の動きを示す
Entry In The Zone and SMC Multi Timeframe is a real-time market analysis tool developed based on Smart Money Concepts (SMC). It is designed to analyze market structure, price direction, reversal points, and key zones across multiple timeframes in a systematic way. The system displays Points of Interest (POI) and real-time No Repaint signals, with instant alerts when price reaches key zones or when signals occur within those zones. It functions as both an Indicator and a Signal System (2-in-1), c
CGE Trading Suite
Carl Gustav Johan Ekstrom
5 (1)
CGE Trading Suite delivers the analytical edge typically reserved for professional trading desks. The platform integrates a full suite of analytical tools into one seamless workflow: dynamic grid mapping, liquidity behavior analysis, ECM, trend lines, MIDAS, trade cycles, and directional channel projections. Together, these provide a unified view of market structure and momentum. Directional clarity is further enhanced by the capital flow index, which measures currency basket strength to identif
RelicusRoad Pro: 定量的市場オペレーティングシステム 【期間限定】無制限アクセス 70% OFF - 2,000人超のトレーダーと共に なぜ多くのトレーダーは「完璧な」インジケーターを使っても失敗するのでしょうか? それは、文脈を無視して 単一の概念 だけでトレードしているからです。文脈のないシグナルは単なるギャンブルです。勝ち続けるには、 根拠の重なり(コンフルエンス) が必要です。 RelicusRoad Proは単なる矢印インジケーターではありません。完全な 定量的市場エコシステム です。独自のボラティリティモデリングを用いて、価格が推移する「適正価値の道(Fair Value Road)」をマッピングし、ノイズと真の構造的ブレイクを判別します。 推測はやめましょう。機関投資家レベルの「ロード・ロジック」でトレードを。 コアエンジン:「Road」アルゴリズム システムの中心となる Road Algo は、市場環境にリアルタイムで適応するダイナミックなボラティリティチャネルです。 安全ライン(平衡点) と、価格が数学的に反転しやすい 拡張レベル を投影します。 Si
このインジケーターを購入すると、プロ仕様のトレードマネージャーを無料で差し上げます。 まず第一に、このトレーディングシステムがノンリペイント、ノンリドロー、ノンラグのインジケーターであることを強調する価値がある。これにより、手動取引とロボット取引の両方に理想的なものになっています。 オンラインコース、マニュアル、プリセットのダウンロード。 「スマートトレンドトレーディングシステム MT5」は、新規および経験豊富なトレーダー向けにカスタマイズされた包括的なトレーディングソリューションです。10以上のプレミアムインジケーターを組み合わせ、7つ以上の堅実なトレーディング戦略を備えており、多様な市場状況に対応する多目的な選択肢となっています。 トレンドフォロー戦略:トレンドを効果的に乗り越えるための正確なエントリーとストップロス管理を提供します。 リバーサル戦略:潜在的なトレンドの反転を特定し、トレーダーがレンジ相場を活用できるようにします。 スキャルピング戦略:高速で正確なデイトレードおよび短期取引のために設計されています。 安定性:すべてのインジケーターはノンリペイント、ノンリドロー、ノ
FX Trend NG:次世代マルチマーケット・トレンドインテリジェンス 概要 FX Trend NG は、複数の時間足に対応したプロフェッショナル向けトレンド分析およびマーケット監視ツールです。 市場全体の構造を数秒で把握することができます。 複数のチャートを切り替える必要はありません。どの銘柄がトレンド中なのか、どこでモメンタムが弱まっているのか、そしてどの時間足で強い整合性があるのかを瞬時に確認できます。 ローンチ特別オファー – FX Trend NG を $30(6ヶ月) または $80 永久ライセンス でご利用いただけます。 すでに Stein Investments のユーザーですか? -> メッセージを送信 して、プライベートグループへアクセスしてください。 セットアップや詳細情報が必要ですか? -> Stein Investments 公式ページ をご覧ください。 1. FX Trend NG が他と異なる理由 3ステート・トレンドロジック ― Buy と Sell だけではない • 多くのインジケーターは Buy または Sell の2状態のみを表示します。
トレンド スクリーナー インジケーターでトレンド取引の力を解き放ちます。ファジー ロジックと複数通貨システムを活用した究極のトレンド取引ソリューションです。 ファジー ロジックを活用した革新的なトレンド インジケーターである Trend Screener を使用して、トレンド取引を向上させます。 これは、13 を超えるプレミアム ツールと機能、および 3 つの取引戦略を組み合わせた強力なトレンド追跡インジケーターであり、Metatrader をトレンド アナライザーにする多用途の選択肢となります。 期間限定オファー : トレンド スクリーナー インジケーターは、わずか 100 ドルで生涯ご利用いただけます。 (元の価格 50$ ) (オファー延長) Trend Screener の 100% 非再描画精度の揺るぎない精度を体験して、取引の決定が過去の価格変動の影響を受けないようにしてください。 マルチタイムフレームおよびマルチ通貨機能の多用途性を解放し、比類のない自信を持って外国為替、商品、暗号通貨、インデックスの世界を取引できるようにします。 Trend Screener の包括的な
Meridian Pro
Ottaviano De Cicco
5 (1)
Meridian Pro:MT5用プロフェッショナル・マルチタイムフレーム・トレンドマトリックス 概要 Meridian Pro は Merkava Labs が開発したマルチタイムフレーム・トレンドマトリックスで、方向性の状態、強度、モメンタムの状況、マトリックスの合意をひとつのコンパクトなパネルに集約します。ひとつのアダプティブエンジンがM1からW1まで一貫して適用されます。シンボルごとの調整は不要。インジケーターの積み重ねも不要。すべてのアセットとすべてのタイムフレームをカバーするひとつの構造化された読み取りです。 発売キャンペーン — Meridian Proを USD 99 (導入価格)で入手。通常価格:USD 149 。 1. Meridian Proが他と異なる理由 ひとつのエンジン、バラバラなインジケーターのダッシュボードではない 多くのMTFダッシュボードは、タイムフレームごとに生のインジケーター値を繰り返すだけです。Meridian Proはマトリックス全体でひとつのアダプティブ・トレンドエンジンを使用するため、パネルの各行が同じ構造化フレームワークから導出されます
まず第一に、この取引インジケーターは再描画されず、再描画されず、遅延しないことを強調する価値があります。これにより、手動取引とロボット取引の両方に理想的なものになります。 ユーザーマニュアル:設定、入力、戦略。 アトミックアナリストは、価格の強さとモメンタムを利用して市場でより良いエッジを見つけるためのPA価格アクションインジケーターです。ノイズや誤ったシグナルを除去し、取引ポテンシャルを高めるための高度なフィルターを備えています。複雑なインジケーターの複数のレイヤーを使用して、アトミックアナリストはチャートをスキャンし、複雑な数学的計算をシンプルなシグナルと色に変換します。これにより、どのような初心者トレーダーでも理解して使用し、一貫した取引の決定を行うことができます。 「アトミックアナリスト」は、新規および経験豊富なトレーダー向けにカスタマイズされた包括的な取引ソリューションです。プレミアムインジケーターとトップノッチの機能を1つの取引戦略に組み合わせ、すべてのタイプのトレーダーにとって汎用性のある選択肢にします。 デイリートレーディングとスキャルピング戦略:高速で正確なデイ
マーケットメーカーのためのツール。 Meravith は次の機能を提供します: すべての時間足を分析し、現在有効なトレンドを表示します。 強気と弱気の出来高が等しくなる流動性ゾーン(出来高均衡)を強調表示します。 異なる時間足のすべての流動性レベルをチャート上に直接表示します。 テキスト形式の市場分析を生成し、参考情報として表示します。 現在のトレンドに基づいて目標値、サポートレベル、ストップロスを計算します。 取引のリスクリワード比を算出します。 口座残高に基づいてポジションサイズを計算し、潜在的な利益を推定します。 また、市場に大きな変化があった場合には警告を表示します。 インジケーターの主要ライン: 強気/弱気の出来高エグゾーストライン ― 目標値として機能します。 市場のトレンドを示すライン。市場が強気か弱気かによって色が変わり、トレンドのサポートとして機能します。主にその色が市場センチメントを示します。 出来高均衡ライン(Eq)。Eq(Volume Equilibrium)ラインはシステムの中核です。これは買い手と売り手の出来高のバランスポイントを表します。市場の流動性を示し
OmniSync Projection
Antonio-alin Teculescu
5 (1)
Chronos Fractal Engine is an innovative price projection indicator for MetaTrader 5, designed to transform your technical analysis by intelligently identifying and projecting historical price patterns. Built upon an advanced correlation algorithm and the fractal principles of the market, this powerful tool visualizes potential future price movements, giving you a unique edge in your trading decisions. What is Chronos Fractal Engine? At its core, the Chronos Fractal Engine employs a sophisticat
Quantum TrendPulse を ご紹介します。これは、   SuperTrend   、   RSI   、および Stochastic のパワーを 1 つの包括的なインジケーターに組み合わせて、取引の可能性を最大限に引き出す究極の取引ツールです。精度と効率を求めるトレーダー向けに設計されたこのインジケーターは、市場のトレンド、勢いの変化、最適なエントリー ポイントとエグジット ポイントを自信を持って特定するのに役立ちます。 主な特徴: SuperTrend 統合: 現在の市場動向に簡単に追従し、収益性の波に乗ることができます。 RSI精度: 買われすぎと売られすぎのレベルを検出し、市場の反転のタイミングに最適で、SuperTrendのフィルターとして使用されます。 確率的精度: 確率的振動を活用して、変動の激しい市場で隠れたチャンスを見つけます。SuperTrend のフィルターとして使用されます。 マルチタイムフレーム分析:   M5 から H1 または H4 まで、さまざまなタイムフレームで市場を常に把握します。 カスタマイズ可能なアラート: カスタム取引条件が満たされ
Gann Made Easy   は、ミスター・ギャンの理論を使用した取引の最良の原則に基づいた、プロフェッショナルで使いやすい外国為替取引システムです。 W・D・ガン。このインジケーターは、ストップロスとテイクプロフィットレベルを含む正確な買いと売りのシグナルを提供します。 PUSH通知を利用して外出先でも取引可能です。 ご購入後、取引方法の説明と優れた追加インジケーターを無料で入手するには、私にご連絡ください! おそらく、ギャンの取引手法についてはすでに何度も聞いたことがあるでしょう。通常、ギャンの理論は初心者のトレーダーだけでなく、すでにある程度の取引経験がある人にとっても非常に複雑なものです。なぜなら、ギャンの取引手法は理論的にはそれほど簡単に適用できるものではないからです。私はその知識を磨き、最良の原則を私の外国為替インジケーターに組み込むために数年を費やしました。 このインジケーターは非常に簡単に適用できます。必要なのは、それをチャートに添付し、簡単な取引推奨事項に従うだけです。このインジケーターは常に市場分析の仕事を行い、取引の機会を探します。適切なエントリーポイントを検
Currency Strength Dashboard Pro MetaTrader 5 用の リアルタイム通貨強度分析プロフェッショナルダッシュボード 。 このインジケーターは、 8つの主要通貨 (EUR、USD、GBP、JPY、CHF、AUD、CAD、NZD)の強さを計算し、 28の通貨ペア を同時に複数の時間足で分析・表示します。 ダッシュボードにより、トレーダーは 市場全体の状況を一目で把握 でき、余計な計算や複数のチャートを切り替える必要がありません。 計算方法 このインジケーターは、 高度な数学的通貨強度分析手法 に基づいています。 これは、類似インジケーターで一般的に使用されている RSIベースの手法 と比較して、より正確で客観的です。 この方法は 28の通貨ペアすべての相互関係を同時に分析 し、市場における実際の力関係をよりクリーンで偏りのない形で表示します。 リアルタイムダッシュボード メインテーブルには 8つの通貨 の完全なデータが表示されます。 Rank(順位) — 通貨の総合強度による順位。 1(最も強い)〜8(最も弱い) 。 Strength(強度) — 現在
優れたテクニカルインジケーター「Grabber」をご紹介します。これは、すぐに使える「オールインワン」トレーディング戦略として機能します。 ひとつのコードに、市場のテクニカル分析ツール、取引シグナル(矢印)、アラート機能、プッシュ通知が強力に統合されています。 このインジケーターを購入された方には、以下の特典を無料で提供します: Grabberユーティリティ:オープンポジションを自動で管理するツール ステップバイステップのビデオマニュアル:インジケーターのインストール、設定、取引方法を解説 カスタムセットファイル:インジケーターをすばやく自動設定し、最大限の成果を出すための設定ファイル 他の戦略はもう忘れてください!Grabberだけが、あなたを新たなトレードの高みへと導いてくれるのです。 Grabber戦略の主な特徴: 推奨タイムフレーム:M5〜H4 対応通貨ペア・資産:どれでも使用可能ですが、私が実際に検証した以下を推奨します(GBPUSD、GBPCAD、GBPCHF、AUDCAD、AUDUSD、AUDSGD、AUDCHF、NZDUSD、NZDCAD、EURCAD、EURUSD、E
BTMM State Engine Pro is a MetaTrader 5 indicator for traders who use the Beat The Market Maker approach: Asian session context, kill zone timing, level progression, peak formation detection, and a multi-pair scanner from a single chart. It combines cycle state logic with a built-in scanner dashboard so you do not need the same tool on many charts at once. What it does Draws the Asian session range; session times can follow broker server offset or be set in inputs. Tracks level progression (L
FX Power: 通貨の強弱を分析して、より賢い取引を実現 概要 FX Power は主要通貨と金の実際の強弱をあらゆる市場状況で理解するための必須ツールです。強い通貨を買い、弱い通貨を売ることで、 FX Power は取引の意思決定を簡素化し、高い確率の取引機会を見出します。トレンドを追従する場合でも、極端なデルタ値を使用して反転を予測する場合でも、このツールはあなたの取引スタイルに完全に適応します。ただ取引するだけではなく、 FX Power で賢く取引をしましょう。 1. なぜ FX Power がトレーダーにとって非常に有益なのか 通貨と金のリアルタイム強弱分析 • FX Power は主要通貨と金の相対的な強弱を計算し、マーケットダイナミクスに関する明確な洞察を提供します。 • どの資産がリードしているか、または後れを取っているかを監視して、取引するペアを賢く選びましょう。 マルチタイムフレームの包括的なビュー • 短期、中期、長期のタイムフレームで通貨と金の強弱を追跡し、マーケットトレンドに基づいて取引戦略を調整できます。 • スキャルピングからスイングトレード
あなたのシンボルでどの戦略が実際に機能するか確認しましょう - リアルマネーをリスクにさらす前に。 Power Barは、あらゆるシンボルとあらゆるタイムフレームで 極端な価格バー を検出し、3つの異なるトレード戦略を即座にバックテストします。勝率、プロフィットファクター、損益を並べて比較できます。すべてが1つのインタラクティブなパネルに集約されています。 推測なし。カーブフィッティングなし。データだけです。 Power Barが特別な理由 ほとんどのインジケーターはシグナルを出すだけで、それが機能するかどうかは推測に任されます。Power Barはさらに先を行きます - すべてのシグナルを 3つの戦略 に対してテストし、統計を表示します。FlipFlop、Momentum、Reversalをワンクリックで切り替え、数値が即座に変化するのを確認できます。 FlipFlop - 常にポジションを保有。シグナルでエントリーし、反対シグナルでイグジット。当社のリサーチでは、US30、US500、DAXなどのトレンドのあるインデックスで最も効果的です。 Momentum - シグナルの方向に
ご紹介     Quantum Breakout PRO は 、ブレイクアウト ゾーンの取引方法を変革する画期的な MQL5 インジケーターです。 13年以上の取引経験を持つ経験豊富なトレーダーのチームによって開発されました。     クォンタム ブレイクアウト プロ   は、革新的でダイナミックなブレイクアウト ゾーン戦略により、あなたのトレーディングの旅を新たな高みに押し上げるように設計されています。 クォンタム ブレイクアウト インジケーターは、5 つの利益ターゲット ゾーンを備えたブレイクアウト ゾーン上のシグナル矢印と、ブレイクアウト ボックスに基づいたストップロスの提案を提供します。 初心者トレーダーにもプロのトレーダーにも適しています。 量子EAチャネル:       ここをクリック 重要!購入後、インストールマニュアルを受け取るためにプライベートメッセージを送ってください。 推奨事項: 時間枠: M15 通貨ペア: GBPJPY、EURJPY、USDJPY、NZDUSD、XAUUSD アカウントの種類: ECN、Raw、またはスプレッドが非常に低い R
ARICoin is a powerful trading companion designed to generate high-probability entry signals with dynamic TP/SL/DP levels based on volatility. Built-in performance tracking shows win/loss stats, PP1/PP2 hits, and success rates all updated live. Key Features: Buy/Sell signals with adaptive volatility bands Real-time TP/SL/DP levels based on ATR Built-in MA Filter with optional ATR/StdDev volatility Performance stats panel (Success, Profit/Loss, PP1/PP2) Alerts via popup, sound, push, or email Cust
Bill Williams Advanced is designed for automatic chart analysis using Bill Williams' "Profitunity" system. The indicator analyzes four timeframes at once. Manual (Be sure to read before purchasing) Advantages 1. Analyzes the chart using Bill Williams' "Profitunity" system. Signals are displayed in a table in the corner of the screen and on the price chart. 2. Finds all known AO and AC signals, as well as zone signals. Equipped with a trend filter based on the Alligator. 3. Finds "Divergence Bar
このインジケーターは、反転ポイントと価格戻りゾーンを正確に表示します。     主要プレーヤー 。新たなトレンドが形成される場所を把握し、最大限の精度で意思決定を行い、すべての取引をコントロールします。 TREND LINES PRO インジケーターと組み合わせることで、その潜在能力を最大限に発揮します。 VERSION MT4 インジケーターが示す内容: 新しいトレンドの始まりに活性化する反転構造と反転レベル。 リスクと報酬の比率を最小限に抑えた利益 確定 と 損失停止の レベルの表示     RR 1:2   。 インテリジェントな削減ロジックによるストップロス。 指定されたインジケーターから 2 つのトレンド タイプの反転パターンを表示します。 指標: トレンドを追う   TREND LINES PRO   (世界的なトレンドの変化) TREND PRO   (クイックトレンド変更) シンプルで効果的   スキャナー   リアルタイムトレンド(新機能)。 マルチタイムフレームのインストゥルメント フィルタリング。 画面   利益     LOGIC AI信号の後。 当日プラス方
Gold Sniper Scalper Pro は、XAUUSD における ダマシブレイクアウト(false breakout)パターンの検出に特化した MetaTrader 5 用インジケーターです。価格がレンジの境界を突破してブレイクアウトトレーダーを誘い込み、その後反転してレンジ内に戻る4本バーのトラップ構造を識別します。インジケーターは各セットアップを17の品質要素で採点し、4層コンフルエンスパイプラインで評価し、7タイムフレームトレンドコンセンサスエンジンで検証し、ゴールドボラティリティレジーム分類器でフィルタリングします。すべてシグナルがチャートに表示される前に完了します。 詳細なユーザーガイドは、著者の   MQL5 ブログ   で入手できます。追加の更新は、著者の   MQL5 チャンネル   を通じて入手可能です。 現在のサポートポリシーに基づき、購入者は著者が開発した選定コンパニオンツールへの追加アクセスを受けることができます。 Forex通貨ペア、インデックス、暗号資産でも動作しますが、検出パラメーター、ボラティリティ処理、フィルターロジックはXAUUSD
ARIPoint is a powerful trading companion designed to generate high-probability entry signals with dynamic TP/SL/DP levels based on volatility. Built-in performance tracking shows win/loss stats, PP1/PP2 hits, and success rates all updated live. Key Features: Buy/Sell signals with adaptive volatility bands Real-time TP/SL/DP levels based on ATR Built-in MA Filter with optional ATR/StdDev volatility Performance stats panel (Success, Profit/Loss, PP1/PP2) Alerts via popup, sound, push, or email Cu
Matrix Arrow Indicator MT5
Juvenille Emperor Limited
5 (19)
マトリックスアローインジケーターMT5は、すべてのシンボル/商品(外国為替、商品、暗号通貨、インデックス、株式)で使用できる100%再描画されていないマルチタイムフレームインジケーターに続くユニークな10in1トレンドです。マトリックスアローインジケーターMT5は、初期段階で現在のトレンドを判断し、最大10の標準インジケーターから情報とデータを収集します。 平均方向移動指数(ADX) 商品チャネルインデックス(CCI) クラシック平研アシキャンドル 移動平均 移動平均収束発散(MACD) 相対活力指数(RVI) 相対力指数(RSI) 放物線SAR ストキャスティクス ウィリアムズのパーセント範囲 すべてのインジケーターが有効な買いまたは売りシグナルを与えると、対応する矢印がチャートに印刷され、次のろうそく/バーの開始時に強い上昇トレンド/下降トレンドを示します。ユーザーは、使用するインジケーターを選択し、各インジケーターのパラメーターを個別に調整できます。マトリックスアローインジケーターMT5は選択されたインディケーターからのみ情報を収集し、それらのデータのみに基づいてアローを印刷
Trend Hunter は、外国為替、仮想通貨、CFD 市場におけるトレンド指標です。 このインジケーターの特別な特徴は、価格がトレンドラインをわずかに突き抜けたときにシグナルを変更することなく、自信を持ってトレンドに従うことです。 インジケーターは再描画されず、バーが閉じた後に市場に参入するシグナルが表示されます。 トレンドに沿って移動すると、インジケーターにはトレンドの方向に追加のエントリーポイントが表示されます。 これらのシグナルに基づいて、小さなストップロスで取引できます。 トレンドハンターは正直な指標です。 インジケーター信号の上にマウスを置くと、信号の潜在的な利益と可能なストップが表示されます。 新しい信号が表示されると、次の通知を受け取ることができます。 アラート プッシュ通知 メールによる通知 電報での通知 チャートのスクリーンショットも Telegram に送信されるため、取引を決定するために端末を開く必要はありません。 インジケーターシグナルは、電報チャネル https://www.mql5.com/ja/market/product/11085#!ta
The Trend Forecaster indicator utilizes a unique proprietary algorithm to determine entry points for a breakout trading strategy. The indicator identifies price clusters, analyzes price movement near levels, and provides a signal when the price breaks through a level. The Trend Forecaster indicator is suitable for all financial assets, including currencies (Forex), metals, stocks, indices, and cryptocurrencies. You can also adjust the indicator to work on any time frames, although it is recommen
現在33%オフ 初心者にもエキスパートトレーダーにも最適なソリューション このインジケーターは独自の機能と新しい公式を多数内蔵しており、ユニークで高品質かつ手頃な取引ツールです。このアップデートでは、2つの時間枠ゾーンを表示できるようになります。より長いTFだけでなく、チャートTFとより長いTF(ネストゾーンを表示)の両方を表示できます。すべてのSupply Demandトレーダーの皆さんのお気に召すはずです。:) 重要情報の公開 Advanced Supply Demandの可能性を最大化するには、 https://www.mql5.com/ja/blogs/post/720245 にアクセスしてください。   エントリーまたはターゲットの正確なトリガーポイントを正確に特定できれば取引がどのように改善されるか想像してみてください。新しい基盤となるアルゴリズムに基づいて構築されているため、買い手と売り手の間の潜在的な不均衡をさらに簡単に特定できます。これは、最も強い需要と供給のゾーンと、過去のパフォーマンス(古いゾーンを表示)がグラフィカルに表現されるためです。これらの機能は、最適な
Master Editionは、ボリュームとマネーフローの視点を通じて市場構造を可視化するために設計されたプロフェッショナルグレードの分析ツールです。標準のボリュームインジケーターとは異なり、このツールはチャート上に日足ボリュームプロファイルを直接表示し、価格発見がどこで行われたか、そして「スマートマネー」がどこに位置しているかを正確に確認できます。 このMaster Editionは、明確さとスピードを考慮して設計されており、ロード時にチャートレイアウトを即座に美化するユニークな自動テーマ同期システムを備えています。 主な機能: 真のマネーフロー計算: 標準のティックボリュームを超えます。「Use Money Flow」を有効にすると、ボリュームは価格によって重み付けされ、特定の価格レベルでの実際の資本コミットメントが明らかになります。 バリューエリア (VA) の可視化: バリューエリア(デフォルトではボリュームの70%)を自動的に計算します。 VA Fill: コントロールゾーンを即座に識別するために、バリューエリアの背景をシェーディングします。 主要レベル: コントロールポイン
作者のその他のプロダクト
Autorithm AI 技術仕様  AUTORITHM は、MetaTrader 5向けに設計された高度なAI搭 Strategy Testerに関する重要なお知らせ: MetaTraderの技術的制限により、Strategy Tester環境ではインターネットアクセスが許可されていません。そのため、バックテスト中、EAはリアルタイムのAIデータではなく、固定された事前学習済みデータセットを使用します。 これは以下を意味します: • 異なるパラメータの組み合わせでもバックテスト結果が静的または同一に見える場合があります。 • ダイナミックで適応型のAI機能を活用するには、実運用が必要です。 このガイドに従って成功したインストールを行ってください。 [guide line]     [SET FILES]
GoldenHour
Zaha Feiz
3.37 (19)
GoldenHour Expert Advisor -------------------------------- 概要: XAUUSD(金)向けの高精度スキャルピングシステムで、高確率の単一ポジション取引に焦点を当てています。 EAは最適な市場条件の下で1日2〜3回の慎重に選ばれた取引を実行し、リスクの高い複数ポジションやマーチンゲール戦略を避けます。 *  バックテストでEAがうまく動作しない場合は、遠慮なくご連絡ください。正しく設定して最良の結果が得られるようにお手伝いします。 * 取引アプローチ: - 単一ポジション取引(複数ポジションなし) - 短期スキャルピングでリスクを制御 - 平均保有時間:15〜45分 - 月間40〜60回の取引 - グリッド、マーチンゲール、ヘッジ戦略を使用しない - 取引ごとに保守的なリスク管理 口座要件: - 最低残高:20米ドル - 推奨レバレッジ:1:500以上 - 口座タイプ:低スプレッドのECN/STP口座 - ヘッジ有効:はい - 取引商品:XAUUSD(金)5桁表示 取引モード: - アジアブレイクアウト:アジア流動性時間帯のモ
ATrend
Zaha Feiz
4.82 (17)
ATrend: その仕組みと使い方 仕組み MT5プラットフォーム向けの「ATREND」インジケーターは、テクニカル分析手法の組み合わせを利用して、トレーダーに堅牢な買いと売りのシグナルを提供するように設計されています。このインジケーターは主に、ボラティリティ測定のために平均真の範囲(ATR)を活用し、潜在的な市場動向を特定するためのトレンド検出アルゴリズムを併用しています。 購入後にメッセージを残すと、特別なボーナスギフトが贈呈されます。 主な特徴: - ダイナミックなトレンド検出: インジケーターは市場トレンドを評価し、シグナルを適宜調整することで、トレーダーが優位な市場環境に合わせて戦略を立てるのを支援します。     - ボラティリティ測定: ATRを使用することで、インジケーターは最適なストップロス(SL)とテイクプロフィット(TP)レベルを決定するために不可欠な市場ボラティリティを測定します。 - シグナルの視覚化: インジケーターは、チャート上に買いと売りのシグナルを視覚的に表示することで、トレーダーの意思決定を強化します。 操作手順 入力とセッティング - TimeF
AT Break - Smart Breakout Points Indicator  General Description The AT Break indicator is an advanced technical analysis tool for the MetaTrader 5 platform, designed based on detecting breakouts of resistance and support levels. This indicator uses sophisticated algorithms to identify potential entry and exit points and displays them visually on the chart.  Main Settings Parameter Description Range/Options Default  Price Type Determines the price type used for calculations Close, Open, High, Lo
ATLogic ATLogicインジケーター:すべての取引ツールに対応した多機能ツール ATLogicは、すべての通貨ペア、インデックス、暗号通貨を含む幅広い金融商品向けに設計された包括的で使いやすいテクニカル分析ツールです。この多機能インジケーターは、さまざまな市場でトレーダーに強力な洞察を提供します。 購入後にメッセージを残すと、特別なボーナスギフトを受け取れます 「このインジケーターをより効果的に使用する方法を学ぶために、私のAIチューターとつながるにはメッセージを送ってください!」 主な特徴 - ユニバーサル互換性: ATLogicは、外国為替ペア、株式インデックス、暗号通貨を含むすべての取引ツールでシームレスに機能します。 - マルチタイムフレーム分析:このインジケーターは、短期スキャルピングから長期投資まで、さまざまな時間枠での分析をサポートします。 - 直感的なインターフェース:ユーザーフレンドリーなデザインにより、初心者と経験豊富なトレーダーの両方が利用しやすくなっています。 - 高度なアラートシステム:カスタマイズ可能な通知は、デスクトップシステムとモバイルデ
AT Ai Bot
Zaha Feiz
3.7 (23)
ATAI: AI駆動の金取引エキスパートアドバイザー 価格は10回の購入ごとに100ドル増加します。最終価格:1250ドル。 この声明は、このAIベースの取引システムのバックテスト結果が信頼できないことを説明しています。なぜなら、取引信号を受け取るためにはインターネット接続とAIサーバーとの通信が必要であり、これはバックテスト環境では不可能だからです。 説明 ------- 理論P、オプションD、食べる ATAIは、 金および金関連通貨ペアの取引のために設計された高度なエキスパートアドバイザーです。 市場データを分析し、取引信号を生成するために、特にGroq AIモデルを利用しています。 このEAは、伝統的なテクニカル分析と最先端のAI技術を組み合わせて、情報に基づいた取引判断を行います。 主な特徴 • Groq AIを使用したAI駆動の取引信号 • 金および金関連通貨ペアに対応 • ATRベースのトレーリングストップメカニズム • 動的ロットサイズとリスク管理 • 取引時間制限 • リアルタイム市場情報を提供するユーザーフレンドリーなインターフェース 動作原理 1. 市場分析:
フィルタ:
AetherTrade
124
AetherTrade 2025.11.19 02:35 
 

Who is reviewing this? Because its a waste of money, it constantly plots absolute dog shit signals and few and far between, when it does plot, they are wrong, very wrong. More fake reviews. 99.9% of all products on this site are complete dog shit, and they are full of completely bullshit reviews. No wonder this scam center has such a strict refund policy on everything.

Gomez1337
51
Gomez1337 2025.11.09 12:16 
 

Great Tool with very good price Always professional and fast support Works very fine

i.sebastien Isaac
36
i.sebastien Isaac 2025.10.10 20:50 
 

I've been testing and getting used to using the ATbot app for two weeks now. Today, it's an indispensable tool for my analysis and decision-making. Two weeks of testing, each time with the same starting capital and positive results. I recommend the app.

MarFapump
69
MarFapump 2025.09.30 14:51 
 

Dear Zaha Feiz, many thanks for the great working indicator. It´s especially for beginners with less money an enormous help to make profits quickly. What to do to get to the VUP Crypto Channel?

henry.tradingfx
276
henry.tradingfx 2025.09.09 14:25 
 

I delete my initial comment. It is all fine.I leave a comment and wait for my surprise.

Jean chen
26
Jean chen 2025.09.05 11:11 
 

I don't know how to use it. Do you have an instruction manual?

Zaha Feiz
6646
開発者からの返信 Zaha Feiz 2025.09.05 14:07
hi , send me message
Arash Ghasempour
172
Arash Ghasempour 2025.07.04 15:55 
 

i use this indicator on gold trade and its work perfect for me recommended for everyone

al_strahov
41
al_strahov 2025.06.22 15:12 
 

Здравствуйте Заха. Купил ваш очередной продукт Atbot. Можно получать на телефон уведомления?

Agustacks
25
Agustacks 2025.06.06 20:25 
 

ユーザーは評価に対して何もコメントを残しませんでした

moh ganda sutiawan
25
moh ganda sutiawan 2025.05.15 23:47 
 

SAYA SUDAH BELI PRODUK INI TAPI GAK BISA DI INTAL KETERANGAN GAGAL

Jesse Araye
26
Jesse Araye 2025.02.24 16:09 
 

So far so good. Been helpful and I'm loving the signals

Luca Laurienzo
610
Luca Laurienzo 2025.02.05 18:15 
 

I agree with the other User who wrote that the "The "WinRate 30D ago" appearing on the chart" is not correct. The numbers shown are totally a non-sense. Useless.

renko1234
711
renko1234 2024.11.20 00:50 
 

The "WinRate 30D ago" appearing on the chart is not real since it can change significantly when the indicator is refreshed, even if the refresh is just a few seconds later. I asked that this be corrected in the Comments (#124) and also by private message, but the seller has just ignored these requests. The real win rate is actually much lower than what is shown by the indicator. When you consider that TP1 has a negative risk-reward ratio of 2:1, you will be lucky in the long run just to break even with this indicator.

iExoticDako
23
iExoticDako 2024.11.18 08:21 
 

80% Winrate on HTF, could be used without analyzing, but best if you analyze before entering. Owner responds pretty fast and helps you with whatever you need. 10/10

Zaha Feiz
6646
開発者からの返信 Zaha Feiz 2024.11.18 11:43
Thank you for being with me
Luis Pedraza
203
Luis Pedraza 2024.11.15 15:40 
 

It has about 50% of successful operations in M5. With a technical market analysis, results can be improved.

Paulo Lagdamin
23
Paulo Lagdamin 2024.11.12 11:23 
 

Pretty good to me it seems that i can't use it on my phone tho :/

Zaha Feiz
6646
開発者からの返信 Zaha Feiz 2024.11.12 11:29
Thank you for being with me
you can receive notification o your phone , send me message
Muthelo Shandukani
24
Muthelo Shandukani 2024.11.09 12:54 
 

ユーザーは評価に対して何もコメントを残しませんでした

Zaha Feiz
6646
開発者からの返信 Zaha Feiz 2024.11.12 11:27
My friend, before doing anything, you should send me a message so that I can guide you
Dachs87
164
Dachs87 2024.11.05 20:09 
 

Der Indikator liefert wirklich gute exakte Einstiegssignale. Ob man die vorgegeben Stops und Takeprofitlevels so wie angegeben für sich nutzen will, hängt von der jeweiligen Handelsstrategie ab denke ich. Die angezeigten Einstiegssignale sind jedenfalls wirklich erstaunlich genau, die meisten Trades sind erfolgreich.

Zaha Feiz
6646
開発者からの返信 Zaha Feiz 2024.11.09 17:00
Ihre Begleitung motiviert mich, mehr Produkte zu produzieren.
roberto jeannerose
53
roberto jeannerose 2024.11.03 19:43 
 

BON PRODUIT

Zaha Feiz
6646
開発者からの返信 Zaha Feiz 2024.11.04 00:56
Your satisfaction is our priority. Thank you for your continued support!
Tamas Szebeni
361
Tamas Szebeni 2024.10.25 20:24 
 

Easy and helping tool. Recommended.

Zaha Feiz
6646
開発者からの返信 Zaha Feiz 2024.10.29 11:36
Thank you for taking the time to share your experience. It means a lot to our team
レビューに返信