Better Moving Average
- Indicatori
-
Vincent Jose Proenca
 Faccio il trader da oltre dieci anni, specializzato principalmente nei CFD. Ciò che amo del trading è la logica, la disciplina e la creazione di strumenti che semplificano il processo decisionale. Non trovando indicatori adatti al mio approccio, ho iniziato a programmarli io stesso — prima per
 - Versione: 1.0
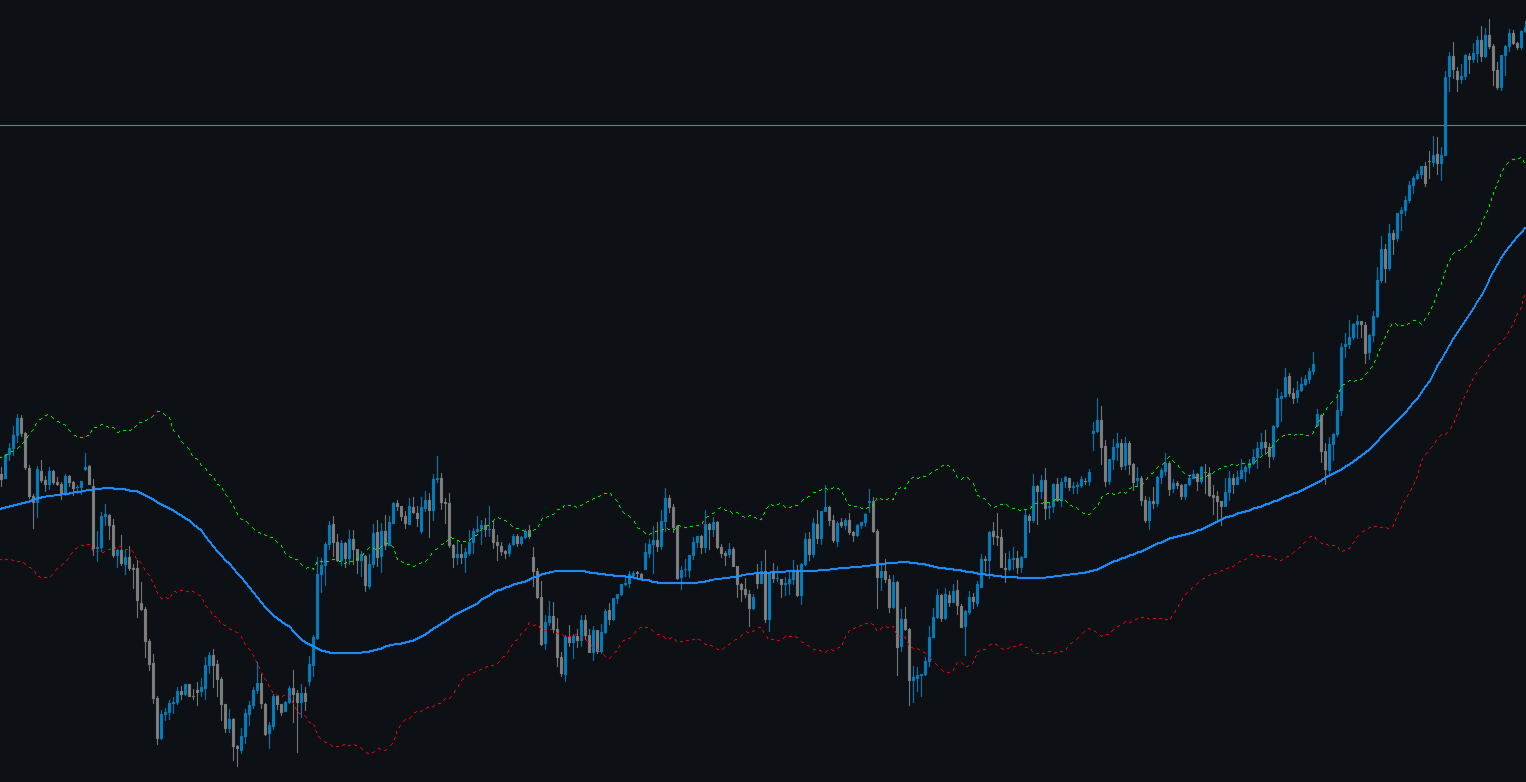
STRUCTURAL TREND LINES - MT4 Indicator
Simple indicator that automatically draws trend lines based on market structure.
Features:
- 3 degrees of structure detection (short, medium, long term)
- Configurable swing strength for each degree
- Single color per degree for clean visualization
- Adjustable number of lines per degree
- Customizable colors and line widths
How it works:
The indicator identifies swing highs and lows based on the strength parameter,
then connects these points to create trend lines. Higher degree = bigger structure.
Default settings:
- Degree 1 (strength 5): Short-term structure - Blue
- Degree 2 (strength 10): Medium-term structure - Cyan
- Degree 3 (strength 20): Long-term structure - Green (disabled by default)
Easy to use: just drag and drop on any chart, adjust parameters as needed.