Dynamic Pivot Zones
- Indicatori
-
Vincent Jose Proenca
 Faccio il trader da oltre dieci anni, specializzato principalmente nei CFD. Ciò che amo del trading è la logica, la disciplina e la creazione di strumenti che semplificano il processo decisionale. Non trovando indicatori adatti al mio approccio, ho iniziato a programmarli io stesso — prima per
 - Versione: 1.0
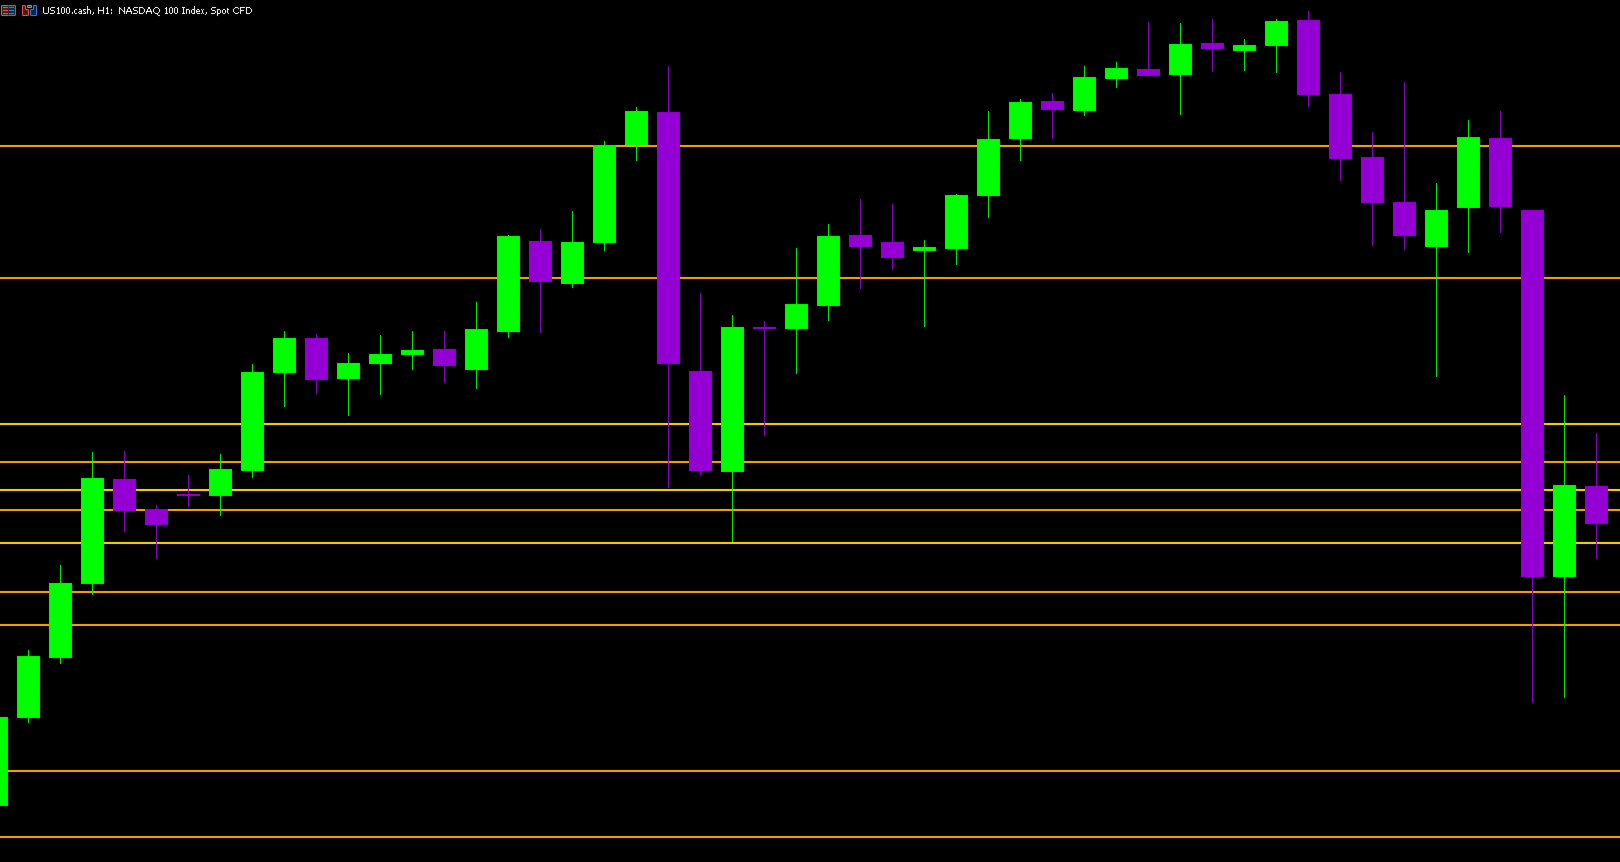
Dynamic Pivot Zones – Your Level Assistant on the Chart
This indicator is a bit like a GPS for your trading. It shows you where the price likes to hang out, where it gets nervous, and where it flies through. No more calculating pivots by hand or guessing support and resistance levels.
What it does:
-
Automatically plots H1, H4, and D1 pivots.
-
Shows support and resistance zones: R1, R2, S1, S2.
-
Lines are colored and easy to read, so you can instantly see what’s hot or cold.
Why you’ll love it:
-
Drop the indicator on your chart, and bam – it comes alive.
-
No more spending hours hunting for key levels.
-
You instantly see where the price might bounce or break.
It’s simple, effective, and gives you a serious helping hand for your trades.