Initial Balance MT5

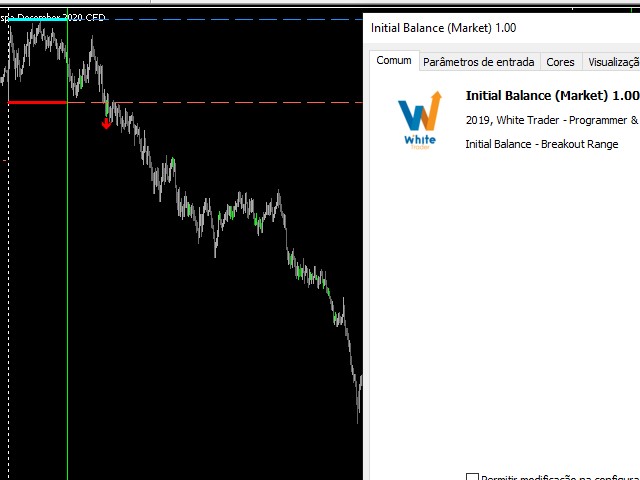
The Initial Balance (Initial Balance / Initial Balance) is a concept related to the study of volume (to learn more, study about Market Profile and Auction Market Theory. You can find some videos in English when searching for "Initial Balance Market Profile").


The IB defines a range in which prices were negotiated in the first hour of trading.The amplitude of the range is important and the break in the range defined by the Initial Balance may have occurred due to the movement of several players operating in that direction, and it is interesting to follow this movement.

Thus, this indicator seeks to automatically mark the level of the IB and can also visually signal the break.

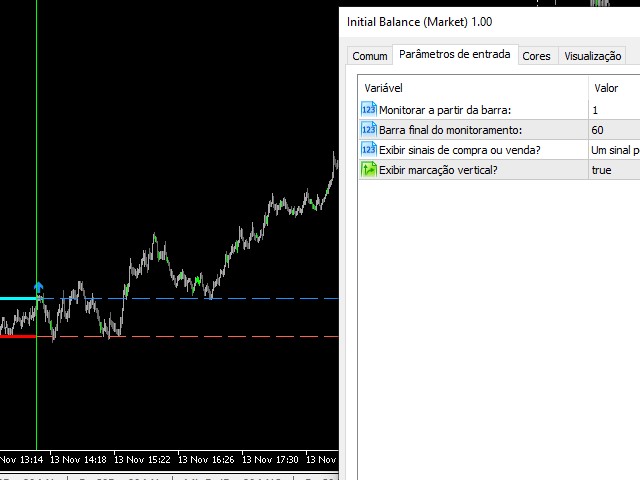
The input settings are:

  • Starting bar: 1 (monitor from the first candle)

  • Final bar: 60 (so we are monitoring the first hour if it is in the 1 minute timeframe)

  • Display buy and sell signals (Buffer that signals a break and can be adapted for use in Expert Advisors, where buffer 0 is a sell signal and buffer 1 is a buy signal);

  • Display vertical marking (a green line in the last IB candle)


By modifying the start and end boom settings, you can use the same indicator for other break break setups. This was the idea when programming the indicator to suit different traders and setups.


It is.


Success and good trades!

Prodotti consigliati
This Volume Delta Profile is an advanced MetaTrader 5 indicator that visualizes   volume delta (order flow imbalance)   using a volume profile-style histogram. It shows the difference between buying and selling pressure at specific price levels, helping traders identify supply and demand zones. This indicator provides a unique perspective on market dynamics by visualizing the imbalance between buying and selling pressure, offering insights beyond traditional volume analysis. Core Concept Positiv
Delta Profile Volume
Teresinha Moraes Correia
Technical Description of the Indicator – Delta Profile for MetaTrader 5 The Delta Profile is an indicator developed for MetaTrader 5 focused on detailed analysis of volume flow within a defined range of candles. It organizes and displays information about the imbalance of positive volumes (associated with upward movements) and negative volumes (associated with downward movements) at different price levels. The result is a clear view of the chart points where the highest concentration of trades o
Intraday Session TPO: Precision Volume Profiling for Day Traders Stop trading blind during the most volatile hours of the day. Standard daily volume profiles blend everything together, masking the true areas of liquidity and institutional interest. The Intraday Session TPO is engineered specifically for session-to-session traders. It empowers you to isolate and profile specific time windows—like the London Open, the New York Killzone, or the Asian range—so you can see exactly where the volume is
This indicator allows you to enjoy the two most popular products for analyzing request volumes and market deals at a favorable price: Actual Depth of Market Chart Actual Tick Footprint Volume Chart This product combines the power of both indicators and is provided as a single file. The functionality of Actual COMBO Depth of Market AND Tick Volume Chart is fully identical to the original indicators. You will enjoy the power of these two products combined into the single super-indicator! Below is
VP hidden
Emr Aljnaby
4.33 (12)
The indicator works to convert normal volume into levels and determine financial liquidity control points. It is very similar in function to Fixed Volume Profile. But it is considered more accurate and easier to use than the one found on Trading View because it calculates the full trading volumes in each candle and in all the brokers present in MetaTrade, unlike what is found in Trading View, as it only measures the broker’s displayed prices. To follow us on social media platforms: telegram
FREE
VolumeProfile MT5
Robert Hess
4.14 (7)
Description: The Volume Profile displays detailed informations of historical trading activities at certain price levels (Market Profile). Locate the areas with the best prices in the market and get an advantage over other market participants. Features: Customizable Market Profile Shows the "fair" Value Area with 70% of all Volume Shows critical low volume zones Shows VPOC, VAL and VAH Points integrated resource management to reduce the load while working with multiple charts Works on all timefr
MR Volume Profile 5
Sergey Khramchenkov
The "MR Volume Profile 5" indicator is a charting tool that displays trading volume at different price levels rather than time intervals. A key concept in volume profile is the point of control (POC)—the price level with the highest volume traded during the session or time range. While tools like VWAP or OBV provide volume trends, the "MR Volume Profile 5" indicator offers granular detail about where the most market activity occurs at specific price levels. This makes it a more precise tool for
VOLUME PROFILE SAF-XII Analisi Market Profile Professionale per MT5 (L'indicatore ideale per i trader che utilizzano strategie Grid) COS'È IL VOLUME PROFILE? Il Volume Profile è uno strumento istituzionale professionale che visualizza l'attività di trading a specifici livelli di prezzo, a differenza dei tradizionali indicatori di volume che mostrano il volume nel tempo. Rivela DOVE sono avvenuti gli scambi all'interno della finestra temporale scelta, aiutando a identificare: VALUE AREAS (VAH/VA
Was: $249  Now: $99   Market Profile defines a number of day types that can help the trader to determine market behaviour. A key feature is the Value Area, representing the range of price action where 70% of trading took place. Understanding the Value Area can give traders valuable insight into market direction and establish the higher odds trade. It is an excellent addition to any system you may be using. Inspired by Jim Dalton’s book “Mind Over Markets”, this indicator is designed to suit the
Here   our more valuable tools SMC Trend Trading   ,  Easy SMC Trading  ,  Institutional SMC Architect Volume Analysis Tools  ,  Volume flow Profile  ,  Market volume profile  , FVG with Volume  , Liquidity Heatmap Profile  ,  Volume Spread Analysis The    Liquidity Heatmap   is a sophisticated institutional trading tool designed to reveal where over-leveraged traders are trapped. By calculating estimated liquidation levels based on volume spikes and leverage, this indicator draws a dynamic "h
L' Advanced POC Fixed Range Volume Profile è un indicatore di Volume Profile interattivo progettato per MetaTrader 5. L'intero algoritmo e la fluidità di utilizzo si basano sul rinomato strumento "Fixed Range Volume Profile" di TradingView. Ti consente di selezionare manualmente qualsiasi regione del grafico per analizzare la distribuzione del volume. Questo aiuta a identificare istantaneamente le zone ad alta liquidità, le aree di rifiuto e il prezzo equo di un asset in un periodo specifico. Ca
Versione MT4: https://www.mql5.com/en/market/product/166784 Versione MT5: https://www.mql5.com/en/market/product/166785 PROFILO DI LIQUIDITÀ IL PROFILO DI LIQUIDITÀ è uno strumento visivo per la struttura del mercato che mappa le potenziali zone di liquidità sul grafico utilizzando un profilo dinamico in stile heatmap. Questo indicatore analizza l'andamento storico dei prezzi e il volume dei tick, evidenziando quindi le aree di prezzo in cui è probabile che la liquidità sia concentrata. Trac
Profile Map MT5
Dmitriy Sapegin
5 (5)
Market Profile helps the trader to identify the behavior if major market players and define zones of their interest. The key feature is the clear graphical display of the range of price action, in which 70% of the trades were performed. Understanding of the location of volume accumulation areas can help traders increase the probability of success. The tool can be used as an independent system as well as in combination with other indicators and trading systems. this indicator is designed to suit
ZoneCore MT5
Frederic Jacques Collomb
ZONECORE — Volume Profile & Pivot Levels Identificate le zone di prezzo più scambiate con precisione chirurgica. MT4 version Che cos'è ZONECORE? ZONECORE è un indicatore di livello professionale che combina il Profilo di Volume (Volume Profile) e i Livelli Pivot ad alto volume (Pivot Levels) per rivelare le zone di prezzo in cui il mercato ha trascorso più tempo e ha scambiato il maggior volume. Queste zone agiscono come magneti per il prezzo — conoscerle vi offre un vantaggio decisivo nell'ide
Infinity Liquidity AI - Premium MT5 Liquidity & Smart Money  If you are interested in using a professional liquidity-based MT5 indicator at the lowest possible price, this is the best time to purchase. Once the early slots are gone, the price will not stay the same. Free Bonus Indicator Included After purchase, message us from your profile and you will receive 1 premium indicator completely free with Infinity Liquidity AI. This bonus is included for buyers who contact us after purchase. You wil
Binary Rise Fall
Israr Hussain Shah
Here   our more valuable tools SMC Trend Trading   ,  Easy SMC Trading  ,  Institutional SMC Architect Volume Analysis Tools  ,  Volume flow Profile  ,  Market volume profile  , FVG with Volume  , Liquidity Heatmap Profile  ,  Volume Spread Analysis The Fractals_Price indicator is a technical analysis tool that identifies fractal patterns on price charts. Fractals are recurring patterns that signal potential trend reversals or continuation points. This indicator marks both upward and downward
Market profile was developed by Peter Steidlmayer in the second half of last century. This is a very effective tool if you understand the nature and usage. It's not like common tools like EMA, RSI, MACD or Bollinger Bands. It operates independently of price, not based on price but its core is volume. The volume is normal, as the instrument is sung everywhere. But the special thing here is that the Market Profile represents the volume at each price level. 1. Price Histogram The Price Histogram i
Strumento Avanzato di Analisi del Profilo dei Volumi per MetaTrader 5 Il Kecia Volume Profile Order Finder offre ai trader funzionalità di analisi del profilo dei volumi. Questo indicatore per MT5 combina la visualizzazione del profilo dei volumi con calcoli statistici per aiutare a identificare potenziali opportunità di trading e suggerisce livelli di entrata, stop loss e take profit basati sulla struttura del mercato. Visualizzazione del Profilo di Mercato Trasforma il tuo grafico con visualiz
Advanced ARFIMA Predictor Advanced ARFIMA Predictor is a predictive trading indicator built on the ARFIMA (AutoRegressive Fractionally Integrated Moving Average) model, designed to capture the structural memory embedded in financial markets and translate it into actionable Buy and Sell signals. Unlike traditional short-memory models, ARFIMA incorporates fractional integration to detect long-memory dynamics and persistent price behavior. This enables the indicator to anticipate regime shifts and
Suggested Name: TPO & Institutional Levels Pro Description: Elevate your market reading with TPO & Institutional Levels Pro B3 , the ultimate tool for Day Traders looking to trade alongside the smart money. Instead of cluttering your chart with multiple scattered indicators, we combined the most powerful institutional metrics into a single, clean, lightweight, and highly responsive interface for MetaTrader 5. Grounded in Auction Market Theory, this indicator reveals the true market structure. Ke
Here   our more valuable tools SMC Trend Trading   ,  Easy SMC Trading  ,  Institutional SMC Architect Volume Analysis Tools  ,  Volume flow Profile  ,  Market volume profile  , FVG with Volume  , Liquidity Heatmap Profile  ,  Volume Spread Analysis 2. Key Features Dynamic Filtering : The core feature. As soon as the current price crosses a historical liquidity level, that level disappears. This reduces chart clutter and prevents you from trading off "dead" support/resistance. Liquidity Heatma
L'indicateur SMC Venom Model BPR est un outil professionnel pour les traders travaillant dans le concept Smart Money (SMC). Il identifie automatiquement deux modèles clés sur le graphique des prix: FVG   (Fair Value Gap) est une combinaison de trois bougies, dans laquelle il y a un écart entre la première et la troisième bougie. Forme une zone entre les niveaux où il n'y a pas de support de volume, ce qui conduit souvent à une correction des prix. BPR   (Balanced Price Range) est une combinaiso
Time and Sales Tick
Pablo Filipe Soares De Almeida
Time & Sales Tick Indicator è un indicatore per MetaTrader 5 che mostra i dati dei tick in tempo reale. Visualizza prezzo, volume dei tick e orario direttamente sul grafico. Funzionalità Mostra i dati dei tick, inclusi prezzo, volume e tempo, in un pannello sul grafico. Raggruppa i tick in intervalli definiti dall’utente, con colori distinti (verde per rialzo, rosso per ribasso). Il pannello può essere posizionato in qualsiasi angolo del grafico.
Painel Nelogica ChartTrading
Tiago Silvano Souza Felipe
Painel Profit is an operational trading panel for MetaTrader 5 created to make manual execution and visual order management easier directly on the chart. The operating principle is simple: the trader selects the symbol, timeframe, volume, entry type, and exit strategy. Based on these commands, the panel sends or organizes the trade through the interface, displaying the entry, take profit, and stop loss levels on the chart for visual monitoring. This product is not a signal robot and does not mak
LT Support Resistance - Identifica supporti e resistenze in modo 100% automatico Sei stanco di perdere tempo a tracciare manualmente le linee di supporto e resistenza? O ti senti frustrato perché ti sfugge sempre quel livello importante? LT Support Resistance è stato sviluppato per eliminare questo lavoro, identificando e contrassegnando automaticamente le zone più rilevanti del tuo asset su molteplici timeframe simultanei. == L'AUTOMAZIONE INTELLIGENTE DEI LIVELLI CRITICI == Invece di disegnare
CvdDeltaVolumes
Parasbhai N Patel
Delta + CVD & CVD Candles Order-flow indicator combining Delta (Ask–Bid), Cumulative Volume Delta (CVD), and a unique CVD-based synthetic candle system. Shows buy/sell pressure, volume aggressiveness, and momentum shifts with optional Delta histogram, CVD line, and CVD+Delta combined candles. Useful for scalping, intraday trading, divergence detection, and understanding buyer/seller dominance. Overview The Delta + CVD & CVD Candles Indicator combines multiple order-flow tools into one clean
Anchored VWAP Simple
Renan Souza Da Motta
This is a simple Volume Weighted Average Price (VWAP) indicator. Simply add it to the chart and adjust the vertical line that is used as start anchor point and it is done. Volume Weighted Average Price (VWAP) is a trading benchmark that represents the average price a security has traded at throughout the day, based on both volume and price. It is calculated as the sum of price times volume for each trade, divided by total volume.
FREE
Equity Shield Pro
Algori Systems FZ-LLC
4.5 (2)
Equity Shield Pro 1.1 NEW VERSION  Equity Shield Pro 1.1 is a powerful utility EA designed to safeguard your trading account by actively monitoring and enforcing equity protection and profit management rules. Whether you’re trading personal accounts or working through proprietary firm challenges, this EA ensures strict adherence to risk and profit targets, enabling you to maintain discipline and consistency. Fully compatible with all challenge types, Equity Shield Pro 1.1 is specifically craft
ALIEN Dashboard
Youssef Esseghaiar
ALIEN DASHBOARD FULL EDITION – Professional ICT & Precision Trading Dashboard for MT5 ( HYBRID ENGINE ) Overview The   Alien Dashboard Full Edition   is a comprehensive, all‑in‑one technical indicator for MetaTrader 5 that merges the most powerful concepts from Inner Circle Trader (ICT) methodology with advanced precision‑entry logic, multi‑timeframe analysis, and an intuitive on‑chart dashboard. Designed for serious traders who want to visualise institutional order flow, identify high‑probabili
TradersParadiseView: Institutional Liquidity & Trend Logic TradersParadiseView is a professional-grade momentum and supply/demand indicator designed to identify high-probability "Smart Money" entries. Unlike standard lagging indicators, this tool focuses on Institutional Trap Zones and Market Volatility Confluence to provide precise entries with minimal drawdown. Developed for the modern trader, it translates complex price action into simple, actionable visual zones and signals. How it Works Tra
Gli utenti di questo prodotto hanno anche acquistato
Neuro Poseidon MT5
Daria Rezueva
4.97 (37)
Neuro Poseidon is a new indicator by Daria Rezueva. It combines precise trading signals with adaptive TP/SL levels - creating best possible trades as a result! Message me and get  Neuro Poseidon Assistant  as a gift to automize your trading process! What makes it stand out? 1. Proven profitability on all assets and timeframes 2. Only confirmed BUY and SELL signals present on the chart 3. Adaptive TP & SL levels generated by the software for each trade 4. Easy to understand - suitable for al
SuperScalp Pro
Van Minh Nguyen
4.67 (27)
SuperScalp Pro – Sistema avanzato di indicatore scalping multi-filtro SuperScalp Pro è un indicatore di scalping avanzato che combina il classico Supertrend con molteplici filtri intelligenti di conferma per aiutare a identificare opportunità di trading. Funziona in modo efficiente su diversi timeframe da M1 a H4, con prestazioni ottimizzate su XAUUSD, BTCUSD e principali coppie Forex. L’indicatore fornisce chiari segnali Buy e Sell, insieme a livelli di ingresso, stop loss e take profit calcola
Cominciamo con la verità. Nessun indicatore da solo ti renderà profittevole. Se qualcuno ti dice il contrario, ti sta vendendo un sogno. Qualsiasi indicatore che mostra frecce perfette di acquisto/vendita può essere reso impeccabile — basta ingrandire la giusta sezione della storia e catturare solo i trade vincenti. Noi non lo facciamo.  SMC Intraday Formula è uno strumento. Legge la struttura del mercato per te, identifica le zone a più alta probabilità e ti mostra esattamente come appare la t
Quantum TrendPulse
Bogdan Ion Puscasu
5 (25)
Ecco   Quantum TrendPulse   , lo strumento di trading definitivo che combina la potenza di   SuperTrend   ,   RSI   e   Stocastico   in un unico indicatore completo per massimizzare il tuo potenziale di trading. Progettato per i trader che cercano precisione ed efficienza, questo indicatore ti aiuta a identificare con sicurezza le tendenze di mercato, i cambiamenti di momentum e i punti di entrata e uscita ottimali. Caratteristiche principali: Integrazione SuperTrend:   segui facilmente l'andame
Entry In The Zone and SMC Multi Timeframe is a real-time 2-in-1 market analysis tool that combines market structure analysis and a No Repaint BUY / SELL signal system into a single indicator, built on Smart Money Concepts (SMC) — a widely adopted framework used by professional traders to understand market structure. This indicator helps you see the market more clearly, make decisions based on structure rather than guesswork, and focus on high-probability zones where price is more likely to react
Divergence Bomber
Ihor Otkydach
4.9 (90)
Ogni acquirente dell’indicatore riceverà inoltre gratuitamente: L’utilità esclusiva “Bomber Utility”, che gestisce automaticamente ogni operazione, imposta i livelli di Stop Loss e Take Profit e chiude le posizioni secondo le regole della strategia I file di configurazione (set file) per adattare l’indicatore a diversi asset I set file per configurare il Bomber Utility in tre modalità: “Rischio Minimo”, “Rischio Bilanciato” e “Strategia di Attesa” Una guida video passo-passo per installare, conf
Questo prodotto è stato aggiornato per il mercato 2026 e ottimizzato per le ultime build di MT5. AVVISO DI AGGIORNAMENTO PREZZO: Smart Trend Trading System è attualmente disponibile a $99 . Il prezzo aumenterà a $199 dopo i prossimi 30 acquisti . OFFERTA SPECIALE: Dopo aver acquistato Smart Trend Trading System, inviami un messaggio privato per ricevere Smart Universal EA GRATIS e trasformare i tuoi segnali Smart Trend in operazioni automatiche. Smart Trend Trading System è un sistema di tradin
M1 Quantum MT5
Hamed Dehgani
5 (1)
M1 Quantum è un sistema di trading professionale per M1 che fornisce segnali di trading rapidi e precisi con Stop Loss, Take Profit e gestione intelligente del capitale integrati. M1 Quantum include un sistema professionale di gestione del capitale progettato per far crescere rapidamente il conto concentrandosi su vittorie consecutive . Caratteristiche principali dell' Indicatore M1 Quantum Progettato per il time frame M1 e tutte le principali coppie di valute Tutti i trade hanno Stop Loss e Tak
Trend Catcher ind mt5
Ramil Minniakhmetov
5 (5)
INDICATORE TREND CATCHER L'indicatore Trend Catcher analizza i movimenti dei prezzi di mercato, utilizzando una combinazione di indicatori di analisi del trend proprietari dell'autore e personalizzati. Identifica la vera direzione del mercato filtrando il rumore a breve termine e concentrandosi sulla forza del momentum sottostante, sull'espansione della volatilità e sul comportamento della struttura dei prezzi. Utilizza inoltre una combinazione di indicatori personalizzati di smoothing e filtr
SignalTech is an unique fully rule based trading system delivers an Institutional approach for both Independent Traders and Prop Firm Challengers. Never Repaint. Push Notification available. No over-optimization. All the winning trades with chart setups are published on the comments page. 2026-05 4107 Pips (Until 05-29 NY Closed) 2026-04 2243 Pips 2026-03 2165 Pips 2026-02 2937 Pips 2026-01 2624 Pips 2025-12 1174 Pips It can generate signals with Buy/Sell Arrows, Push Notification (To Mobile) an
PrimeScalping
Temirlan Kdyrkhan
PrimeScalping is a powerful trading companion designed to generate high-probability entry signals with dynamic TP/SL/DP levels based on volatility. Built-in performance tracking shows win/loss stats, PP1/PP2 hits, and success rates — all updated live. Key Features: Buy/Sell signals with adaptive volatility bands Real-time TP/SL/DP levels based on ATR Built-in MA Filter with optional ATR/StdDev volatility Performance stats panel (Success, Profit/Loss, PP1/PP2) Alerts via popup, sound, push, or e
FX Trend MT5 NG
Daniel Stein
5 (6)
FX Trend NG: La Nuova Generazione di Intelligenza di Trend Multi-Mercato Panoramica FX Trend NG è uno strumento professionale di analisi del trend multi-timeframe e monitoraggio dei mercati. Ti consente di comprendere la struttura completa del mercato in pochi secondi. Invece di passare tra numerosi grafici, puoi identificare immediatamente quali strumenti sono in trend, dove il momentum sta diminuendo e dove esiste un forte allineamento tra i timeframe. Offerta di Lancio – Ottieni FX Trend NG
Power Candles MT5
Daniel Stein
5 (8)
Power Candles V3 - Indicatore di forza ad ottimizzazione automatica Power Candles V3 trasforma la forza delle valute e degli strumenti in un piano di trading attuabile su ogni grafico a cui è collegato. Invece di limitarsi a colorare le candele, esegue un'auto-ottimizzazione in tempo reale in background e ti fornisce i migliori valori di Stop Loss, Take Profit e soglia di segnale per il simbolo che hai davanti. Basta un clic per adottarlo nel trading live: i raggi di ingresso, Stop Loss e Take P
Atomic Analyst MT5
Issam Kassas
4.26 (35)
Questo prodotto è stato aggiornato per il mercato 2026 e ottimizzato per le ultime build di MT5. AVVISO DI AGGIORNAMENTO PREZZO: Atomic Analyst è attualmente disponibile a $99 . Il prezzo aumenterà a $199 dopo i prossimi 30 acquisti . OFFERTA SPECIALE: Dopo aver acquistato Atomic Analyst, inviami un messaggio privato per ricevere Smart Universal EA GRATIS e trasformare i tuoi segnali Atomic Analyst in operazioni automatiche. Atomic Analyst è un indicatore di trading Price Action non-repainting
GoldenX Entry MT5
Kareem Abbas
5 (11)
GoldenX Entry è un indicatore per MT5 con un algoritmo adattivo Smart Entry Trend, un sistema di scoring dei segnali, un rilevatore del regime di mercato e un filtro di volatilità. Ogni segnale include un livello di ingresso calcolato, tre livelli di Take-Profit (TP1, TP2, TP3) e un livello di Stop-Loss. È costruito su più livelli analitici progettati per adattarsi a diverse condizioni di mercato, combinando un sistema analitico multilivello con un ottimizzatore integrato e un sistema di traccia
L'indicatore UZFX {SSS} Scalping Smart Signals MT5 è un indicatore di trading ad alte prestazioni che non si aggiorna (non repaint) progettato per scalper, day trader e swing trader che necessitano di segnali accurati e in tempo reale in mercati in rapida evoluzione. Sviluppato da (UZFX-LABS), questo indicatore combina l'analisi dell'andamento dei prezzi, la conferma del trend e un filtraggio intelligente per generare segnali di acquisto e vendita ad alta probabilità su tutte le coppie di valute
Gann Made Easy è un sistema di trading Forex professionale e facile da usare che si basa sui migliori principi del trading utilizzando la teoria di mr. WD Gann. L'indicatore fornisce segnali ACQUISTA e VENDI accurati, inclusi i livelli di Stop Loss e Take Profit. Puoi fare trading anche in movimento utilizzando le notifiche PUSH. CONTATTAMI DOPO L'ACQUISTO PER RICEVERE GRATUITAMENTE LE ISTRUZIONI DI TRADING E OTTIMI INDICATORI EXTRA! Probabilmente hai già sentito parlare molte volte dei metodi d
SmartScalping
Temirlan Kdyrkhan
SmartScalping is a powerful trading companion designed to generate high-probability entry signals with dynamic TP/SL/DP levels based on volatility. Built-in performance tracking shows win/loss stats, PP1/PP2 hits, and success rates — all updated live. Key Features: Buy/Sell signals with adaptive volatility bands Real-time TP/SL/DP levels based on ATR Built-in MA Filter with optional ATR/StdDev volatility Performance stats panel (Success, Profit/Loss, PP1/PP2) Alerts via popup, sound, push, or e
Gem SIGNAL
Shengzu Zhong
5 (1)
GEM Signal Pro GEM Signal Pro è un indicatore trend-following per MetaTrader 5, progettato per i trader che desiderano segnali più chiari, configurazioni operative più strutturate e una gestione del rischio più pratica direttamente sul grafico. Invece di mostrare solo una semplice freccia, GEM Signal Pro aiuta a presentare l’intera idea di trading in modo più chiaro e leggibile. Quando le condizioni sono confermate, l’indicatore può mostrare sul grafico il prezzo di ingresso, lo stop loss e gli
ARIPoint
Temirlan Kdyrkhan
1 (1)
ARIPoint is a powerful trading companion designed to generate high-probability entry signals with dynamic TP/SL/DP levels based on volatility. Built-in performance tracking shows win/loss stats, PP1/PP2 hits, and success rates all updated live. Key Features: Buy/Sell signals with adaptive volatility bands Real-time TP/SL/DP levels based on ATR Built-in MA Filter with optional ATR/StdDev volatility Performance stats panel (Success, Profit/Loss, PP1/PP2) Alerts via popup, sound, push, or email Cu
TrendProMaster
Temirlan Kdyrkhan
MasterTrend Indicator for MT5 A powerful trend-following and signal-evaluation tool MasterTrend   is a custom MT5 indicator that combines Moving Averages and ATR-based risk/reward logic to generate clear buy/sell signals. It visualizes dynamic SL/TP levels, evaluates past trade outcomes, and displays win/loss statistics in a clean on-chart panel. Key features include: Buy/Sell signals based on MA crossovers ATR-based SL/TP1/TP2/TP3 levels with visual lines and labels Signal outcome tracking wit
Crystal Heikin Ashi Signals
Muhammad Jawad Shabir
5 (2)
Crystal Heikin Ashi Signals - Professional Trend & Signal Detection Indicator Advanced Heikin Ashi Visualization with Intelligent Signal System for Manual & Automated Trading Final Price: $149 ---------> Price goes up $10 after every 10 sales . Limited slots available — act fast . Overview Crystal Heikin Ashi Signals is a professional-grade MetaTrader 5 indicator that combines pure Heikin Ashi candle visualization with an advanced momentum-shift detection system. Designed for both manual traders
Azimuth Pro
Ottaviano De Cicco
5 (7)
Azimuth Pro V2: Synthetic Fractal Structure and Confirmed Entries for MT5 Overview Azimuth Pro is a multi-level swing structure indicator by Merkava Labs . Four nested swing layers, swing-anchored VWAP, ABC pattern detection, three-timeframe structural filtering, and closed-bar confirmed entries — one chart, one workflow from micro-swings to macro-cycles. This is not a blind signal product. It is a structure-first workflow for traders who care about location, context, and timing. V2 Launch Offe
ScalpPoint
Temirlan Kdyrkhan
ScalpPoint is a powerful trading companion designed to generate high-probability entry signals with dynamic TP/SL/DP levels based on volatility. Built-in performance tracking shows win/loss stats, PP1/PP2 hits, and success rates — all updated live. Key Features: Buy/Sell signals with adaptive volatility bands Real-time TP/SL/DP levels based on ATR Built-in MA Filter with optional ATR/StdDev volatility Performance stats panel (Success, Profit/Loss, PP1/PP2) Alerts via popup, sound, push, or emai
Reversion King Indicator
Eugen-alexandru Zibileanu
5 (4)
Un nuovo Re in città - Indicatore + Gestione ordini (TP1 + TP2 + TP3) + Invio opzionale di segnali Telegram INCLUSO (GRATIS) (SISTEMA COMPLETO DI TRADING e SEGNALI) Il nostro miglior EA per l’Oro: Gold Slayer Questo indicatore include una strategia avanzata, un sistema di trading con gestione ordini personalizzabile e un sistema mean reversion che combina estensioni di envelope, supportato da molteplici filtri intelligenti di conferma come RSI per individuare ingressi di inversione ad alta proba
È disponibile anche la versione MT4 https://www.mql5.com/it/market/product/170617  Versione Swing M30/H1/H4 disponibile Vuoi catturare i grandi movimenti? Gold Signal Swing Pro (M30/H1/H4). Obiettivo: $20-$80+ per trade. https://www.mql5.com/en/market/product/177643 KURAMA GOLD SIGNAL PRO (MT5) — Sistema di Trading XAUUSD Completo a 7 Strati di Filtri Nessun repaint. Nessun ridisegno. Nessun ritardo. Ogni segnale rima
Quant Direction MT5
Georgios Kalomoiropoulos
Quant Direction è uno strumento di analisi di mercato 3D. Offre un'analisi di mercato perfettamente oggettiva, basata su algoritmi, calcolando con precisione le deviazioni percentuali su diversi parametri. Sviluppato utilizzando strumenti di modellazione avanzati basati sull'intelligenza artificiale e rigorosamente testato, questo algoritmo analizza il mercato con una precisione senza pari. È possibile analizzare qualsiasi coppia di valute o strumento finanziario sulla piattaforma. Che si pratic
Meridian Pro
Ottaviano De Cicco
5 (2)
Meridian Pro 2.00: Professional Multi-Timeframe Trend Matrix for MT5 Meridian Pro 2.00 is a professional adaptive trend matrix for MetaTrader 5. It combines the original Meridian trend engine, a clean chart ribbon, closed-bar signal arrows, an 8-timeframe dashboard, Fuel momentum, weighted consensus, synthetic HTF processing and chart-native higher-timeframe context lines. The goal is simple: read current trend, multi-timeframe structure, strength, momentum and EA-ready state from one discipline
Questo prodotto è stato aggiornato per il mercato 2026 e ottimizzato per le ultime build di MT5. AVVISO DI AGGIORNAMENTO PREZZO: MENA Trend Scanner Pro è attualmente disponibile a $99 . Il prezzo aumenterà a $199 dopo i prossimi 30 acquisti . OFFERTA SPECIALE: Dopo aver acquistato MENA Trend Scanner Pro, inviami un messaggio privato per ricevere Smart Universal EA GRATIS e trasformare i tuoi segnali MENA Trend in operazioni automatiche. Prima di tutto, vale la pena sottolineare che questo siste
Market Structure Order Block Dashboard MT5 è un indicatore MT5 progettato per i trader che vogliono leggere la struttura di mercato e le principali zone di reazione del prezzo direttamente sul grafico. Combina BOS, ChoCH, Order Blocks, Fair Value Gaps (FVG), Liquidità, Kill Zones, Volume Profile e un pannello compatto per un'analisi rapida. Questo indicatore è rivolto ai trader che utilizzano la struttura di mercato, i concetti ICT e Smart Money come quadro decisionale. Può aiutare a individuare
Altri dall’autore
Start Midas SD Channel
Ricardo Almeida Branco
5 (1)
Do you already know the Start Midas indicator? What about the Vwap Standard Deviation indicator? And I need to speak again in the book MIDAS Technical Analysis ... The Start Midas SD Channel indicator combines the two in one, bringing the practicality and efficiency of Midas with the statistical calculation of the standard deviation. All of this with the practicality of the White Trader Start indicators, where you can plot the indicator and move them on the screen using keyboard shortcuts
The White's Candle Color indicator (by volume) will color the candles based on the current candle's volume compared to the moving average of the volume. This will allow you to see clearly if the volume (real or tick) is within the normal range, whether it is high or low and bring very important information about the market. I hope that this indicator can help in your operational. Success and good trades!
White Weis Volume Ticks
Ricardo Almeida Branco
5 (4)
White Weis Volume This indicator shows the sum of the volume in each wave, bulish or bearish, as idealized by David Weis , but it brings an important addition , which is the marking of the bar with the highest volume of the wave (White Bar)! In coding the indicator, it was sought to optimize the code to require minimal processing during use and not to overload mt5. The indicator can be used for pre-trading analysis and study, where the trader analyzes possible points of support and resistance
Volume Doji
Ricardo Almeida Branco
Hey guys. This indicator will show you, in the volume histogram, if the candle was a Doji, a bullish candle, or a bearish candle. The construction of this indicator was requested by a trader who uses other indicators from my catalog, and I decided to release it free to help traders who think that the indicator can contribute to their operations. The parameters are: Volume Type: Real Volume or Tick Volume. Color if the candle is bearish: select the color. Color if the candle is high: select
FREE
White Trader Clock
Ricardo Almeida Branco
5 (1)
Simple countdown indicator for the next candle. Only claim is to be light! The indicator inserts a text object to the right of the current price and calculates how much time is left for the new bar, showing this to the trader. Leave your comment if the indicator helped you in any way! If you have any suggestions, let me know to evaluate the improvements. Success and Good Trades!
FREE
Display N Bars
Ricardo Almeida Branco
4.88 (8)
The Display N Bars utility is a simple tool designed to help identify candles. If a trader tries to share knowledge with a colleague but it is difficult to pinpoint exactly the desired candle, just say the corresponding candle number. The candle count is reset every day. Seeking to offer a good customization the inputs are: Display type -> Display only odd, only odd, or both candles? Direction -> Horizontal or Vertical? Display multiples of: (display frequency) -> Display all number
FREE
Automatic Vwap Midas
Ricardo Almeida Branco
5 (1)
The 3 Automatic Vwap (Midas) Indicator can be used for Price and Volume studyers to map the movement of market drivers. It automatically plots 3 Vwaps, two of which are dynamic and will be updated throughout the day if new highs or new lows emerge. The third Vwap is daily and can help if the trend is up or down. Also, an auxiliary indicator that plots (also dynamic) points of interest with OHLC prices (Open, High and Low of the current day and Close of the previous day) was inserted. Success and
Start Vwap Custom Midas
Ricardo Almeida Branco
5 (3)
Attention: New update - 4 major practicality improvements! 1) Alarm 2) Midas text value 3) Click panel 4) Can be connected to an EA to operate in semi-automatic mode Attention - This indicator does not work perfectly in backtest due to MT5 peculiarities (Reading hotkeys or panel clicks) . My suggestion is that you test Automatic Vwap Midas which has automatic operation to analyze the calculation and then buy Start if you think the indicator will match your operating.     This indicator is use
O HL2 C Lines
Ricardo Almeida Branco
5 (2)
If you consider the extremes of the daily price as important points, this indicator will help in your trades. Now, instead of manually drawing lines that mark daily highs and lows, you can use the O (HL) ² C Lines indicator. Thus, the OHLC Lines indicator automatically plots the lines O (Open for the current day), H (High for the current day), L (Low for the current day) and C (Close for the previous day). Plot also the high and low of the previous day. Thus, we have 4 static lines and tw
PVA Dragon
Ricardo Almeida Branco
Users of PVRSA / PVA certainly already know the Dragon indicator and its use. The Dragon works as dynamic support and resistance and can be used for scalper or trend follower. In addition to the Dragon we have the WGT (fast) and EMA (slow) averages that can show immediate movement and also trend movement. Stay tuned for the Dragon's inclination! The indicator can be used on any asset/currency pair and can be customized according to the trader's interest. See also my volume analysis indicato
PVA Color Candle
Ricardo Almeida Branco
Several techniques use volume as an important point in the trade. Whether to indicate strength, exhaustion, pullback weakness, among others. In chief I quote Richard Wyckoff's theory, which said about the importance of looking price and volume. However, there are several possibilities to filter what is volume that should be noticed. PVRSA/PVA users use an indicator with specific colors, which assist in identifying the volume and type of movement that the price has made. Will the high volume
Do you use volume in your reading of the market? Certainly many traders use it, and do not imagine operating without it. The Color Histogram Volume Set indicator allows the user to choose the value that he considers interesting to monitor. When you pass this you will have visual confirmation and if you want you will also have the audible alert that is given by the indicator. Of course, there are other ways to try to find a high volume, such as assessing whether the volume is above av
Color Candle Volume Set
Ricardo Almeida Branco
Do you use volume in your reading of the market? Certainly many traders use it, and do not imagine operating without it. The Color Candle Volume Set indicator allows the user to choose the value that he considers interesting to monitor. When you pass this you will have visual confirmation on the price chart and if you want you will also have the audible alert that is given by the indicator. Of course, there are other ways to try to find a high volume, such as assessing whether the vol
WT Vwap Bands
Ricardo Almeida Branco
The WT Vwap Bands indicator is an indicator that combines price and volume, helping to show whether the price is within the "fair price", overbought or oversold. The indicator code was designed for performance and has already been tested in a real trading account. In addition to the visual inputs (color, thickness and line style), the user can define a% value that depends on the price. The default values work with the most distant band at 1% of the price and then dividing this distance in
Fibo Z
Ricardo Almeida Branco
5 (1)
With it, you leave pre-configured two expansion settings and one fibo retraction configuration to use via keyboard shortcut and mouse click. That is, the Fibo_Z utility facilitates the use of MT5's native functions. The shortcut keys are: "Z" configuration 1 of the expansion. "X" expansion setting 2 "Z" retraction configuration. "V" clears objects from the screen. It is. Success and good trades!
Want to make the graph cleaner? Don't you use the opening price in your analysis? Want to use a chart model that was used by Richard Wyckoff? Then you need to know the Color HLC Candles and Bars indicator. In the same indicator you can switch to the display of candles or bars. Take a look at the other volume indicators to complement your operating. And don't forget to look at the best Vwap Custom (Midas)! Leave your comment! Success and good trades!
Vwap Freeze
Ricardo Almeida Branco
5 (1)
The previous day's vwap is used by some traders as a support and resistance point, after all it is one of the ways to consider the fair price of that asset or that pair the day before. Possible defenses can occur in this region indicating a reversal, or triggering stops starting a new, more directional movement. It is a matter of analyzing how it will add to your operational. To avoid manually drawing the previous day's vwaps and saving time for your analysis, use the Vwap Freeze indicator, as
Start Display N Bars
Ricardo Almeida Branco
5 (1)
Do you already know Display N Bars? Do you already know the Start tool (from Midas indicators)? In this indicator, we unified the two tools, allowing you to define which candle will start counting, or use the automatic numbering that was already available in the previous version. Description of the utility follows: Display N Bars The Display N Bars utility is a simple tool that aims to help identify candles. If a trader tries to share the knowledge with a colleague but it is difficult t
WT Vwap 5 Bands
Ricardo Almeida Branco
WT Vwap 5 Bands The WT Vwap Bands indicator is an indicator that combines price and volume, helping to show whether the price is within the "fair price", overbought or oversold. The indicator code was designed for performance and has already been tested in a real trading account. In addition to the visual inputs (color, thickness and line style), the user can define a% value that depends on the price. The default values work with the most distant band at 1% of the price and then dividing
Haos MT5
Ricardo Almeida Branco
5 (1)
The Haos oscillator coded for the MT5! This oscillator allows to verify overbought / oversold regions in two periods (14 and 96, for example), making it possible to anticipate a reversal. Possibility to activate an audible alert when it reaches a defined level. Possibility to choose the alert sound by placing a .wav song in each asset or timeframe. (save a .wav file to the MQL5 \ Files folder) Possibility to activate / deactivate histogram and levels to make the screen cleaner. Customizable col
VTC Volatility
Ricardo Almeida Branco
The VTC Volatility indicator was written to support a Brazilian stock market strategy in the WDO (USDBRL), but it can be adapted to other strategies and markets. In the new indicator update, it is now allowed to choose up to 4 levels to determine the range, and thus be more versatile. The Brazilian stock exchange (B3) has the VTC which is a "Structured Exchange Rate Volatility Transaction" (more information on the B3 website). At around 10:00 am, the VTC "Call" comes out and Brazilian broker
Vwap Standard Deviation
Ricardo Almeida Branco
O indicador Vwap Deviation Bands segue na mesma linha dos outros indicadores da White Trader, que buscam leveza, personalização e qualidade, para entregar o que há de melhor para o trader. Isto, além de combinar preço e volume (informações importantes para o trader) com uma medida estatística do desvio padrão. Este indicador já foi utilizado e testado por outros traders que deram sugestões, inclusive, para chegarmos nesta versão final (embora ainda esteja aceitando sugestões, sempre :)   ). O de
Midas is the acronym for Market Interpretation / Data Analysis System is a trade approach started in 1995 by technical analyst Paul Levine and later developed by Andrew Coles, PhD and David Hawkins. Learn more in the book MIDAS Technical Analysis: A VWAP Approach to Trading and Investing in Today's Markets , (I saw that it is possible buy via Amazon). The positive points in relation to the Midas-based indicators are the prediction of movement reversal points, the negative point is the subjectivi
Vwap Bands Auto
Ricardo Almeida Branco
The Vwap Bands Auto indicator seeks to automatically map the maximum market frequency ( automatic update of the outermost band ) and has two intermediate bands that also adjust to daily volatility. Another tool from White Trader that combines price and volume, in addition to mapping the daily amplitude. The external band is updated automatically when the daily maximum or minimum breaks the current frequency, and can be an input signal, seeking a return to the daily vwap. Thus, in addition t
Start Midas Fibo Bands
Ricardo Almeida Branco
Here we have the Start Midas Fibo Bands , I confess that it is an indicator that excited me enough to operate because I was able to find more defined rules. Well, the indicator has the functions of the other indicators of the Start line , which is a possibility to plot several Midas on the screen, you can move the anchor point using keyboard shortcuts and use the legend to differentiate one anchor from another. The rules that I have analyzed for my possible setup are recommended to the entry, st
Prior Lines
Ricardo Almeida Branco
This indicator shows on the current day some lines of interest, such as maximum, minimum and closing of the previous day, as well as the opening, maximum and minimum price of the current day. It can also show the GAP (closing of the previous day and opening of the current day) and projections of the amplitude of the previous day, according to the value you choose in the multiplier. Oh, I was going to forget. It is also possible to determine the time frame, which is daily by default. If this i
Auto Zig HTF Vwap Midas
Ricardo Almeida Branco
5 (1)
The best Vwap Midas coding for Metatrader 5 you can find in White Trader indicators. The indicator has been optimized not to recalculate (improving performance) and has several visual settings for you to adapt in your own way. TRY IT FOR FREE by clicking the free demo button Where and why to use Vwap Midas (and Auto Zig Vwap Midas) can be used on a variety of indices, currencies, forex, cryptocurrencies, stocks, indices and commodities. Many successful traders use price and volume to get the
Danko Trend Color
Ricardo Almeida Branco
The Danko Trend Color indicator is actually a candle coloring to bring practicality, ease and information to your charts. Danko Trend Color combines PRICE AND VOLUME indicators to define the prevailing trend, so the colors are: Blue (indicates an uptrend) Orange (indicates a downtrend) White (indicates undefined trend) I don't like to promise anything with my indicators, I ask you to download, test it for free (for use in backtesting) and see if the indicator can, in some way, help your oper
Danko DTC Panel
Ricardo Almeida Branco
Do not buy before seeing the Danko Trend Color product, as this panel is a way to view a summary of this indicator on various timeframes. The Danko DTC Panel utility allows you to look at the trend in up to 5 timeframes. When clicking on the timeframe texts, a new window will open with the indicator plotted on the screen so you can see the complete chart. The width of the panel, with the amount of candles you want to see, is customizable, see the images below. Ao clicar nos textos dos timeframe
Filtro:
Quantum Trader
3015
Quantum Trader 2021.06.14 17:16 
 

L'utente non ha lasciato alcun commento sulla valutazione.

Ricardo Almeida Branco
10029
Risposta dello sviluppatore Ricardo Almeida Branco 2021.06.14 18:19
Thanks again for your comment MAHMOUD! Good to know that the indicators I develop help you on trades! Success and good trades!
OmarKfoury
37
OmarKfoury 2021.02.25 16:58 
 

L'utente non ha lasciato alcun commento sulla valutazione.

Ricardo Almeida Branco
10029
Risposta dello sviluppatore Ricardo Almeida Branco 2021.05.18 05:10
Grande Omar!
Obrigado pelo comentário! Sucesso e bons trades!
Eduardo Silva Vian
328
Eduardo Silva Vian 2020.11.29 23:35 
 

L'utente non ha lasciato alcun commento sulla valutazione.

Ricardo Almeida Branco
10029
Risposta dello sviluppatore Ricardo Almeida Branco 2021.05.18 05:10
Opa! Vlw Eduardo! Obrigado pelo comentário! Sucesso e bons trades!
Enzo Castelo
56
Enzo Castelo 2020.11.29 19:31 
 

L'utente non ha lasciato alcun commento sulla valutazione.

Ricardo Almeida Branco
10029
Risposta dello sviluppatore Ricardo Almeida Branco 2021.05.18 05:10
Vlw Enzo!
Obrigado pelo comentário! Sucesso e bons trades!
Rispondi alla recensione