Auto Levels Pro

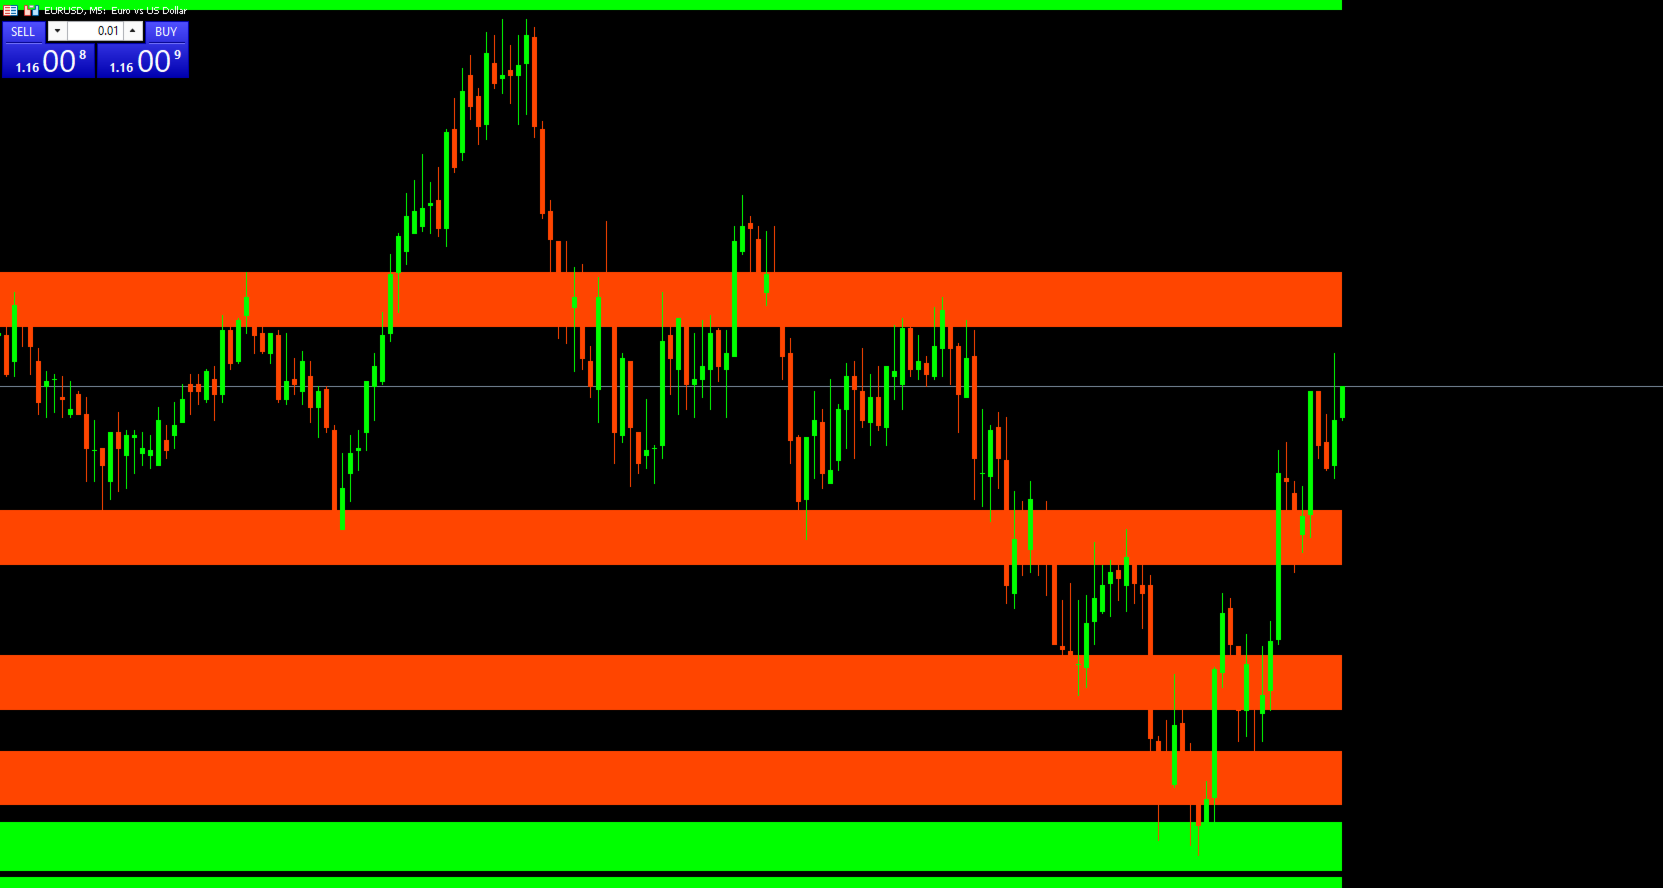
AutoLevelsPro — un indicatore che analizza i dati di prezzo e segna automaticamente zone di supporto e resistenza.
È stato progettato appositamente per funzionare su timeframe bassi, in particolare sul grafico a 15 minuti, dove il mercato mostra le reazioni più dinamiche.

📊 Dati utilizzati:

  • 🔼 High — prezzo massimo della candela
  • 🔽 Low — prezzo minimo della candela
  • 🔚 Close — utilizzato per il calcolo dell’ATR
  • 🕒 Timestamp di ogni candela per posizionare correttamente le zone

⚙️ Processo di analisi:

  • 🔍 Identifica massimi locali (swing high) e minimi (swing low)
  • 📈 Calcola l’ATR per stimare la volatilità e definire la larghezza delle zone
  • 🧩 Raggruppa livelli vicini in zone comuni
  • 🚫 Filtra i livelli deboli in base al numero minimo di tocchi

📍 Origine dei dati:

  • 📊 Dal grafico attivo (rispetta il timeframe selezionato)
  • 📐 Dall’indicatore ATR integrato in MetaTrader (periodo regolato dinamicamente)

🧠 Interpretazione dei risultati:

  • 🟩 Zone verdi = Supporto
  • 🟥 Zone rosse = Resistenza
  • 🔢 Numeri nelle zone = numero di tocchi (più tocchi = livello più forte)
  • 📏 Larghezza della zona = volatilità del mercato (più ampia = maggiore volatilità)

✅ Si adatta automaticamente a diversi timeframe e condizioni di mercato.
Adatto sia al trading Forex che alle opzioni binarie.


Prodotti consigliati
The Volume Weighted ATR indicator is a helpful tool for measuring market activity. It is based on the idea of the Volume-Weighted ATR. Combining these two elements helps identify potential turning points or breakout opportunities. The indicator for the classification of the activity of the market uses the moving average and its multiples. Accordingly, where the VWATR bar is located (relative to the moving average), it is labelled as ultra-low, low, average, high, very high or ultra high. The Vo
FREE
Smart FVG Stats
- Md Rashidul Hasan
The  Smart FVG Statistics Indicator  is a powerful MetaTrader 5 tool designed to automatically identify, track, and analyze Fair Value Gaps (FVGs) on your charts. Love it? Hate it? Let me know in a review! Feature requests and ideas for new tools are highly appreciated. :) Try "The AUDCAD Trader": https://www.mql5.com/en/market/product/151841 Key Features Advanced  Fair Value Gap  Detection Automatic Identification : Automatically scans for both bullish and bearish FVGs across specified histo
FREE
Intraday Vwap Orion
Joao Paulo Botelho Silva
Theory VWAP is a volume-weighted moving average, bringing greater relevance to prices. The VWAP base calculation follows the classic formula described in Investopedia ( https://www.investopedia.com/terms/v/vwap.asp ). VWAP = sum(typical price[i]*volume[i]) / sum(volume[i]) Functionalities Orion Intraday VWAP innovates by allowing the user to choose between the conventional Daily, Weekly and Monthly periods, also having the option of calculating the Intraday indicator, as used in other platform
VP hidden
Emr Aljnaby
4.33 (12)
The indicator works to convert normal volume into levels and determine financial liquidity control points. It is very similar in function to Fixed Volume Profile. But it is considered more accurate and easier to use than the one found on Trading View because it calculates the full trading volumes in each candle and in all the brokers present in MetaTrade, unlike what is found in Trading View, as it only measures the broker’s displayed prices. To follow us on social media platforms: telegram
FREE
Simple Weis Wave
Jean Jacques Huve Ribeiro
3.67 (3)
One of the best tools for analyzing volume, Weis Wave was idelized by David Weis, to facilitate the reading of directional flow. For the VSA method disciples it is an evolution of the practices created by Richard Wycoff, facilitating a predictive reading of the market, always seeking an accumulation and distribution of the negotiated contracts. Cumulative wave volume  Range of wave ( removed) Average Wave volume Ref "Tim Ord lectures" ( removed)
FREE
Basic Vwap
james mugendi
4 (1)
Simple Vwap with the daily, weekly and monthly VWAP is the abbreviation for   volume-weighted average price , which is a technical analysis tool that shows the ratio of an asset's price to its total trade volume. It provides traders and investors with a measure of the average price at which a stock is traded over a given period of time. How it's used Identify entry and exit points:   Traders can use VWAP to determine when to buy or sell an asset.   Understand price trends :  Traders can use V
FREE
Premium https://www.mql5.com/en/market/product/167272 BITCOIN DAILY TOP BOTTOM ENGINE (V1) This is not a simple indicator. This is a professional-grade market observation and decision engine designed for serious Bitcoin traders who demand clarity, structure, and precision. The Bitcoin Daily Top Bottom Engine is built to identify high-probability daily extremes using adaptive range logic, sweep behavior analysis, and market condition filtering. Instead of reacting late, this engine prepares y
FREE
ZoneCore MT5
Frederic Jacques Collomb
ZONECORE — Volume Profile & Pivot Levels Identificate le zone di prezzo più scambiate con precisione chirurgica. MT4 version Che cos'è ZONECORE? ZONECORE è un indicatore di livello professionale che combina il Profilo di Volume (Volume Profile) e i Livelli Pivot ad alto volume (Pivot Levels) per rivelare le zone di prezzo in cui il mercato ha trascorso più tempo e ha scambiato il maggior volume. Queste zone agiscono come magneti per il prezzo — conoscerle vi offre un vantaggio decisivo nell'ide
Hi you, I need your help! Be my Patron, let's make it possible! https://www.patreon.com/joaopeuko https://github.com/Joaopeuko/Mql5-Python-Integration Channel: English version - Versão Inglês: https://www.mql5.com/en/channels/Mql5_Python_Integration_EN Portuguese version - Versão Português: https://www.mql5.com/en/channels/Mql5_Python_Integration_PT Free version with 5 indicators: https://www.mql5.com/en/market/product/57574 This version has 38 indicators, 5 from the free version plus
FREE
Correlation Matrix Pro - Scanner Multi-Valuta per Copertura Comprendi le relazioni tra le coppie di valute in tempo reale! Un potente strumento di analisi che ti aiuta a visualizzare le relazioni statistiche tra fino a 6 coppie di valute contemporaneamente. Perfetto per la gestione del portafoglio, la diversificazione del rischio e le strategie di copertura. CARATTERISTICHE PRINCIPALI - Correlazione di Pearson in tempo reale con rendimenti logaritmici - Monitoraggio di fino a 6 coppie di valute
FREE
Volume Weighted Average Price or VWAP is an indicator wich shows different average prices on chart. This is very useful to find strong negotiation price areas and as trend following. Configurations: Day, Week and Month - Show different VWAPs according to the period. You can change each line style on "colors" tab. Any doubt or suggestion please contact us. Enjoy! This is a free indicator, but it took hours to develop. If you want to pay me a coffee, I appreciate a lot   <3 PayPal, Skrill, Nete
FREE
VWAP and MVWAP
Flavio Javier Jarabeck
3.88 (8)
Volume Weighted Average Price (VWAP) is a trading benchmark commonly used by Big Players that gives the average price a Symbol has traded throughout the day. It is based on both Volume and price. Additionally we put in this indicator the MVWAP (Moving Volume Weighted Average Price). For those who do not know the usage and the importance od this indicator I recommend a great article about this subject at Investopedia ( https://www.investopedia.com/articles/trading/11/trading-with-vwap-mvwap.asp )
FREE
Each VolumeProfile holds: The price range for a given period Buy/sell volume for each price level Calculated POC, VAH, VAL, Delta, and Imbalance Indicator Logic Summary Divide data by timeframe (e.g., one H1 profile per hour). Aggregate volumes for each price level. Separate buy and sell volumes using tick or trade direction. Compute Delta (Buy − Sell) and Imbalance (dominance ≥70%). Detect POC, VAH, VAL to outline the Value Area. Draw graphical profiles beside price candles using color-co
Macro-R Pro Signal — Advanced Trading Signal Indicator Macro-R Pro Signal is a professional trading indicator designed to deliver high-quality BUY and SELL signals with enhanced precision and reduced market noise. By combining Bollinger Bands, RSI, and adaptive volatility filtering , this indicator helps traders identify high-probability reversal points while avoiding unfavorable market conditions. How the Strategy Works This indicator is built on a mean reversion + momentum confirmation concep
FREE
White Weis Volume Ticks
Ricardo Almeida Branco
5 (4)
White Weis Volume This indicator shows the sum of the volume in each wave, bulish or bearish, as idealized by David Weis , but it brings an important addition , which is the marking of the bar with the highest volume of the wave (White Bar)! In coding the indicator, it was sought to optimize the code to require minimal processing during use and not to overload mt5. The indicator can be used for pre-trading analysis and study, where the trader analyzes possible points of support and resistance
Swiss VWAPsimple
Terence Gronowski
4.8 (5)
Swiss VWAPsimple Motivation Did not find free VWAP that works, the one that I found craseh. So I created a VWAP which calculates values only for the actual day. So computer resouces are not over stressed. What is VWAP, how is it used?  VWAP stands for Volume Weighed Average Price, it calculates the running sum of tick volume and the runnung sum of price times tickvolume. The division of these sums result in a weighed price (Sum P*V/Sum V). The calculation starts normally at midnight. The values
FREE
Automatic Vwap Midas
Ricardo Almeida Branco
5 (1)
The 3 Automatic Vwap (Midas) Indicator can be used for Price and Volume studyers to map the movement of market drivers. It automatically plots 3 Vwaps, two of which are dynamic and will be updated throughout the day if new highs or new lows emerge. The third Vwap is daily and can help if the trend is up or down. Also, an auxiliary indicator that plots (also dynamic) points of interest with OHLC prices (Open, High and Low of the current day and Close of the previous day) was inserted. Success and
The VWAP indicator is our version of the popular Volume-Weighted Average Price indicator. The VWAP is the ratio between the value traded (price multiplied by the number of volume traded) and the total volume traded over a specific time period. As a result, it measures the average price of the instrument much better than the simple moving average. Although there are many ways to use the VWAP, most investors use it to calculate the daily average.  The indicator works in five modes: Moving  - In
VWAP Indicator
LUC JACOBUS A VERHEECKE
4.08 (26)
Volume Weighted Average Price (VWAP) The volume weighted average price (VWAP) is a  trading   benchmark  used by traders that gives the average price a security has traded at throughout the day, based on both volume and price. It is important because it provides traders with insight into both the trend and value of a security. This indicator VWAP V2 is free and is the manual version of the extended Easy VWAP indicator (30 Euro), where the date and time properties are automatically entered. With
FREE
The   Real Flow Defense Levels   indicator is a proprietary tool designed to identify and plot   significant, high-conviction price zones   directly onto your main trading chart. It uses a dynamic, volume-based analysis to determine where the market has previously demonstrated the   strongest defense or concentration of activity . These plotted lines serve as   dynamic support and resistance levels , highlighting the prices where major participants are most likely to enter or defend their positi
HTF Candles Nika sovrappone candele a grandezza naturale da qualsiasi timeframe superiore direttamente sul grafico corrente in MetaTrader 5. Offre una visione multi-timeframe chiara senza cambiare grafico. Funzionalita principali - Disegna le candele del timeframe superiore come rettangoli pieni con stoppini sul grafico corrente - Supporta la modalità candele standard e Heiken Ashi - Timer con conto alla rovescia in tempo reale fino alla chiusura della candela HTF corrente - Colori personalizz
FREE
VWAP Diaria
Samuel De Souza Ferreira
Daily VWAP — Institutional Reference for Intraday Value The Daily VWAP is a professional indicator based on the Volume-Weighted Average Price (VWAP) , designed to reveal the true balance between price and volume throughout the trading session. Unlike traditional moving averages, the Daily VWAP incorporates the weight of traded volume in every price movement, providing a much more accurate reference to the behavior of institutional traders and large market participants. What the indicator deliver
FREE
Volume Profile VFX
Thanutchaya Phatsathit
Volume Profile VFX:  Why Choose Volume Profile VFX?  Volume Profile VFX is engineered for traders who demand precision, reliability, and a decisive edge in modern markets — and every future Dynamic Visual Effects (VFX) update is included free for the lifetime of your license.                                     Feature Volume Profile VFX Volume Logic Advanced Data Validation Engine. Verified data accuracy, overriding common broker feed inconsistencies. Data Integrity Non-Repainting & Non-Lagg
MIDAS Super VWAP
Flavio Javier Jarabeck
4.27 (11)
Imagine VWAP, MVWAP and MIDAS in one place... Well, you found it! Now you can track the movement of Big Players in various ways, as they in general pursue the benchmarks related to this measuring, gauging if they had good execution or poor execution on their orders. Traders and analysts use the VWAP to eliminate the noise that occurs throughout the day, so they can measure what prices buyers and sellers are really trading. VWAP gives traders insight into how a stock trades for that day and deter
FREE
Vegas indicador
Valter Cezar Costa
3.5 (2)
Esse Indicador é uma boa opção para quem gosta de operar a longo prazo e com paciência. Ele trabalho com os níveis de fibo na media de 200 são  9 níveis  onde você pode operar nas reversões o mercado partir do níveis abaixo.    Level 1 = 550 pontos    Level 2 = 890 pontos    Level 3 = 1440 pontos    Level 4 = 2330 pontos    Level 5 = 3770 pontos    Level 7 = 9870 pontos    Level 8 = 15970 pontos   Level 9 = 25840 pontos      Level 6 = 6100 pontos
FREE
Weis Waves è un indicatore tecnico sviluppato da David Weis, ispirato ai principi di Richard Wyckoff. A differenza del volume tradizionale, mostrato barra per barra, Weis Waves accumula il volume in “onde” rialziste o ribassiste, ricominciando il conteggio ogni volta che il prezzo cambia direzione. Questo metodo consente al trader di vedere chiaramente la vera forza del movimento di mercato, poiché ogni onda riflette l’intensità del volume che sostiene la sequenza di candele. Caratteristiche
FREE
Stackable VWAP
Flavio Javier Jarabeck
3.5 (4)
Volume Weighted Average Price (VWAP) is a trading benchmark commonly used by Big Players that gives the average price a Symbol has traded throughout the day. It is based on both Volume and price. Additionally we put in this indicator the MVWAP (Moving Volume Weighted Average Price). For those who do not know the usage and the importance od this indicator I recommend a great article about this subject at Investopedia ( https://www.investopedia.com/articles/trading/11/trading-with-vwap-mvwap.asp
FREE
AvgVolumes
Marco Montemari
5 (1)
This indicator is based on Volumes standard indicator, calculates the average of Volumes based on the last N bars set by users, and if the value of the volume is bigger then a set % respect the average a different color will be used. The indicator is shown in a separate indicator window. This version has now a limitation in setting the % about the threshold. If you are interested to set threshold consider to buy the PRO version ( https://www.mql5.com/en/market/product/35925 ) If you want to use
FREE
CTJM Candle Timer
Jivarajah Tharamarajah
5 (2)
The CTJM Candle Timer Indicator is a robust tool developed for traders who use MetaTrader 5. Designed with precision, it displays the remaining time for the current candle on a trading chart, enabling traders to monitor the market more effectively and make timely decisions. With a customizable visual interface, users can adjust colors, font sizes, and positioning to suit their preferences. Some key features of this indicator include: Real-Time Candle Countdown: Keeps traders informed of the exa
FREE
MW Volume
Martin Bittencourt
3.8 (5)
The Martinware Volume indicator plots a colored moving average over volume bars. The coloring uses three colors and can be done in different ways choosable by the user and is applied both to the average as to the volume bars. Three types of coloring are possible: None: no coloring is done Increasing or decreasing: changes the color depending on the current value being bigger or lesser than the previous one Volume relative to average: colors vary if the current volume is bigger or lesser then
FREE
Gli utenti di questo prodotto hanno anche acquistato
Azimuth Pro
Ottaviano De Cicco
5 (6)
Azimuth Pro V2: Synthetic Fractal Structure and Confirmed Entries for MT5 Overview Azimuth Pro is a multi-level swing structure indicator by Merkava Labs . Four nested swing layers, swing-anchored VWAP, ABC pattern detection, three-timeframe structural filtering, and closed-bar confirmed entries — one chart, one workflow from micro-swings to macro-cycles. This is not a blind signal product. It is a structure-first workflow for traders who care about location, context, and timing. V2 Launch Offe
Entry In The Zone and SMC Multi Timeframe is a real-time 2-in-1 market analysis tool that combines market structure analysis and a No Repaint BUY / SELL signal system into a single indicator, built on Smart Money Concepts (SMC) — a widely adopted framework used by professional traders to understand market structure. This indicator helps you see the market more clearly, make decisions based on structure rather than guesswork, and focus on high-probability zones where price is more likely to react
Divergence Bomber
Ihor Otkydach
4.9 (86)
Ogni acquirente dell’indicatore riceverà inoltre gratuitamente: L’utilità esclusiva “Bomber Utility”, che gestisce automaticamente ogni operazione, imposta i livelli di Stop Loss e Take Profit e chiude le posizioni secondo le regole della strategia I file di configurazione (set file) per adattare l’indicatore a diversi asset I set file per configurare il Bomber Utility in tre modalità: “Rischio Minimo”, “Rischio Bilanciato” e “Strategia di Attesa” Una guida video passo-passo per installare, conf
FX Trend MT5 NG
Daniel Stein
5 (4)
FX Trend NG: La Nuova Generazione di Intelligenza di Trend Multi-Mercato Panoramica FX Trend NG è uno strumento professionale di analisi del trend multi-timeframe e monitoraggio dei mercati. Ti consente di comprendere la struttura completa del mercato in pochi secondi. Invece di passare tra numerosi grafici, puoi identificare immediatamente quali strumenti sono in trend, dove il momentum sta diminuendo e dove esiste un forte allineamento tra i timeframe. Offerta di Lancio – Ottieni FX Trend NG
Se acquisti questo indicatore, riceverai il mio Trade Manager Professionale + EA  GRATUITAMENTE. Innanzitutto è importante sottolineare che questo sistema di trading è un indicatore Non-Repainting, Non-Redrawing e Non-Lagging, il che lo rende ideale sia per il trading manuale che per quello automatico. Corso online, manuale e download di preset. Il "Sistema di Trading Smart Trend MT5" è una soluzione completa pensata sia per i trader principianti che per quelli esperti. Combina oltre 10 indicat
Meridian Pro
Ottaviano De Cicco
5 (1)
Meridian Pro: Professional Multi-Timeframe Trend Matrix for MT5 Overview Meridian Pro is a multi-timeframe trend matrix by Merkava Labs that compresses directional state, strength, momentum condition and matrix agreement into one compact panel. One adaptive engine, applied consistently from M1 to W1. No per-symbol tuning. No indicator stacking. One structured readout across every asset and every timeframe. Launch Offer — Get Meridian Pro for USD 99 (introductory). Regular price: USD 149. 1. Why
Quantum TrendPulse
Bogdan Ion Puscasu
5 (23)
Ecco   Quantum TrendPulse   , lo strumento di trading definitivo che combina la potenza di   SuperTrend   ,   RSI   e   Stocastico   in un unico indicatore completo per massimizzare il tuo potenziale di trading. Progettato per i trader che cercano precisione ed efficienza, questo indicatore ti aiuta a identificare con sicurezza le tendenze di mercato, i cambiamenti di momentum e i punti di entrata e uscita ottimali. Caratteristiche principali: Integrazione SuperTrend:   segui facilmente l'andame
OmniSync Projection
Antonio-alin Teculescu
5 (1)
Chronos Fractal Engine is an innovative price projection indicator for MetaTrader 5, designed to transform your technical analysis by intelligently identifying and projecting historical price patterns. Built upon an advanced correlation algorithm and the fractal principles of the market, this powerful tool visualizes potential future price movements, giving you a unique edge in your trading decisions. What is Chronos Fractal Engine? At its core, the Chronos Fractal Engine employs a sophisticat
ARICoins
Temirlan Kdyrkhan
ARICoin is a powerful trading companion designed to generate high-probability entry signals with dynamic TP/SL/DP levels based on volatility. Built-in performance tracking shows win/loss stats, PP1/PP2 hits, and success rates all updated live. Key Features: Buy/Sell signals with adaptive volatility bands Real-time TP/SL/DP levels based on ATR Built-in MA Filter with optional ATR/StdDev volatility Performance stats panel (Success, Profit/Loss, PP1/PP2) Alerts via popup, sound, push, or email Cust
Scopri quale strategia funziona davvero sul tuo simbolo - prima di rischiare denaro reale. Power Bar rileva le barre di prezzo estreme su qualsiasi simbolo e qualsiasi timeframe, poi esegue istantaneamente il backtest di 3 diverse strategie di trading per confrontare tassi di vincita, fattori di profitto e P&L fianco a fianco. Tutto in un unico pannello interattivo. Niente supposizioni. Niente curve-fitting. Solo dati. Cosa rende Power Bar unico? La maggior parte degli indicatori fornisce un se
Btmm state engine pro
Garry James Goodchild
5 (4)
BTMM State Engine Pro is a MetaTrader 5 indicator for traders who use the Beat The Market Maker approach: Asian session context, kill zone timing, level progression, peak formation detection, and a multi-pair scanner from a single chart. It combines cycle state logic with a built-in scanner dashboard so you do not need the same tool on many charts at once. What it does Draws the Asian session range; session times can follow broker server offset or be set in inputs. Tracks level progression (L
FX Power MT5 NG
Daniel Stein
5 (31)
FX Power: Analizza la Forza delle Valute per Decisioni di Trading Più Intelligenti Panoramica FX Power è lo strumento essenziale per comprendere la reale forza delle principali valute e dell'oro in qualsiasi condizione di mercato. Identificando le valute forti da comprare e quelle deboli da vendere, FX Power semplifica le decisioni di trading e rivela opportunità ad alta probabilità. Che tu segua le tendenze o anticipi inversioni utilizzando valori estremi di Delta, questo strumento si adatta
Innanzitutto, vale la pena sottolineare che questo Strumento di Trading è un Indicatore Non-Ridipingente, Non-Ridisegnante e Non-Laggante, il che lo rende ideale per il trading professionale. Corso online, manuale utente e demo. L'Indicatore Smart Price Action Concepts è uno strumento molto potente sia per i nuovi che per i trader esperti. Racchiude più di 20 utili indicatori in uno solo, combinando idee di trading avanzate come l'Analisi del Trader del Circolo Interno e le Strategie di Tradin
Presentazione       Quantum Breakout PRO   , l'innovativo indicatore MQL5 che sta trasformando il modo in cui scambi le zone di breakout! Sviluppato da un team di trader esperti con un'esperienza di trading di oltre 13 anni,       Quantum Breakout PRO       è progettato per spingere il tuo viaggio di trading a nuovi livelli con la sua strategia innovativa e dinamica della zona di breakout. Quantum Breakout Indicator ti fornirà frecce di segnalazione sulle zone di breakout con 5 zone target di
Grabber System MT5
Ihor Otkydach
4.83 (23)
Ti presento un eccellente indicatore tecnico: Grabber, che funziona come una strategia di trading "tutto incluso", pronta all’uso. In un solo codice sono integrati strumenti potenti per l’analisi tecnica del mercato, segnali di trading (frecce), funzioni di allerta e notifiche push. Ogni acquirente di questo indicatore riceve anche gratuitamente: L’utility Grabber: per la gestione automatica degli ordini aperti Video tutorial passo dopo passo: per imparare a installare, configurare e utilizzare
Bill Williams Advanced
Siarhei Vashchylka
5 (11)
Bill Williams Advanced is designed for automatic chart analysis using Bill Williams' "Profitunity" system. The indicator analyzes four timeframes at once. Manual (Be sure to read before purchasing) Advantages 1. Analyzes the chart using Bill Williams' "Profitunity" system. Signals are displayed in a table in the corner of the screen and on the price chart. 2. Finds all known AO and AC signals, as well as zone signals. Equipped with a trend filter based on the Alligator. 3. Finds "Divergence Bar
Atomic Analyst MT5
Issam Kassas
3.94 (31)
Innanzitutto, vale la pena sottolineare che questo indicatore di trading non è repaint, non è ridisegno e non presenta ritardi, il che lo rende ideale sia per il trading manuale che per quello automatico. Manuale utente: impostazioni, input e strategia. L'Analista Atomico è un indicatore di azione del prezzo PA che utilizza la forza e il momentum del prezzo per trovare un miglior vantaggio sul mercato. Dotato di filtri avanzati che aiutano a rimuovere rumori e segnali falsi, e aumentare il pote
RelicusRoad Pro: Sistema Operativo Quantitativo di Mercato 70% DI SCONTO ACCESSO A VITA (TEMPO LIMITATO) - UNISCITI A 2.000+ TRADER Perché la maggior parte dei trader fallisce anche con indicatori "perfetti"? Perché operano su Singoli Concetti isolati. Un segnale senza contesto è una scommessa. Per vincere serve CONFLUENZA . RelicusRoad Pro non è un semplice indicatore. È un Ecosistema Quantitativo completo . Mappa la "Fair Value Road", distinguendo tra rumore e rotture strutturali. Smetti di in
Berma Bands
Muhammad Elbermawi
5 (8)
L'indicatore Berma Bands (BBs) è uno strumento prezioso per i trader che cercano di identificare e capitalizzare i trend di mercato. Analizzando la relazione tra il prezzo e le BBs, i trader possono discernere se un mercato è in una fase di trend o di range. Visita il [ Berma Home Blog ] per saperne di più. Le Berma Bands sono composte da tre linee distinte: la Upper Berma Band, la Middle Berma Band e la Lower Berma Band. Queste linee sono tracciate attorno al prezzo, creando una rappresentazion
ARIPoint
Temirlan Kdyrkhan
ARIPoint is a powerful trading companion designed to generate high-probability entry signals with dynamic TP/SL/DP levels based on volatility. Built-in performance tracking shows win/loss stats, PP1/PP2 hits, and success rates all updated live. Key Features: Buy/Sell signals with adaptive volatility bands Real-time TP/SL/DP levels based on ATR Built-in MA Filter with optional ATR/StdDev volatility Performance stats panel (Success, Profit/Loss, PP1/PP2) Alerts via popup, sound, push, or email Cu
ICT PO3 (Power of 3) AMD Protocol Framework Indicator True Time & Structure Integration   |  Non-Repainting | Real-Time  | Multi-Asset  | MT4 Version Available Full Setup Guide & Strategy Playbook: https://www.mql5.com/en/blogs/post/768683 MT4 Version: https://www.mql5.com/en/market/product/171742 Indicator Overview The ICT PO3 AMD Protocol Framework is a complete structural overlay for MetaTrader 5 that maps the True Daily Cycle directly onto your lower-timeframe execution chart. It projects
Trend indicator AI mt5
Ramil Minniakhmetov
5 (16)
Trend Ai indicator è un ottimo strumento che migliorerà l'analisi di mercato di un trader combinando l'identificazione della tendenza con punti di ingresso utilizzabili e avvisi di inversione. Questo indicatore consente agli utenti di navigare nelle complessità del mercato forex con fiducia e precisione Oltre ai segnali primari, l'indicatore Ai di tendenza identifica i punti di ingresso secondari che si presentano durante i pullback o i ritracciamenti, consentendo ai trader di capitalizzare le
PZ Support Resistance MT5
PZ TRADING SLU
3.71 (7)
Unlock key market insights with automated support and resistance lines Tired of plotting support and resistance lines? This is a multi-timeframe indicator that detects and plots supports and resistance lines in the chart with the same precision as a human eye would. As price levels are tested over time and its importance increases, the lines become thicker and darker, making price leves easy to glance and evaluate. [ Installation Guide | Update Guide | Troubleshooting | FAQ | All Products ] Boos
RFI levels PRO MT5
Roman Podpora
3.67 (3)
L'indicatore mostra accuratamente i punti di inversione e le zone di ritorno dei prezzi in cui il       Principali attori   . Vedi dove si formano le nuove tendenze e prendi decisioni con la massima precisione, mantenendo il controllo su ogni operazione. VERSION MT4     -    Rivela il suo massimo potenziale se combinato con l'indicatore   TREND LINES PRO Cosa mostra l'indicatore: Strutture di inversione e livelli di inversione con attivazione all'inizio di un nuovo trend. Visualizzazione dei li
Currency Strength Dashboard Pro Pannello professionale di analisi della forza delle valute in tempo reale per MetaTrader 5 . L’indicatore calcola e visualizza la forza di 8 valute principali (EUR, USD, GBP, JPY, CHF, AUD, CAD, NZD) utilizzando 28 coppie di valute simultaneamente su più timeframe. Il pannello offre al trader una visione completa del mercato a colpo d’occhio — senza calcoli aggiuntivi né la necessità di passare tra diversi grafici. Metodo di calcolo L’indicatore si basa su un meto
Gartley Hunter Multi
Siarhei Vashchylka
5 (11)
Gartley Hunter Multi - An indicator for searching for harmonic patterns simultaneously on dozens of trading instruments and on all possible timeframes. Manual (Be sure to read before purchasing) | Version for MT4 Advantages 1. Patterns: Gartley, Butterfly, Shark, Crab. Bat, Alternate Bat, Deep Crab, Cypher 2. Simultaneous search for patterns on dozens of trading instruments and on all possible timeframes 3. Search for patterns of all possible sizes. From the smallest to the largest 4. All fou
TPA True Price Action indicator reveals the true price action of the market makers through 100% non-repainting signals strictly at the close of a candle! TPA shows entries and re-entries, every time the bulls are definitely stronger than the bears and vice versa. Not to confuse with red/green candles. The shift of power gets confirmed at the earliest stage and is ONE exit strategy of several. There are available now two free parts of the TPA User Guide for our customers. The first "The Basics"
La maggior parte degli indicatori sull'oro ti mostra dove il movimento era. Aurum Apex ti mostra dove sta andando — prima che la maggioranza entri. Non è un'affermazione. È l'architettura. Cos'è Aurum Apex? Aurum Apex è un indicatore di scalping XAUUSD senza ridisegno per MetaTrader 5 , costruito esclusivamente attorno a un solo strumento — l'Oro — e progettato per identificare il momentum di breakout nel suo punto di origine, prima che l'espansione del prezzo raggiunga la piena velocità. Non ri
Weltrade Spike Sentinel
Batsirayi L Marango
5 (1)
Introducing Indicator for PainX and GainX Indices Traders on Weltrade Get ready to experience the power of trading with our indicator, specifically designed for Weltrade   broker's PainX and GainX Indices.  Advanced Strategies for Unbeatable Insights Our indicator employs sophisticated strategies to analyze market trends, pinpointing optimal entry and exit points.  Optimized for Maximum Performance To ensure optimal results, our indicator is carefully calibrated for 5-minute timeframe charts on
Easy SMC Trading
Israr Hussain Shah
3 (2)
Structure Trend con Auto RR e Scanner BOS Versione: 1.0 Panoramica Structure Trend con Auto RR è un sistema di trading completo progettato per i trader che si affidano all'azione del prezzo e alla struttura del mercato. Combina un filtro di tendenza levigato con il rilevamento dei punti swing e i segnali di rottura della struttura (BOS) per generare configurazioni di trading ad alta probabilità. La caratteristica distintiva di questo strumento è la gestione automatica del rischio. Al rilevame
Altri dall’autore
️ Power Moving Average Signals Panoramica: Power Moving Average Signals è una strategia di trading basata sul trend che utilizza l’incrocio di due medie mobili — una veloce e una lenta — per generare segnali chiari di acquisto e vendita : Segnale di acquisto : quando la media mobile veloce incrocia quella lenta dal basso verso l’alto Segnale di vendita : quando la media mobile veloce incrocia quella lenta dall’alto verso il basso Ottimizzata per le coppie di valute: Questa strategia f
️ Ichimoku Kinko Hyo System Uno strumento intelligente per un’analisi di mercato precisa ed efficace Questo indicatore si basa sul collaudato sistema Ichimoku Kinko Hyo , offrendo una visione completa della struttura del mercato, della sua dinamica e dei potenziali movimenti di prezzo. È progettato per aiutare i trader a prendere decisioni rapide grazie a segnali visivi chiari. Caratteristiche principali: Alta precisione grazie all’analisi avanzata del mercato su più timeframe ️ Pa
Clever Parabolic RSI Un oscillatore intelligente che combina Parabolic SAR e RSI per segnali di mercato precisi Questo oscillatore unisce la potenza di due indicatori tecnici molto apprezzati — Parabolic SAR e RSI — creando un sistema intelligente che mostra chiaramente lo stato del mercato , la forza del trend e fornisce segnali visivi affidabili di acquisto o vendita. Come funziona: Un punto quadrato verde indica l’inizio di un trend rialzista Un punto quadrato rosso segnala l’ini
Power Market Strength Panel Pro – Un unico pannello con tutti gli indicatori chiave Power Market Strength Panel Pro non è un semplice indicatore. È uno strumento di trading avanzato che combina diversi indicatori tecnici fondamentali e analizza automaticamente il mercato per te. Include i seguenti indicatori principali: EMA (Media Mobile Esponenziale) – determina la direzione del trend ADX + DI+/- – misura la forza del trend e la pressione di acquisto/vendita RSI (Indice di Forza Relativa
TREND REVERSAL SIGNALS – segnali precisi di inversione di tendenza TREND REVERSAL SIGNALS è un indicatore avanzato progettato per identificare i punti di inversione del trend con la massima precisione. Analizza i dati di prezzo (OHLC) e riconosce le principali formazioni di candele che segnalano possibili cambiamenti di direzione. Combinando price action, volatilità (ATR) e struttura del mercato, fornisce chiari segnali di ACQUISTO o VENDITA direttamente sul grafico. Fondamenti analitici:
AutoLevels – Rilevamento intelligente di supporti e resistenze AutoLevels è un indicatore avanzato che identifica automaticamente le zone chiave del mercato utilizzando i dati del grafico in tempo reale. Analizza i punti di swing (massimi e minimi locali) , la volatilità del mercato (ATR) e le reazioni ripetute del prezzo per individuare livelli di supporto e resistenza affidabili. Basato su: Swing High e Swing Low con sensibilità regolabile (LeftBars e RightBars) Larghezza dinamica delle
Buyer Seller Balance Analyzer offre una panoramica completa della forza di acquirenti e venditori su diversi timeframe. Componenti principali: Tabella Buyer/Seller Balance Mostra il rapporto tra acquirenti e venditori Copre i timeframe da M1 a MN1 Valori codificati a colori (verde = acquirenti, rosso = venditori) Metriche chiave: Buyers (%) – Percentuale di acquirenti Sellers (%) – Percentuale di venditori ️ Balance – Differenza tra acquirenti e venditori Strength –
Buyer Seller Arrows – Opera con fiducia! Scopri uno strumento rivoluzionario per l’analisi visiva della forza di acquirenti e venditori su tutti i timeframe – da M1 fino a MN1. Questo indicatore ti offre una panoramica immediata della dinamica del mercato grazie a percentuali e frecce codificate a colori. Funzionalità principali: Frecce verdi verso l’alto = predominanza degli acquirenti Frecce rosse verso il basso = predominanza dei venditori Percentuale di forza per ogni timeframe (M1, M5
MACD Ultra Pro v3.1 – Più di un semplice MACD MACD Ultra Pro v3.1 non è un MACD standard. È una versione notevolmente migliorata che integra un’analisi approfondita dei dati in tempo reale. Questo indicatore non si limita a seguire i movimenti attuali dei prezzi: analizza anche la storia del mercato e, sulla base di essa, fornisce una visione predittiva delle tendenze future. Cosa lo distingue dal MACD tradizionale Analisi dei dati in tempo reale – elabora non solo i dati di prezzo, ma anche
Filtro:
Nessuna recensione
Rispondi alla recensione