Linear Trend Predictor MT5

Linear Trend Predictor : indicatore di tendenza che combina punti di ingresso e linee di supporto direzionale. Funziona secondo il principio di rottura del canale dei prezzi alto/basso.
L'algoritmo dell'indicatore filtra il rumore di mercato, tiene conto della volatilità e delle dinamiche di mercato.

Capacità dell'indicatore

  • Utilizzando metodi di smoothing, mostra l'andamento del mercato e i punti di ingresso per l'apertura di ordini di ACQUISTO o VENDITA.
  • Adatto per determinare i movimenti di mercato a breve e lungo termine analizzando i grafici su qualsiasi intervallo di tempo.
  • Adattabili a qualsiasi mercato e intervallo di tempo, i parametri di input consentono al trader di personalizzare autonomamente l'indicatore.
  • Il segnale indicatore impostato non scompare e non viene ridisegnato: viene determinato alla chiusura della candela.
  • Diversi tipi di notifiche sono combinati con le frecce.
  • L'indicatore può essere utilizzato come sistema di trading indipendente, oppure come aggiunta ad altri sistemi di trading.
  • Può essere utilizzato da trader con qualsiasi livello di esperienza.


Parametri principali
Volatility Smoothing Level : il parametro principale dell'indicatore che consente di configurare l'indicatore per un funzionamento confortevole.
Presenta un intervallo di numeri da 1 a 100, aumentando così la fluidità con cui è possibile ottenere movimenti di tendenza più lunghi.
Con numeri piccoli è possibile ottenere movimenti a breve termine con una rapida uscita dalle negoziazioni.

Momenti di trading con l'indicatore:

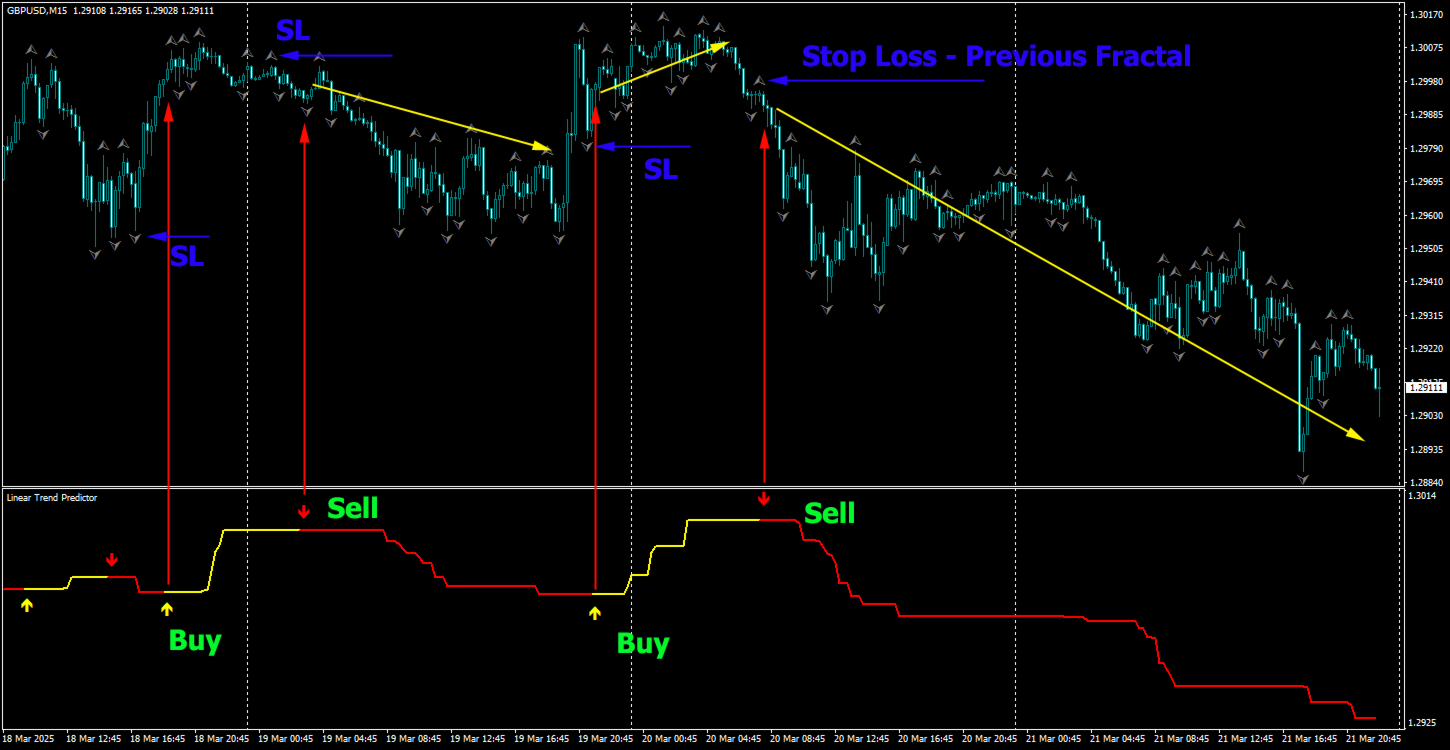
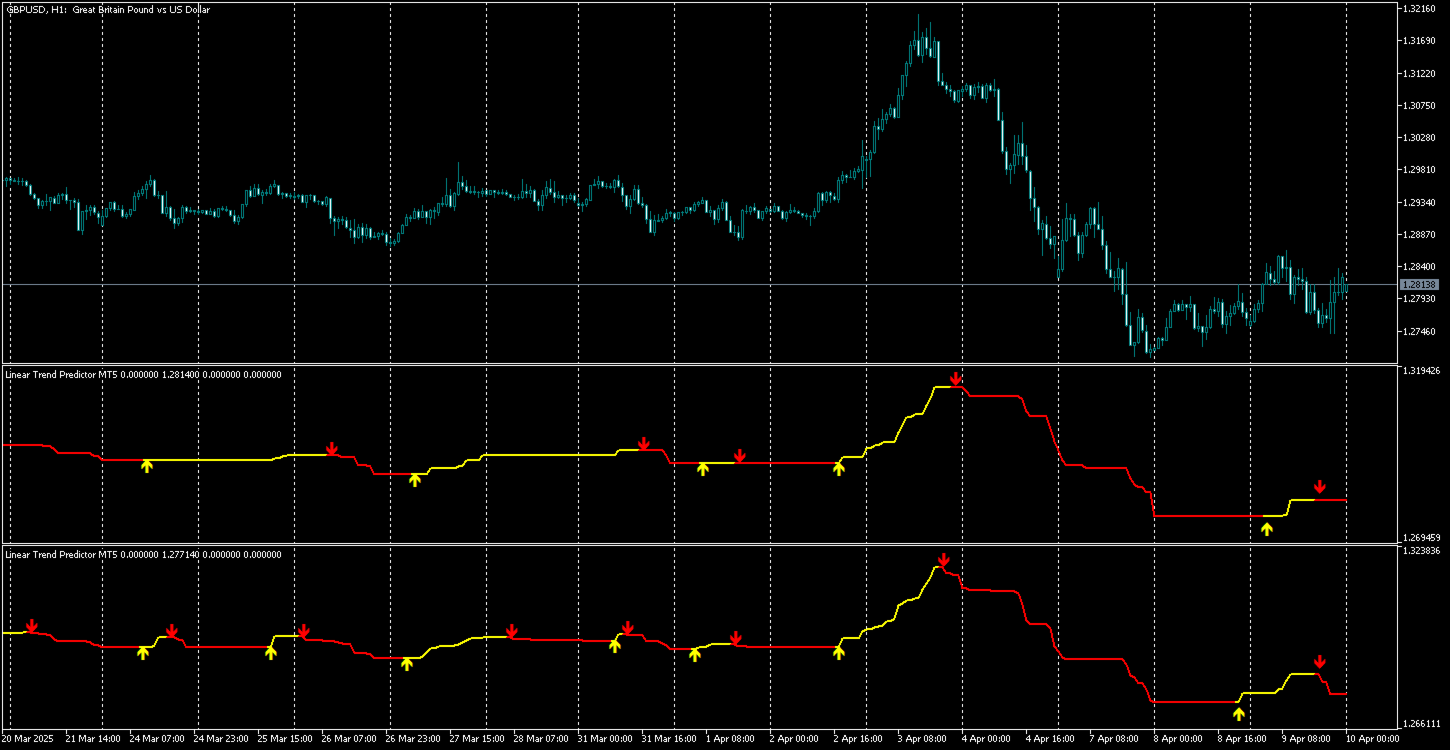
  1. Linee e frecce rosse per segnali di apertura di tendenza al ribasso e di vendita. Lo stop loss dovrebbe essere impostato in base al frattale superiore precedente.
  2. Linee e frecce gialle per segnali di apertura di trend rialzista e di acquisto. Lo stop loss dovrebbe essere impostato in base al frattale inferiore precedente.
  3. L'indicatore Fractals è integrato nel terminale MT4.
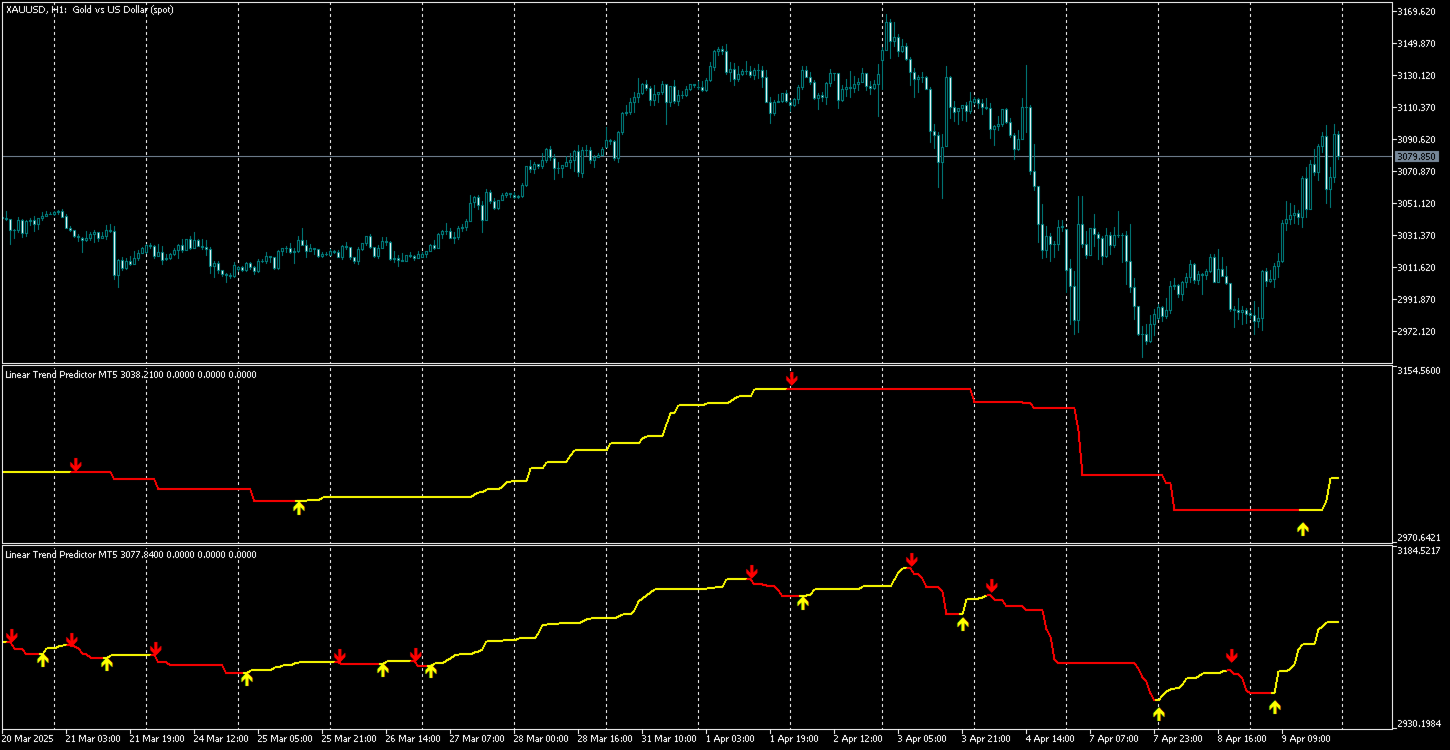
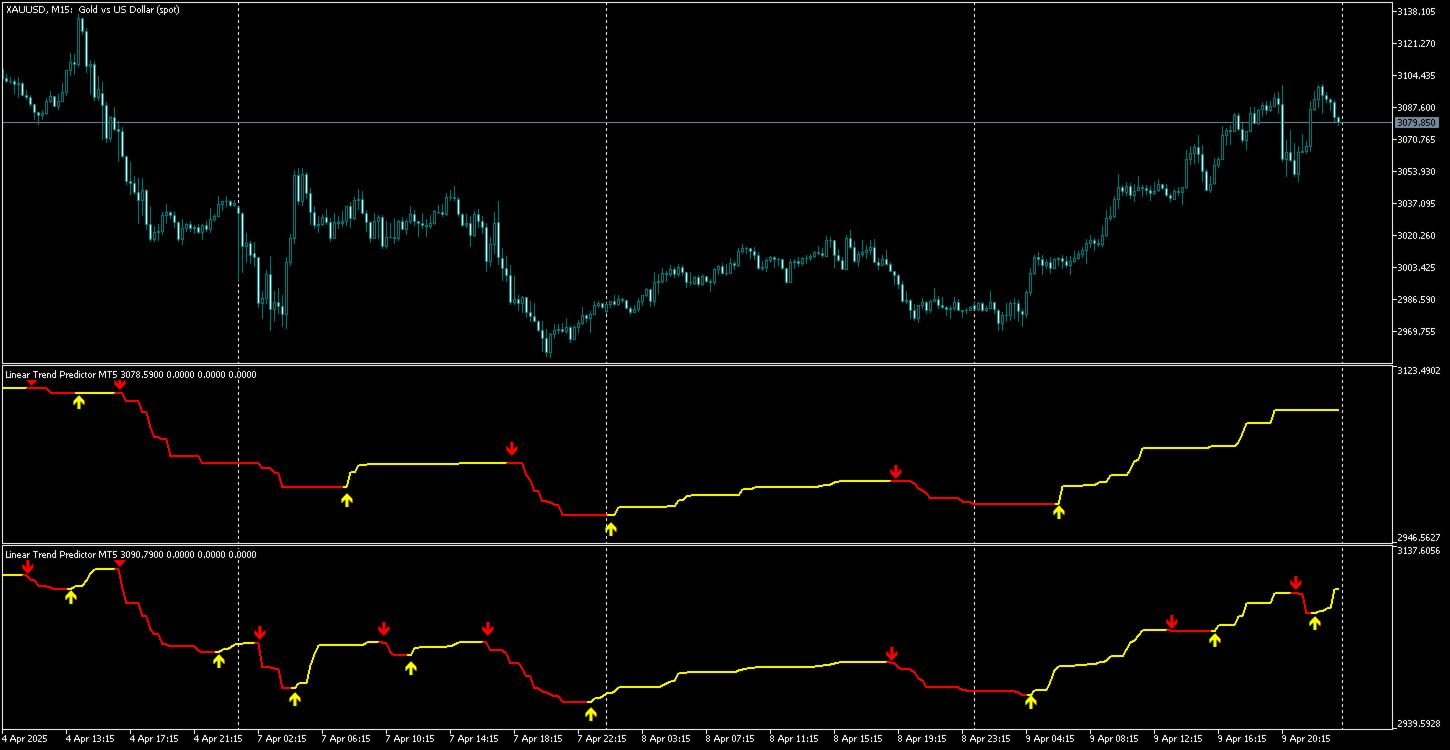
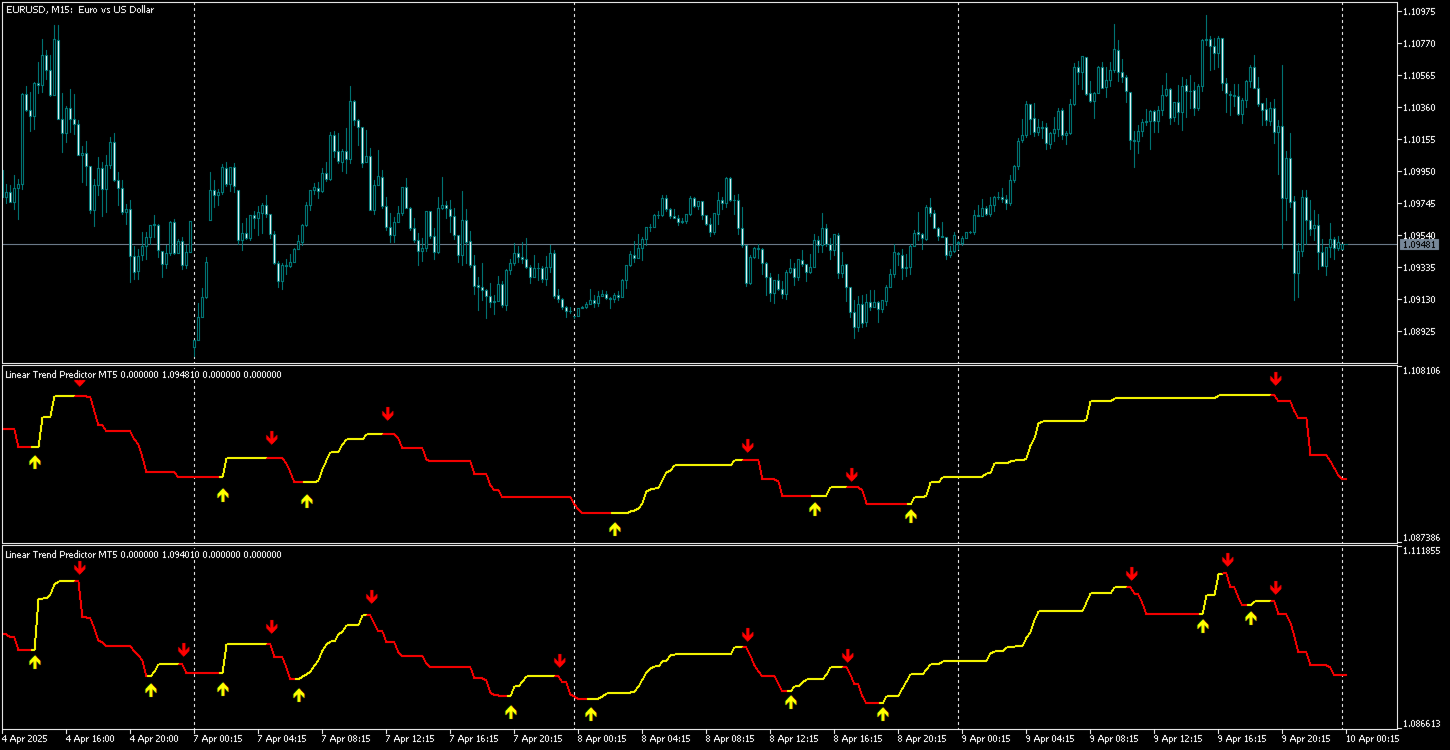
  4. Nel trading a lungo e medio termine, mantieni le posizioni aperte finché non appare un segnale opposto. (Utilizzando un'ampia levigatura)
  5. Per il trading a breve termine, utilizzare 2 indicatori con diversi parametri di smoothing: con smoothing elevato per determinare la tendenza e con smoothing minimo per aprire e chiudere le posizioni.

Prodotti consigliati
Rocket Trend
Andriy Sydoruk
The Rocket Trend indicator is trending. The indicator draws two-color points connected by lines along the chart. This is a trend indicator, it is an algorithmic indicator. It is easy to work and understand when a blue circle appears, you need to buy, when a red one appears, sell. The indicator is used for scalping and pipsing, and has proven itself well. Rocket Trend is available for analyzing the direction of the trend for a specific period of time. Ideal for novice traders learning the laws o
Manyal trading system, CovEchoTrend Robot, focuses on reliability and flexibility. By employing statistical analysis methods to study the relationships between the base indicator and market patterns, the system enables a deeper understanding of market processes. Intelligent pattern analysis: The application of statistical data processing helps identify key trend reversal points more accurately, signaling significant market shifts. Informed decision-making is based on the intersection of indicato
Questo indicatore è un indicatore per l'analisi automatica delle onde perfetto per il trading pratico! Caso... Nota:   non sono abituato a usare nomi occidentali per la classificazione delle onde a causa dell'influenza della convenzione di denominazione di Tang Lun (Tang Zhong Shuo Zen), ho chiamato l'onda base come   penna   e la banda dell'onda secondaria come   segmento   At allo stesso tempo, il segmento ha la direzione del trend. La denominazione   è principalmente segmento di trend   (que
Xtrade Trend Detector
Dago Elkana Samuel Dadie
Xtrade Trend Detector is an indicator capable of finding the best opportunities to take a position in any stock market. Indeed, it is a great tool for scalpers but also for Daytraders. You could therefore use it to identify areas to trade, it fits easily on a chart. I use it to detect trends on Big timeframes and take positions on Small timeframes. Don't hesitate to give me a feedback if you test it.
Visual Trend Reversals — Professional Trend Reversal Indicator for MetaTrader 5 Visual Trend Reversals is a modern and efficient indicator for MetaTrader 5, specifically designed for the timely identification of trend reversal points and analysis of market conditions on any instrument: forex, cryptocurrencies, stocks, indices, and commodities. The indicator is optimized to improve entry quality, minimize false signals, and maximize clarity for traders of any experience level. Key Advantages of V
Optimized Spike Detector Pro for MT5 is a professional-grade technical indicator designed to identify and capitalize on sharp, impulsive price movements (spikes) in any financial instrument. Utilizing a sophisticated, multi-algorithmic core, it distinguishes significant volatility expansions from market noise with exceptional accuracy. The tool dynamically adapts to changing market conditions, filtering out false signals and highlighting only high-probability spike setups in real-time. Featuring
Frontier Pivots
Nestor Jose Mendez Boza
FRONTIER PIVOTS - Geometric Levels Indicator This indicator plots support and resistance levels/ranges on the chart using mathematical calculations. It helps traders identify potential price reaction zones based on geometric patterns. Main Features: Automatically calculates and displays key price levels Plots both support and resistance lines Uses daily price data for level calculation Clean visual presentation with different colors for different level types No repainting - levels remain static
FXLAND Smart Reversal Indicator (MT5) FXLAND Smart Reversal Indicator is a professional technical analysis tool designed to help traders identify potential price reversal zones and key market turning points with clarity and precision. The best reversal indicator and price return by choosing only one ceiling or floor in each time frame A masterpiece of combining mathematics and Gann, fractal matrix, Fibonacci, movement angle and time. Completely intelligent Key Features Detects potenti
Skiey
Vitalii Zakharuk
Skiey - Indicator of easy solutions! Using this indicator is very simple, since the simplest is to look at the chart and act according to the color arrows. Such a calculation option takes into account intraday price fluctuations and focuses on measuring the "candlestick" share in the trend. The algorithm takes into account the measurement of prices, this method also emphasizes the measurement of each of the price drops (H / C, H / O, LC, LO) - which gives more detailed information but also mor
Liquidity Map
Alex Amuyunzu Raymond
Liquidity Map  Overview The Liquidity Map indicator is an advanced visualization tool based on ICT Smart Money Concepts . It automatically identifies daily Buy Zones , Sell Zones , and Liquidity Levels , showing where price is likely to reverse or continue based on institutional order flow. It calculates key levels from the daily session — such as the previous day’s high, low, and midpoint — then derives a premium (sell bias) and discount (buy bias) structure. When price trades into these mapped
Orderflow Super Candles - Simple Footprint Chart Indicator Platform: MetaTrader 5 (MT5)  (The last screenshot shows the use of the DOM tool in conjunction with the product.) 1. Product Introduction Orderflow Super Candles is a professional charting tool based on underlying Tick data analysis, designed to provide traders with a deep "X-ray" view of the market. By parsing the buy and sell volume distribution within each candlestick, this indicator visualizes the hidden market microstructure. It
I recommend you to read the  product's blog  (manual) from start to end so that it is clear from the beginning what the indicator offers. This multi time frame and multi symbol supply and demand zone dashboard indicator sends alerts when the price has reached a supply/demand zone. It is also possible to use it to be alerted about regular double tops/bottoms instead of zones. It can be used with all time frames from M1 to MN. Maximum 9 time frames can be shown in the dashboard at the same time. 
Indicatore Media Mobile Multi-Timeframe Sblocca una comprensione più profonda delle tendenze del mercato con l'Indicatore Media Mobile Multi-Timeframe. Questo potente strumento MQL5 ti consente di visualizzare le medie mobili di cinque diversi timeframe contemporaneamente su un singolo grafico. Ottieni intuizioni complete sulla dinamica dei prezzi da varie prospettive senza ingombrare il tuo spazio di lavoro con più istanze dell'indicatore. Caratteristiche Principali: Analisi Multi-Timeframe: Vi
Go Binary
Fabio Oliveira Magalhaes
The main idea of this product is to generate statistics based on signals from 5 different strategies for the Binary Options traders, showing how the results would be and the final balance based on broker's payout. Strategy 1: The calculation is secret. Strategy 2: The signal is based on a sequence of same side candles (same color). Strategy 3: The signal is based on a sequence of interspersed candles (opposite colors). Strategy 4: The signal consists of the indicators bollinger (we have 3 type
ADR/AWR/AMR Lines Indicator - Professional Range Boundary Display Advanced Multi-Timeframe Range Analysis Tool for Professional Traders Overview The ADR/AWR/AMR Lines Indicator is a sophisticated visual analysis tool that displays dynamic range boundaries across multiple timeframes on your chart. This professional-grade indicator calculates and projects Average Daily Range (ADR), Average Weekly Range (AWR), and Average Monthly Range (AMR) boundaries, providing traders with precise entry/exit l
The Trend Scanner 1
Alejandro Quintana Martinez
The Trend Scanner – Multi-Timeframe & Multi-Asset Analyzer Discover market direction at a glance! The Trend Scanner is a powerful tool designed for Boom & Crash, Volatility Indices, Jump Indices, and even Forex (EURUSD) , allowing traders to instantly spot bullish or bearish trends across multiple assets and timeframes in a single, easy-to-read window. Key Features: Monitors trends from M1 up to Monthly . Covers a wide range of assets: Boom & Crash Indices Volatility Indices Jump Indice
RSIScalperPro
PATRICK WENNING
Introducing RSIScalperPro - the revolutionary RSI-based indicator for Metatrader 5, specifically designed for scalping in the one-minute chart. With RSIScalperPro, you'll have a powerful toolkit for precise entry and exit signals to take your trading to the next level. RSIScalperPro utilizes two different RSI indicators that provide clear signals for overbought and oversold areas. You can customize the time periods and limit values of the two RSIs according to your preferences to achieve the be
If you are unsure how to use this indicator, please feel free to reach out to me. I will explain it to you and provide reading materials to help you make the most of it. TD Sequential Scanner: An Overview The TD Sequential scanner is a powerful technical analysis tool designed to identify potential price exhaustion points and trend reversals in financial markets. Developed by Tom DeMark, this method is widely used by traders to gauge market cycles and potential turning points with precision. Ho
The Absorption & Exhaustion Detector Professional indicator is a sophisticated volume analysis tool designed to identify critical market turning points by analyzing the relationship between price movement and cumulative volume delta (CVD). This indicator helps traders spot when price movements lack volume confirmation, indicating potential absorption or exhaustion zones. KEY FEATURES Real-time Cumulative Volume Delta (CVD) calculation and normalization Price-volume divergence gap measurement dis
Range Directional Force Indicator – Designed for You to Optimize! The Range Directional Force Indicator is a cutting-edge tool designed to empower traders by visualizing market dynamics and directional strength. Built to offer insights into market trends and reversals, this indicator is an invaluable asset for traders seeking precision in their strategies. However, it is important to note that this indicator is not optimized, leaving room for you to tailor it to your unique trading preferences.
First time on MetaTrader, introducing IQ Star Lines - an original Vedic Astrology based indicator. "Millionaires don't use astrology, billionaires do" . - J.P. Morgan, Legendary American financier and banker. IQ Star Lines, an unique astrological indicator purely based on   Vedic astrology   calculations, published for the   first time on Metatrader.  This unique tool plots dynamic planetary grid lines based on real-time stars, constellations, and celestial movements, which allows you to plot t
ZIVA TrendX
Hassan Abdullah Hassan Al Balushi
ZIVA TrendX is a professional trend-oriented indicator engineered to provide a clear and structured assessment of market direction through a cloud-based analytical framework. The indicator analyzes price behavior relative to dynamically derived trend boundaries, forming a continuous cloud structure that visually represents the prevailing market bias. This structure enables traders to maintain alignment with dominant directional conditions while filtering short-term market noise. All internal ca
Fibrillar
Vitalii Zakharuk
It is very easy to use the Fibrillar indicator, since the simplest is to look at the chart and act according to the indications of the colored arrows. The algorithm takes into account the measurement of prices, and this method also focuses on measuring each of the price drops (H / C, H / O, LC, LO) - which gives more detailed information, but also more averaged. When calculating this indicator, logarithmic gains are first calculated at the closing price, which allows you to filter out the tren
Mean Reversal Heikin Ashi Indicator calculates special trade reversal points based on Heikin Ashi candlesticks patterns. This indicator can be used on all symbols, even in Forex or B3 Brazillian Markets. You can configure just the position of each arrow. Then, after include the indicator on the graphic, pay attention on each arrow that indicates a long or short trade.
# SSL ST Strategy MT5 Indicator - Italian Version L'indicatore SSL ST Strategy MT5 è uno strumento di analisi tecnica progettato per aiutare i trader a identificare chiaramente i segnali di acquisto e vendita sul grafico di trading. Offre indicatori visivi come linee e frecce, insieme a notifiche audio, popup e push per avvertire prontamente i trader quando sorge un'opportunità di trading. ## Vantaggi principali - Fornisce chiari segnali visivi direttamente sul grafico utilizzando linee colo
Introduction to Fractal Pattern Scanner Fractal Indicator refers to the technical indicator that makes use of the fractal geometry found in the financial market. Fractal Pattern Scanner is the advanced Fractal Indicator that brings the latest trading technology after the extensive research and development work in the fractal geometry in the financial market. The most important feature in Fractal Pattern Scanner is the ability to measure the turning point probability as well as the trend probabil
Smart Money Structure & Precision Trading Indicator (MT5) Smart Money Structure & Precision Trading Indicator  is a powerful Smart Money Concepts (SMC) indicator for MetaTrader 5, designed to help traders identify high-probability entries with institutional logic . This indicator automatically detects market structure in real time , highlights key liquidity levels , and provides clear, non-repainting signals so you can trade with confidence and precision. Whether you are a scalper, day trader, o
SummarySignalLine   is an intelligent multi-indicator for MetaTrader 5 that combines signals from five classical technical indicators into a single smoothed signal line. The indicator visualizes overall market sentiment in a simple, intuitive format with color coding. Key Features Composite Analysis   — combines MA, RSI, Bollinger Bands, Stochastic, and ATR Smoothed Signal   — reduces market noise with configurable smoothing Visual Clarity   — color gradient from green (bullish) to red (bearish)
FREE
ROC acceleration-deceleration is the manual system for medium-term scalping. Indicator based on custom ROC system which defines bullish/bearish market and especially  acceleration-deceleration of tendention in the market's main direction. Buy arrow is plotted during bearish market when current trend decelerates and sell  arrow is plotted during bullish market when current trend decelerates. Main Indicator's Features Signals are not repaint,non-late or disappear(exept cases when system recalculat
Ugenesys AI MT5
Odaine Ramon Mcmillan
uGenesys AI - 90% Accurate Daytrading Indicator Introducing the ultimate forex trading indicator system, uGenesys AI, powered by cutting-edge AI technology and advanced analytical techniques, including Time-Series Analysis and Genetic Algorithms. Our AI-powered trading system leverages the power of time-series analysis to identify trends and patterns in historical price data, allowing traders to make informed predictions about future market movements. By analyzing vast amounts of data, our syst
Gli utenti di questo prodotto hanno anche acquistato
ARIPoint
Temirlan Kdyrkhan
1 (1)
ARIPoint is a powerful trading companion designed to generate high-probability entry signals with dynamic TP/SL/DP levels based on volatility. Built-in performance tracking shows win/loss stats, PP1/PP2 hits, and success rates all updated live. Key Features: Buy/Sell signals with adaptive volatility bands Real-time TP/SL/DP levels based on ATR Built-in MA Filter with optional ATR/StdDev volatility Performance stats panel (Success, Profit/Loss, PP1/PP2) Alerts via popup, sound, push, or email Cu
Azimuth Pro
Ottaviano De Cicco
5 (3)
LAUNCH PROMO Azimuth Pro price is initially set at 299$ for the first 100 buyers. Final price will be 499$ . THE DIFFERENCE BETWEEN RETAIL AND INSTITUTIONAL ENTRIES ISN'T THE INDICATOR — IT'S THE LOCATION. Most traders enter at arbitrary price levels, chasing momentum or reacting to lagging signals. Institutions wait for price to reach structured levels where supply and demand actually shift. Azimuth Pro maps these levels automatically: swing-anchored VWAP, multi-timeframe structure lines, an
TrendMaestro5
Stefano Frisetti
Attenzione alle truffe, questo indicatore e' distribuito esclusivamente su MQL5.com nota: questo indicatore e' per METATRADER5, se vuoi la versione per  METATRADER4 questo e' il link:   https://www.mql5.com/it/market/product/108106 TRENDMAESTRO ver 2.5 TRENDMAESTRO   riconosce un nuovo TREND sul nascere, non sbaglia mai. La sicurezza di identificare un nuovo TREND non ha prezzo. DESCRIZIONE TRENDMAESTRO identifica un nuovo TREND sul nascere, questo indicatore prende in esame la volatilita' i
Weis Wave with Alert MT5
Trade The Volume Waves Single Member P.C.
4.94 (17)
Rental/Lifetime Package Options and Privileges  Rent Monthly Six Months   Yearly/Lifetime Weis Wave with Speed with Alert+Speed Index x x x Manual  x x x Quick Set up Video x x x Blog x x x Lifetime Updates x x x Setup and Training Material x x Discord Access Channel "The SI traders"          x Rectangle Break Alert Tool      x How to trade with it:    http://www.tradethevolumewaves.com   ** If you purchase please contact me to setup your  : Training Room and  complete manual access.  Wei
ARIScalping
Temirlan Kdyrkhan
ARIScalp is a powerful trading companion designed to generate high-probability entry signals with dynamic TP/SL/DP levels based on volatility. Built-in performance tracking shows win/loss stats, PP1/PP2 hits, and success rates all updated live. Key Features: Buy/Sell signals with adaptive volatility bands Real-time TP/SL/DP levels based on ATR Built-in MA Filter with optional ATR/StdDev volatility Performance stats panel (Success, Profit/Loss, PP1/PP2) Alerts via popup, sound, push, or email Cus
G-Labs Advanced Market Maker Dashboard – MT5 BTMM Cycle & Market Maker State Engine The G-Labs Advanced Market Maker Dashboard is a professional multi-symbol, multi-cycle analysis system designed to track Market Maker intent, cycle progression, and structural behavior across the market from a single, unified dashboard. This is not a simple scanner. It is a cycle-aware BTMM engine that combines higher-timeframe bias, intraday structure, range expansion, manipulation detection, adaptive order bloc
ARICoins
Temirlan Kdyrkhan
ARICoin is a powerful trading companion designed to generate high-probability entry signals with dynamic TP/SL/DP levels based on volatility. Built-in performance tracking shows win/loss stats, PP1/PP2 hits, and success rates all updated live. Key Features: Buy/Sell signals with adaptive volatility bands Real-time TP/SL/DP levels based on ATR Built-in MA Filter with optional ATR/StdDev volatility Performance stats panel (Success, Profit/Loss, PP1/PP2) Alerts via popup, sound, push, or email Cust
L’indicatore evidenzia le zone in cui viene dichiarato interesse sul mercato , per poi mostrare la zona di accumulo degli ordini . Funziona come un book degli ordini su larga scala . Questo è l’indicatore per i grandi capitali . Le sue prestazioni sono eccezionali. Qualsiasi interesse ci sia nel mercato, lo vedrai chiaramente . (Questa è una versione completamente riscritta e automatizzata – non è più necessaria un’analisi manuale.) La velocità di transazione è un indicatore concettualmente nuo
AriX
Temirlan Kdyrkhan
1 (4)
AriX Indicator for MT5 A powerful trend-following and signal-evaluation tool AriX is a custom MT5 indicator that combines Moving Averages and ATR-based risk/reward logic to generate clear buy/sell signals. It visualizes dynamic SL/TP levels, evaluates past trade outcomes, and displays win/loss statistics in a clean on-chart panel. Key features include: Buy/Sell signals based on MA crossovers ATR-based SL/TP1/TP2/TP3 levels with visual lines and labels Signal outcome tracking with real-time stat
IVISTscalp5
Vadym Zhukovskyi
5 (6)
What's new about iVISTscalp5 forecast indicator (Version 10)? iVISTscalp5 is a unique nonlinear forecasting for a week ahead system for any financial instrument which executes fast scalping using time levels. iVISTscalp5 is a tool for easy study and understanding of financial market. 1) iVISTscalp5 forecast indicator has been completely rewritten into another programming language (C++), which has accelerated data loading and processing. As a result, a different graphical display of forecasts
L'indicatore " Dynamic Scalper System MT5 " è progettato per il metodo di scalping, ovvero per il trading all'interno di onde di trend. Testato sulle principali coppie di valute e sull'oro, è compatibile con altri strumenti di trading. Fornisce segnali per l'apertura di posizioni a breve termine lungo il trend, con ulteriore supporto al movimento dei prezzi. Il principio dell'indicatore. Le frecce grandi determinano la direzione del trend. Un algoritmo per generare segnali per lo scalping sott
Ottieni l’indicatore AUX GRATUITO, il supporto EA e la guida completa, visita per favore – https://www.mql5.com/en/blogs/post/763955 Individua la tendenza. Leggi il pattern. Cronometra l'ingresso. 3 passaggi in meno di 30 secondi! Opera senza sforzo — nessuna analisi richiesta, il tuo assistente intelligente è pronto a semplificare il tuo flusso di lavoro Basta sovraccarico di grafici. Opera con fiducia utilizzando il rilevamento intelligente del bias. Compatibile con tutte le valute, criptova
Big Player Range
Thalles Nascimento De Carvalho
5 (3)
BigPlayerRange – Il miglior indicatore per MT5 BigPlayerRange è considerato il miglior indicatore per Mini Indice e Mini Dollaro su MetaTrader 5. Questo strumento essenziale evidenzia le zone strategiche di azione dei grandi player, offrendo un’analisi tecnica istituzionale di altissima precisione. Come usare BigPlayerRange: Questo indicatore mostra zone di acquisto (linea verde) e di vendita (linea rossa). Quando il prezzo chiude fuori da queste aree, è probabile un movimento di tendenz
L’indicatore analizza il volume da qualsiasi punto e calcola i livelli di esaurimento del mercato per quel volume. Linee principali di Meravith: Linea di esaurimento del volume rialzista – funge da obiettivo. Linea di esaurimento del volume ribassista – funge da obiettivo. Linea di tendenza – indica la tendenza del mercato. Cambia colore a seconda che il mercato sia rialzista o ribassista e funge da supporto di tendenza. Come utilizzarlo: fai doppio clic sulla linea verticale viola e spostala ne
Rtc ML Ai Predictor
Muhammad Faisal Sagala
Rtc ML Ai | Predictor CORE MACHINE LEARNING ENGINE Adaptive ML Market Predictor – Multi-Bar Trend & Candle Forecast What This Indicator Does This indicator is a  real-time market prediction engine  designed to analyze price behavior and estimate  future market tendencies . Unlike conventional indicators, this system  does not rely on static parameters or historical curve-fitting , but adapts its internal state dynamically during live market operation. Instead of using static rules, the indic
Hunter Spike
Jaime Humberto Gomez Arias
Hunter Spike This indicator consists of two regression channels calibrated with the current movement of the synthetic index algorithm, for any Deriv or Weltrade broker. Each channel has a signal, a target that alerts us when the price touches them, indicating buys on booms or gains and sells on crashes or pains. -configuration for booms or gains: Channel zone 1 (30) Channel zone 2 (0) -configuration for crashes or pains: Channel zone 1 (100) Channel zone 2 (70) Zones freely configurable by
Rabby
Jannie Barwise
RABBY: The "Momentum Dislocation" Indicator for Nasdaq M1  (Nas100, US100) Nasdaq M1 (Nas100, US100) Stop Getting Trapped by M1 Noise. The Ultimate Nasdaq Scalping Tool.  Start Trading the Dislocation. The first indicator that visualizes "Price Detachment" for high-precision entries. You don't need another arrow. You need to see the   Structure   of the move. If you trade Nasdaq on the 1-minute timeframe, you know the feeling: An indicator prints a "Buy" signal. You enter. Two minutes late
Pantera Indicator
Temirlan Kdyrkhan
5 (1)
A tool for on-chart strategy backtesting and performance analysis. A utility for developing, debugging, and testing custom trading ideas and indicator functions. An indicator designed to quickly test trading concepts and visualize the effectiveness of different input parameters. An all-in-one sandbox for testing everything from simple crossovers to complex, multi-condition trading systems.
This indicator uses support and resistance, volume and some special formula to calculate the volume to filter the candles. If the volume reaches a specific value, And at the same time, Candle breaks the support/resistance line, There would be a signal and we can enter the market. Signals appear when the current candle closes. then you can enter the trade when a new candle appears. Please don't forget to follow your money management plan. MT4 Version Support/Resistance Breakout MT4 :   https:/
VTrende Pro
Andrii Diachenko
5 (1)
VTrende Pro - MTF indicator for trend trading with a display panel for MT5 *** Videos can be translated into any language using subtitles (video language - Russian) Although the signals of the VTrende Pro indicator can be used as signals of a full-fledged trading system, it is recommended to use them in conjunction with the Bill Williams TS. VTrende Pro is an extended version of the VTrende indicator. Difference between Pro version and VTrende: - Time zones - Signal V - signal 1-2 waves -    S
Max Ribbon Mt5
Stefano Frisetti
ATTENZIONE: Questo indicatore è distribuito ESCLUSIVAMENTE su MQL5.com Versione MT4:   https://www.mql5.com/it/market/product/160363 Versione MT5:   https://www.mql5.com/it/market/product/160410 ================================================================================ MAX RIBBON ver 1.00 L'indicatore che ti mostra il TREND in modo chiaro e inequivocabile! ================================================================================ DESCRIZIONE MAX RIBBON è un indicatore di trend
+++++++++++++++++++++++++++++++++++++++++++++++++++++++++++++++++++++++++++++++++++++++++++++++++ +++ Link to EURUSD Only Free Version -->  https://www.mql5.com/en/market/product/156904?source=Unknown +++++++++++++++++++++++++++++++++++++++++++++++++++++++++++++++++++++++++++++++++++++++++++++++++ Hallo Trader, This is a traditional GANN & FIBONACCI strategy based on detection of an impulsive move in the opposite direction. This is called a Breakout. At the moment of Breakout, the indicator draw
MATADOR GOLD – XAUUSD MT5 M5 Timeframe Scalp Signals MATADOR GOLD is a professional signal indicator designed for XAUUSD (Gold) scalping on the M5 timeframe , with optional higher-timeframe confirmation. This indicator does not open or manage trades automatically . It provides structured buy and sell signals, intelligent filtering, and alerts, allowing traders to execute trades using their own strategy and risk management rules. Core Concept (Multi-Concept Architecture) MATADOR GOLD is built
##   ONLY GOLD ##   Тiльки Золото ## **Mercaria Professional Trading Zones - Complete Guide** ## **Mercaria Professional Trading Zones - Повний посібник** ### **How Mercaria Zones Work / Як працюють зони Mercaria** **English:** Mercaria Zones is an advanced trading indicator that identifies high-probability support and resistance areas using ZigZag extremes combined with mathematical zone calculations. The indicator works on multiple timeframes simultaneously, providing a comprehensive view
ChartMaster Heikin Ashi with Pivot Indicator for MT5 Take your trading to the next level with ChartMaster Heikin Ashi with Pivot Indicator , a powerful tool that combines the clarity of Heikin Ashi candles with advanced pivot-point analysis. This indicator is designed for traders who want to identify market trends, reversals, and key support/resistance zones with precision. Key Features: Heikin Ashi Visualization – Smooths out market noise for cleaner trend identification. Automatic Pivot
CGE Trading Suite
Carl Gustav Johan Ekstrom
5 (1)
CGE Trading Suite is a market analysis system designed to eliminate guesswork from trading. It continuously adapts to real-time price behavior, helping traders stay aligned with key market levels and evolving market conditions. This comprehensive system integrates multiple analytical tools into a single workflow, including dynamic grid mapping, liquidity behavior analysis, ECM, trend lines, MIDAS, trade cycles, and directional channel projections. Together, these tools provide a clear picture of
Manipulation Hunter AMD
Andres Emeric Araya Rivera
1 (1)
Manipulation Hunter — Identify Market Convergence with Algorithmic Precision Manipulation Hunter is an advanced indicator engineered to detect manipulation points, structural pivots, and price convergence zones before major directional moves occur. Powered by a proprietary multi-variable algorithm based on AMD (Accumulation – Manipulation – Distribution) principles, it automatically analyzes price action to reveal key levels where structure, momentum, and institutional footprints align. Wh
WanaScalper
Isaac Wanasolo
1 (1)
A scalping indicator based on mathematical patterns, which on average gives signals with relatively small SL, and also occasionally helps to catch big moves in the markets (more information in the video) This indicator has three main types of notifications: The first type warns of a possible/upcoming signal on the next bar The second type indicates the presence of a ready signal to enter the market/open a position The third type is for SL and TP levels - you will be notified every time price re
Enigma 112
issam rahhal sabour
Enigma 112 Indicator - User Manual Enigma 112 Indicator Complete User Manual - Ultimate Trading Solution Introduction The Enigma 112 is a comprehensive multi-timeframe trading indicator that combines advanced technical analysis concepts including Tesla 3-6-9 Gates, Huddleston Theory, PO3 Dealing Ranges, and sophisticated risk management systems. Tesla 3-6-9 Gates Based on Nikola Tesla's vortex mathematics for precise support and resistance levels Huddleston Theory Volume-based market
How to use Pair Trading Station Pair Trading Station is recommended for H1 time frame and you can use it for any currency pairs. To generate buy and sell signal, follow few steps below to apply Pair Trading Station to your MetaTrader terminal. When you load Pair Trading Station on your chart, Pair Trading station will assess available historical data in your MetaTrader platforms for each currency pair. On your chart, the amount of historical data available will be displayed for each currency pai
Altri dall’autore
Volatility Trend System - un sistema di trading che fornisce segnali per le voci. Il sistema di volatilità fornisce segnali lineari e puntuali nella direzione del trend, nonché segnali per uscirne, senza ridisegnare e ritardi. L'indicatore di tendenza monitora la direzione della tendenza a medio termine, mostra la direzione e il suo cambiamento. L'indicatore di segnale si basa sui cambiamenti della volatilità e mostra gli ingressi nel mercato. L'indicatore è dotato di diversi tipi di avvisi. Pu
Un indicatore tecnico che struttura i grafici e identifica i movimenti ciclici dei prezzi. Può funzionare su qualsiasi grafico. Diversi tipi di notifiche. Ci sono altre frecce sul grafico stesso. Senza ridisegnare la storia, lavora sulla chiusura della candela. TF consigliati da M5 in su. Parametri facili da usare e configurare. Se si utilizzano 2 indicatori con parametri diversi, è possibile utilizzarli senza altri indicatori. Ha 2 parametri di input Ciclicità e durata del segnale Questi 2 pa
L'indicatore " Dynamic Scalper System MT5 " è progettato per il metodo di scalping, ovvero per il trading all'interno di onde di trend. Testato sulle principali coppie di valute e sull'oro, è compatibile con altri strumenti di trading. Fornisce segnali per l'apertura di posizioni a breve termine lungo il trend, con ulteriore supporto al movimento dei prezzi. Il principio dell'indicatore. Le frecce grandi determinano la direzione del trend. Un algoritmo per generare segnali per lo scalping sott
Point Directions MT5 - Un indicatore che mostra i livelli dei punti di supporto e resistenza quando il prezzo si muove. Le frecce mostrano i rimbalzi del prezzo nelle direzioni indicate. Le frecce non vengono ridisegnate, si formano sulla candela corrente. Funziona su tutti i tempi e strumenti di trading. Esistono diversi tipi di avvisi. Dispone di impostazioni avanzate per personalizzare i segnali per qualsiasi grafico. Può essere configurato per fare trading con il trend e le correzioni. Per
Wave Reversal Indicator - determina la direzione e le inversioni di prezzo attorno alla linea di equilibrio. L'indicatore mostra i movimenti delle onde e i picchi di tendenza. Dà consigli su dove seguire il trader, aiuta a seguire la strategia di trading. È un'aggiunta a una strategia intraday o a medio termine. Quasi tutti i parametri vengono selezionati per ciascun intervallo di tempo e cambiano automaticamente; l'unico parametro per la regolazione manuale è la lunghezza d'onda. Tempi ottimal
FREE
Trading System Double Trend MT5 - sistema di trading indipendente composto da diversi indicatori. Determina la direzione della tendenza generale e fornisce segnali nella direzione del movimento dei prezzi. Può essere utilizzato per lo scalping, il trading intraday o intraweek. Possibilità Funziona su qualsiasi intervallo temporale e strumento di trading (Forex, criptovalute, metalli, azioni, indici). Semplice lettura visiva delle informazioni senza caricare un grafico L'indicatore non ridiseg
Volatility Trend System - è un sistema di trading che fornisce segnali per le entrate. Il sistema di volatilità fornisce segnali lineari e puntuali nella direzione del trend, nonché segnali per uscirne, senza ridisegnare o ritardi. L'indicatore di tendenza monitora la direzione del trend a medio termine, mostra la direzione e il suo cambiamento. L'indicatore del segnale si basa sui cambiamenti della volatilità e mostra gli ingressi nel mercato. L'indicatore è dotato di diversi tipi di avvisi. P
Level Breakout Indicator è un prodotto di analisi tecnica che funziona dai limiti superiore e inferiore, che può determinare la direzione del trend. Funziona sulla candela 0 senza ridisegnare o ritardi. Nel suo lavoro utilizza un sistema di diversi indicatori, i cui parametri sono già stati configurati e combinati in un unico parametro: " Scale ", che esegue la gradazione dei periodi. L'indicatore è facile da usare, non richiede alcun calcolo, utilizzando un unico parametro è necessario selezion
Upper and Lower Reversal - Sistema per la previsione anticipata dei momenti di inversione. Ti consente di trovare punti di svolta dei prezzi ai confini dei canali di movimento dei prezzi superiore e inferiore. L'indicatore non si ricolorerà né cambierà mai la posizione delle frecce del segnale. Le frecce rosse sono un segnale di acquisto, le frecce blu sono un segnale di vendita. Si adatta a qualsiasi intervallo temporale e strumento di trading L'indicatore non si ridisegna, funziona solo quan
Point Directions
Vitalyi Belyh
5 (1)
Point Directions - Un indicatore che mostra i livelli dei punti di supporto e resistenza quando il prezzo si muove. Le frecce mostrano i rimbalzi del prezzo nelle direzioni indicate. Le frecce non vengono ridisegnate, si formano sulla candela corrente. Funziona su tutti i tempi e strumenti di trading. Esistono diversi tipi di avvisi. Dispone di impostazioni avanzate per personalizzare i segnali per qualsiasi grafico. Può essere configurato per fare trading con il trend e le correzioni. Per dise
Wave Price Channel - Sistema analitico di trading progettato per cercare impulsi e correzioni. L'indicatore ti consente di lavorare nella direzione del canale dei prezzi, che è costruito sulla base della volatilità. Quando sul canale viene disegnata una freccia su o giù, diventa possibile andare in questa direzione; il segnale in questa direzione è confermato da un indicatore punto sensibile alle variazioni di prezzo. Finché continuano i punti dello stesso colore, il segnale continua. Se c'è un
Candle Binary Scalper è un prodotto di analisi tecnica per forex e opzioni binarie. Include diversi indicatori tecnici combinati in un sistema di trading. Adatto per il trading manuale all'interno di un trend, per lo scalping e le opzioni binarie. Funziona su tutti i tempi e strumenti di trading. Tempi consigliati per la negoziazione M15, M30, H1 e H4, M5 e M1 dovrebbero essere utilizzati in caso di elevata volatilità. Esistono diversi tipi di avvisi. Come utilizzare il prodotto Le impostazion
Trading System Double Trend - sistema di trading indipendente composto da diversi indicatori. Determina la direzione della tendenza generale e fornisce segnali nella direzione del movimento dei prezzi. Può essere utilizzato per lo scalping, il trading intraday o intraweek. Possibilità Funziona su qualsiasi intervallo temporale e strumento di trading (Forex, criptovalute, metalli, azioni, indici). Semplice lettura visiva delle informazioni senza caricare un grafico L'indicatore non ridisegna e
Il sistema di trading tecnico delle frecce BB è stato sviluppato per prevedere punti inversi per prendere decisioni al dettaglio. L'attuale situazione di mercato è analizzata dall'indicatore e strutturata per diversi criteri: l'aspettativa di momenti di inversione, potenziali punti di svolta, segnali di acquisto e vendita. L'indicatore non contiene informazioni in eccesso, ha un'interfaccia comprensibile visiva, che consente ai trader di prendere decisioni ragionevoli. Tutte le frecce sembrano
L'indicatore " ZigZag on Trend " aiuta a determinare la direzione del movimento dei prezzi, oltre a essere un calcolatore di barre e pip. È costituito da un indicatore di tendenza, una linea di tendenza rappresentata da uno zigzag che traccia la direzione del prezzo e un contatore che calcola il numero di barre attraversate nella direzione del trend e il numero di pip sulla scala verticale (i calcoli si basano sull'apertura della barra). L'indicatore non si aggiorna. Per comodità, viene presenta
Indicatore per il trading manuale e l'analisi tecnica per il Forex. È costituito da un indicatore di tendenza con il livello di apertura del giorno di negoziazione e da un indicatore a freccia per determinare i punti di ingresso. L'indicatore non si ricolora; funziona quando la candela si chiude. Contiene diversi tipi di avvisi per le frecce di segnalazione. Può essere configurato per funzionare su qualsiasi grafico, strumento di trading o intervallo di tempo. La strategia di lavoro si basa su
A trend indicator showing the strength of bulls and bears in a trading range. Consists of two lines: The green line is a balanced overbought/oversold condition. The red line is the direction of trading activity. Does not redraw calculations. Can be used on all Symbols/Instruments/Time Frames. Easy to use and set up. How to use the indicator and what it determines. The basic rule is to follow the direction of the red line: if it crosses the green line from the bottom up, the market is dominat
FREE
Arrow indicator with trend filter. Generates trend input without delays or delays - on the emerging candle. Suitable for use on any trading tools and timeframes. Easy to use, contains the direction of the trend in the form of a histogram lines and signal generator. Input parameters Period Trend Line - Period of the Histogram Line Signal Generator Period - If the period is longer, then the arrows are less Play sound Display pop-up message Send push notification Send email Sound file signal - Fi
Channel Cluster
Vitalyi Belyh
5 (1)
Cluster indicator working in the price channel. For operation, the indicator builds a channel line - (dashed line). Inside the channel, cluster sections are determined that determine the direction of the price movement - (histograms in two directions), start with large arrows. Small arrows are plotted above / below each histogram - indicator increase volatility. The indicator does not redraw the values. Works on any tools and timeframes. Entrances are made when large arrows appear, inside small
A technical indicator that calculates its readings based on trading volumes. It has an oscillatory line that follows the change in volumes. Large arrows on the line indicate reversal values. A channel is built around the line with small arrows showing the strengthening of price movement in the direction of increasing volumes. The indicator does not redraw values. Works on any instrument and timeframe. It can complement any trading strategy by finding a trend or make entries in the direction of a
Developed methods for trading collected in one indicator. In the form of arrows, it defines entries in the direction of the trend. It has 2 types of arrows - trend and signal guides, informing about the potential movement in the direction of the trend. Works without redrawing, ready for use on all symbols/tools. The most suitable time frames to use are M15, M30, H1, H4. How to use The indicator finds the direction of the trend in the form of a signal arrow, a graphic rectangle stretches along
Indicatore ciclico per il trading e la previsione della direzione del mercato. Mostra il comportamento ciclico del prezzo sotto forma di oscillatore. Fornisce segnali per l'apertura delle operazioni quando c'è un rimbalzo dai limiti superiore e inferiore dell'oscillatore. Sotto forma di istogramma, mostra la forza attenuata del trend.  Completerà qualsiasi strategia di trading, dallo scalping all'intraday.  L'indicatore non viene ridisegnato.  Adatto per l'uso su tutti i simboli/strumenti.  Gli
Max Min Reversal Arrows - an arrow reversal indicator for predicting price movement. The indicator is built on the support and resistance levels at the local lows and highs of the price. Product features Arrows appear on the current candle. The indicator does not redraw. Can be used on all time frames and trading instruments. Recommended timeframes to use M30, H1, H4. The dotted lines are the support and resistance levels within the signal. Price movement from these levels means a reversal. Pr
Scalping Entry Points - è un sistema di trading manuale che può adattarsi ai movimenti dei prezzi e dare segnali per aprire le negoziazioni senza ridisegnare. L'indicatore determina la direzione del trend dal livello centrale di supporto e resistenza. L'indicatore a punto fornisce segnali per entrate e uscite. Adatto per trading intraday manuale, scalping e opzioni binarie. Funziona su tutti i tempi e strumenti di trading. L'indicatore fornisce diversi tipi di avvisi. Come utilizzare il prodott
Binary Lines è un indicatore di analisi tecnica per valute, materie prime, criptovalute, azioni, indici e qualsiasi strumento finanziario. Può essere utilizzato per opzioni binarie o scalping Forex. Mostra i punti di ingresso e di uscita a intervalli fissi e fornisce commercianti le informazioni necessarie sui risultati di possibili transazioni. I punti di ingresso si formano proprio all'inizio della candela, in direzione della linea MA, durata le negoziazioni in barre possono essere regolate ma
Un indicatore tecnico che calcola le sue letture sui volumi di scambio. Sotto forma di istogramma, mostra l'accumulo della forza del movimento dello strumento di trading. Dispone di sistemi di calcolo indipendenti per le direzioni rialziste e ribassiste. Funziona su qualsiasi strumento di trading e intervallo di tempo. Può integrare qualsiasi sistema di trading. L'indicatore non ridisegna i suoi valori, i segnali appaiono sulla candela corrente. È facile da usare e non carica il grafico, non ric
Line Breakouts - Sistema per il trading di trend. Contiene un identificatore di tendenza che può essere adattato a qualsiasi grafico e strumento di trading utilizzando la funzione periodo e livellamento. E un determinante dei livelli di supporto e resistenza. Quando il prezzo è al di sotto della linea di resistenza, apri le operazioni di vendita e quando il prezzo è al di sopra della linea di supporto, apri le operazioni di acquisto. Lo stop loss dovrebbe essere posizionato a pochi punti dalle l
Point Trend Indicator - Un indicatore del livello superiore e inferiore del trend, che può determinare la direzione del trend e indicarne il rafforzamento. La direzione del trend è determinata da punti rotondi; se i punti sono sopra la linea dello zero, il trend è rialzista; se sotto, il trend è ribassista. L'aumento del movimento direzionale è indicato dalle frecce. Ha l'unico parametro per la regolazione manuale: durata della direzione del trend.   Possibilità Funziona su tutti gli intervalli
Scalping and Binary Signal Detector - Indicatore di scalping che fornisce segnali direzionali per l'apertura di posizioni lungo il trend. L'indicatore è un sistema di trading completo che può essere utilizzato per Forex e opzioni binarie. Il sistema di algoritmi consente di riconoscere movimenti intensi di prezzo in più barre consecutive. L'indicatore fornisce diversi tipi di avvisi per le frecce. Funziona su qualsiasi strumento di trading e intervallo di tempo (consigliato M5 o superiore). Com
Level Breakout Indicator è un prodotto di analisi tecnica che funziona dai limiti superiore e inferiore, che può determinare la direzione del trend. Funziona sulla candela 0 senza ridisegnare o ritardi. Nel suo lavoro utilizza un sistema di diversi indicatori, i cui parametri sono già stati configurati e combinati in un unico parametro: " Scale ", che esegue la gradazione dei periodi. L'indicatore è facile da usare, non richiede alcun calcolo, utilizzando un unico parametro è necessario selezion
Filtro:
Nessuna recensione
Rispondi alla recensione