Linear Trend Predictor MT5

Linear Trend Predictor - 진입 지점과 방향성 지원선을 결합한 추세 지표입니다. 고가/저가 채널을 돌파하는 원칙에 따라 작동합니다.
지표 알고리즘은 시장 노이즈를 걸러내고 변동성과 시장 역학을 고려합니다.

표시기 기능

  •  평활화 방법을 사용하여 시장 추세와 BUY 또는 SELL 주문을 시작하기 위한 진입 시점을 보여줍니다.
  •  모든 기간의 차트를 분석하여 단기 및 장기 시장 움직임을 파악하는 데 적합합니다.
  •  어떠한 시장과 시간대에도 적용할 수 있으며, 입력 매개변수를 통해 거래자는 자신에게 맞게 지표를 독립적으로 사용자 지정할 수 있습니다.
  •  설정된 지표 신호는 사라지거나 다시 그려지지 않습니다. 이는 캔들 마감 시 결정됩니다.
  •  여러 유형의 알림이 화살표와 결합되어 있습니다.
  •  이 지표는 독립적인 거래 시스템으로 사용할 수도 있고, 다른 거래 시스템에 추가하는 용도로도 사용할 수 있습니다.
  •  모든 수준의 경험을 가진 거래자가 사용할 수 있습니다.


주요 매개변수
Volatility Smoothing Level - 지표를 편안하게 작동하도록 구성할 수 있는 지표의 주요 매개변수입니다.
1에서 100까지의 숫자 범위가 있어서 더 긴 추세 움직임을 얻을 수 있습니다.
숫자가 작으면 거래에서 빠르게 빠져나가면서 단기적인 움직임을 얻을 수 있습니다.
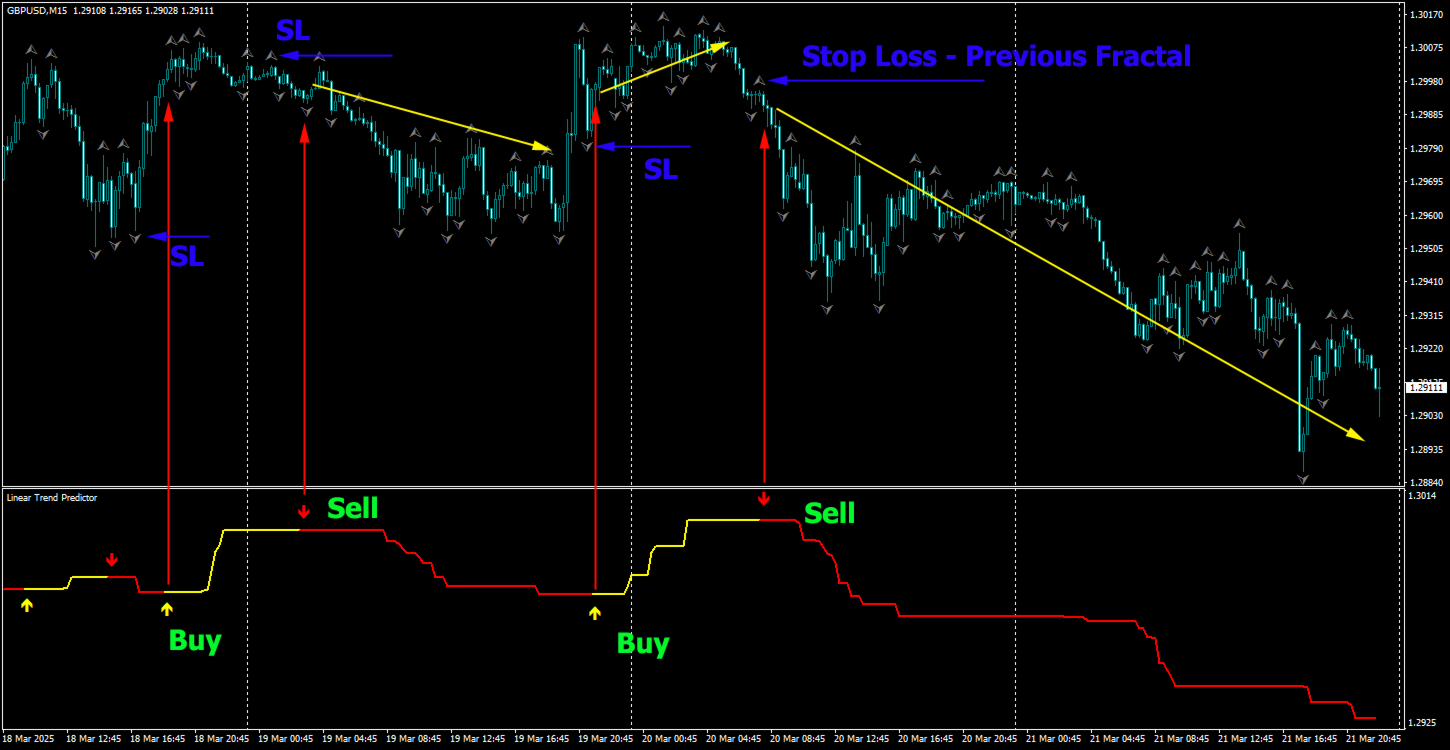
지표를 사용한 거래 순간:

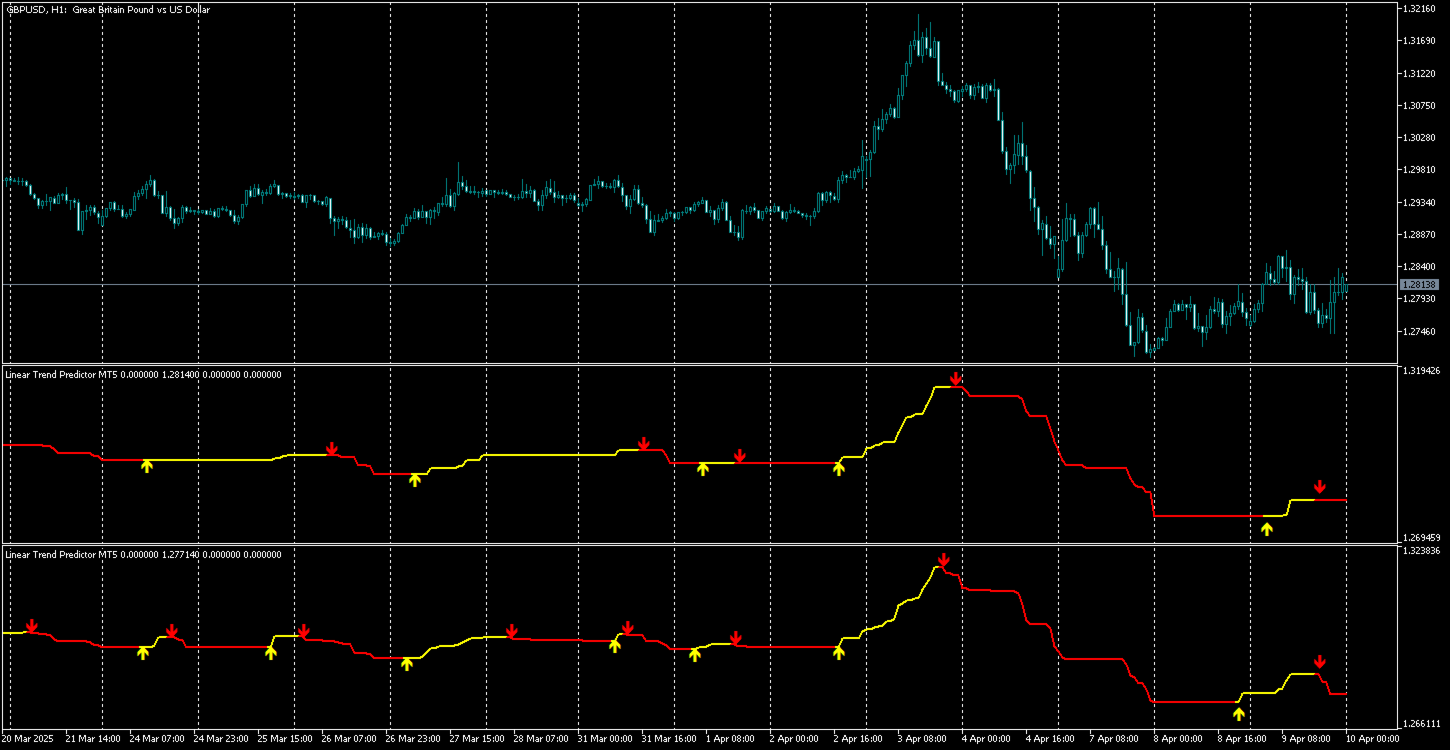
  1.  하락 추세와 매도 시작 신호를 나타내는 빨간색 선과 화살표입니다. 손절매는 이전 상위 프랙탈에 따라 설정해야 합니다.
  2.  상승 추세와 매수 시작 신호를 나타내는 노란색 선과 화살표입니다. 손절매는 이전 낮은 프랙탈에 따라 설정해야 합니다.
  3.  Fractals 지표는 MT4 터미널에 내장되어 있습니다.
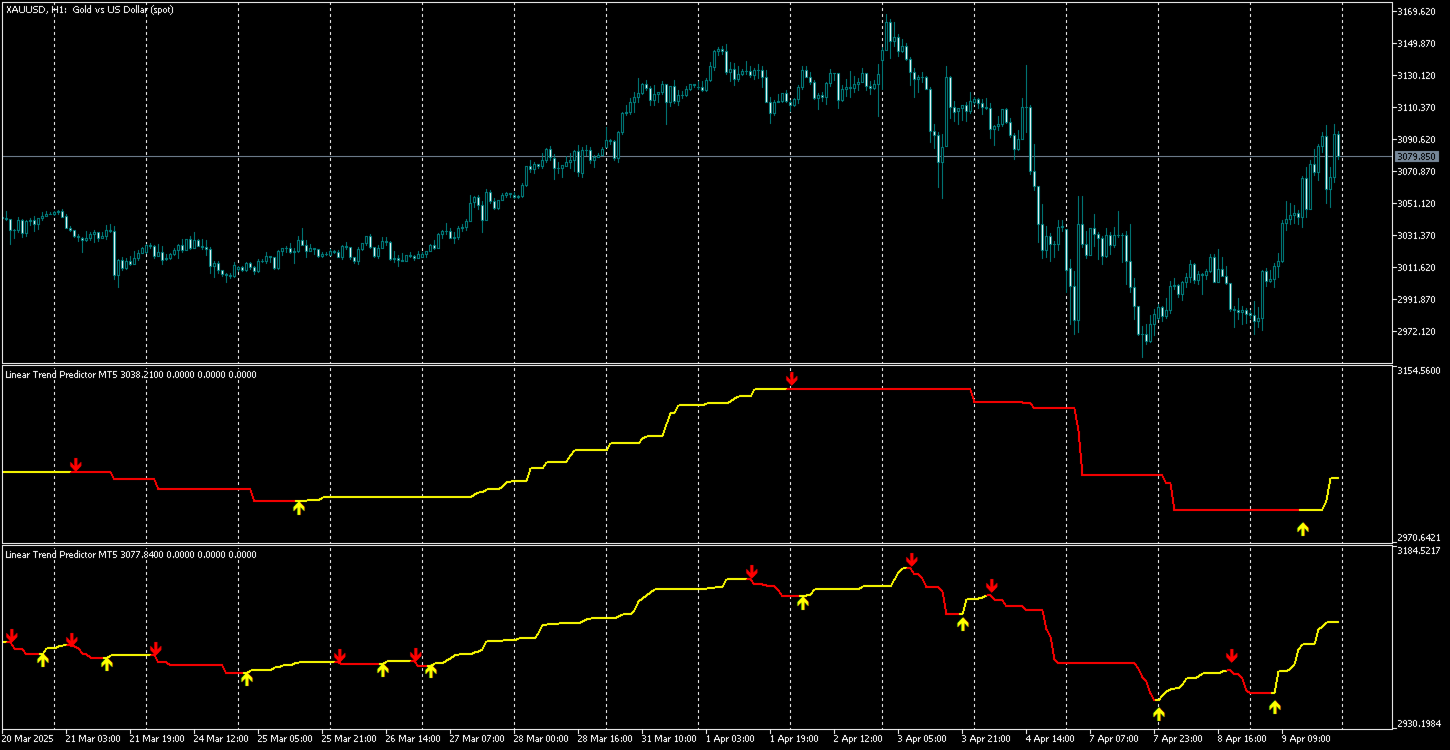
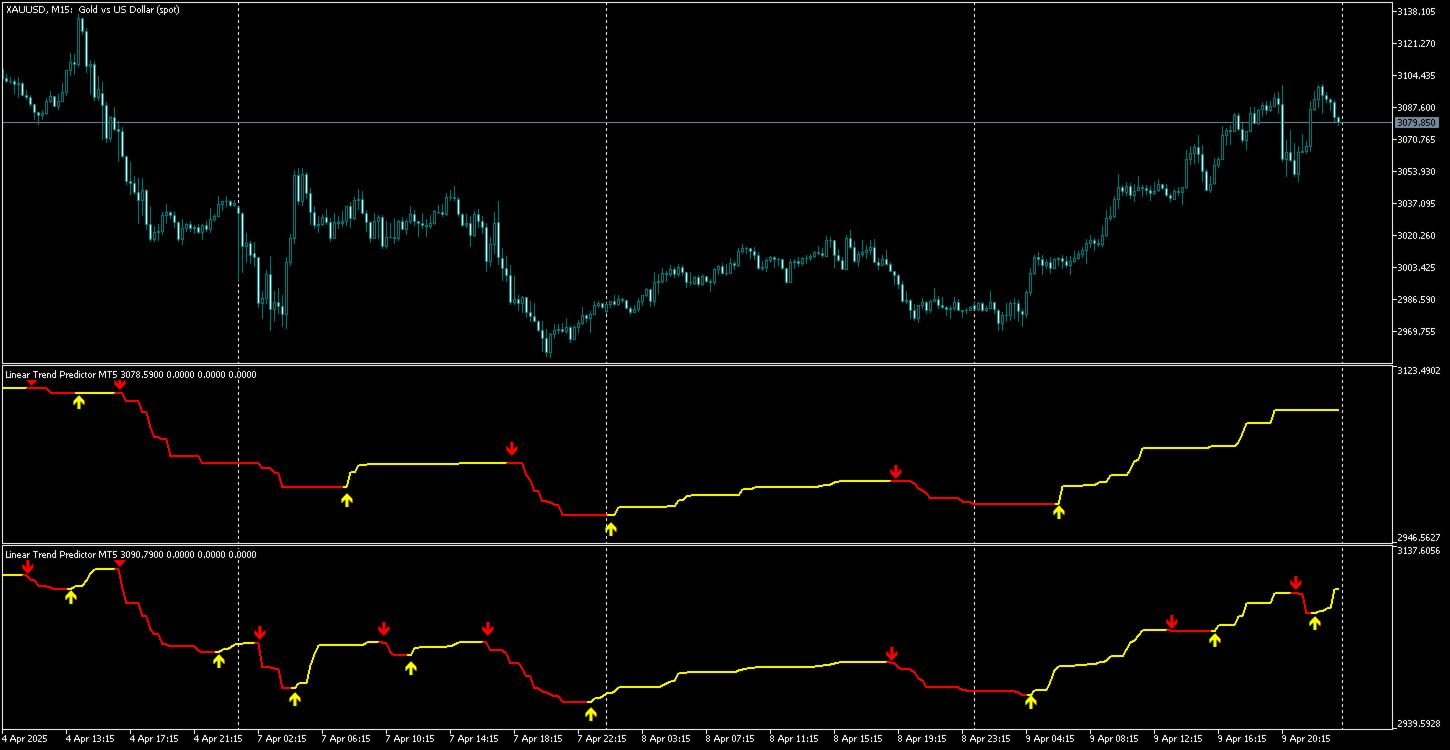
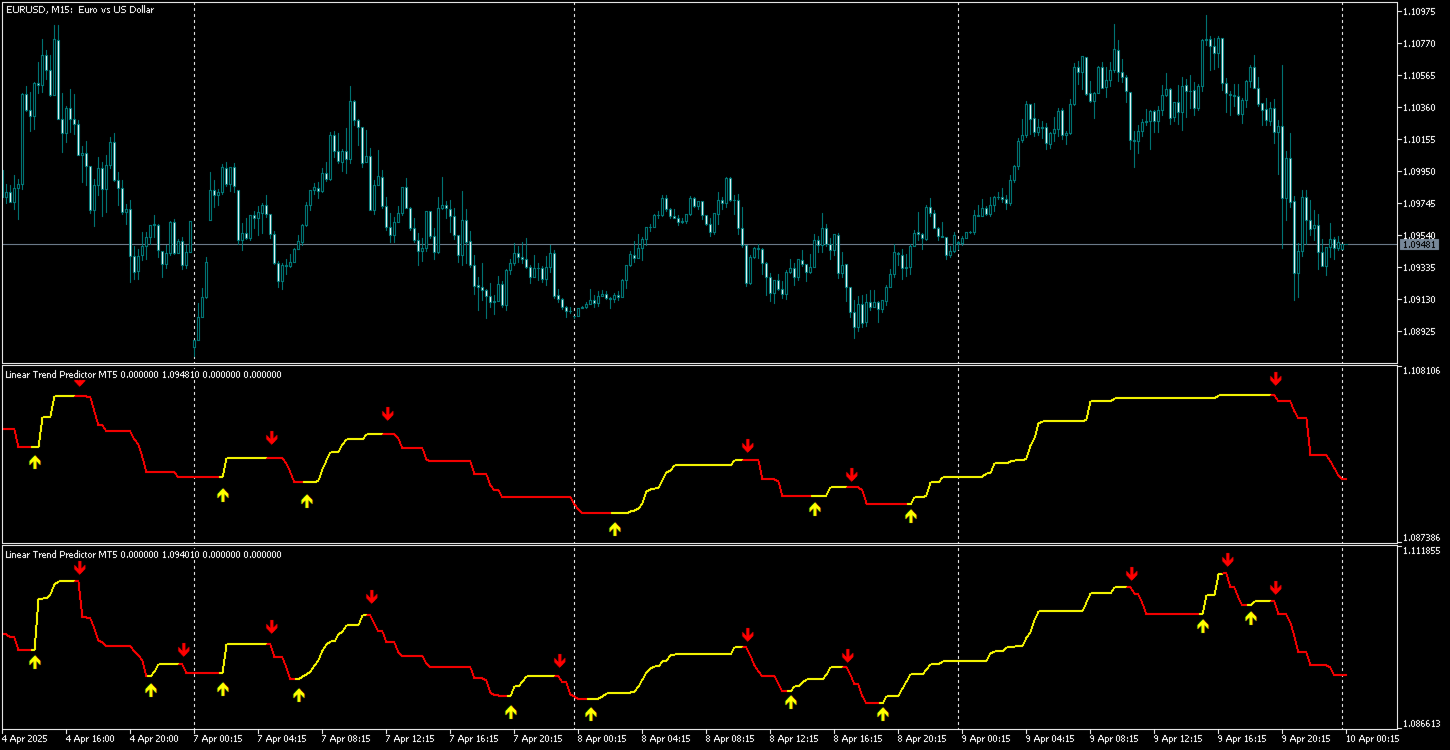
  4.  장기 및 중기 거래에서는 반대 신호가 나타날 때까지 포지션을 열어 둡니다. (대규모 평활화 사용)
  5.  단기 거래의 경우, 서로 다른 평활화 매개변수를 갖는 2가지 지표를 사용합니다. 추세를 파악하기 위해 높은 평활화를 사용하고, 포지션을 개시하고 마감하기 위해 최소 평활화를 사용합니다.

추천 제품
Rocket Trend
Andriy Sydoruk
The Rocket Trend indicator is trending. The indicator draws two-color points connected by lines along the chart. This is a trend indicator, it is an algorithmic indicator. It is easy to work and understand when a blue circle appears, you need to buy, when a red one appears, sell. The indicator is used for scalping and pipsing, and has proven itself well. Rocket Trend is available for analyzing the direction of the trend for a specific period of time. Ideal for novice traders learning the laws o
Manyal trading system, CovEchoTrend Robot, focuses on reliability and flexibility. By employing statistical analysis methods to study the relationships between the base indicator and market patterns, the system enables a deeper understanding of market processes. Intelligent pattern analysis: The application of statistical data processing helps identify key trend reversal points more accurately, signaling significant market shifts. Informed decision-making is based on the intersection of indicato
Ultimate Double Top & Bottom (Pro Volume Matrix) Stop trading retail breakouts. Start trading Institutional Traps. The   Ultimate Double Top & Bottom   is not a standard, lagging pattern scanner. It is a highly advanced, non-repainting structural engine equipped with a proprietary   3-Leg Volume Matrix . Designed exclusively for Smart Money Concepts (SMC) and order flow traders, this indicator mathematically dissects the tick volume inside M and W patterns to reveal true institutional intent:  
이 지표는 실제 거래에 완벽한 자동 파동 분석 지표입니다! 사례... 참고:   웨이브 그레이딩에 서양식 이름을 사용하는 데 익숙하지 않습니다. Tang Lun(Tang Zhong Shuo Zen)의 명명 규칙의 영향으로 기본 웨이브를   펜   으로 명명하고 2차 웨이브 밴드를   세그먼트   로 명명했습니다. 동시에, 세그먼트에는 추세 방향이 있습니다.   주요 추세 세그먼트에는   이름이 지정되지만(이 이름 지정 방법은 향후 노트에서 사용됩니다. 먼저 말씀드리겠습니다.) 알고리즘은 굴곡 이론과 거의 관련이 없으므로 그렇게 해서는 안 됩니다. 이는 나의 시장 분석을   통해 요약된 끊임없이 변화하고 복잡한 운영 규칙을   반영합니다. 밴드는 더 이상 사람마다 다르지 않도록 표준화되고 정의되었습니다. 인위적인 간섭의 드로잉 방법은 시장 진입을 엄격하게 분석하는 데 핵심적인 역할을 합니다. 이 지표를 사용하는 것은 거래 인터페이스의 미학을 개선하고 원래의 K-line 거래를
Xtrade Trend Detector
Dago Elkana Samuel Dadie
Xtrade Trend Detector is an indicator capable of finding the best opportunities to take a position in any stock market. Indeed, it is a great tool for scalpers but also for Daytraders. You could therefore use it to identify areas to trade, it fits easily on a chart. I use it to detect trends on Big timeframes and take positions on Small timeframes. Don't hesitate to give me a feedback if you test it.
Optimized Spike Detector Pro for MT5 is a professional-grade technical indicator designed to identify and capitalize on sharp, impulsive price movements (spikes) in any financial instrument. Utilizing a sophisticated, multi-algorithmic core, it distinguishes significant volatility expansions from market noise with exceptional accuracy. The tool dynamically adapts to changing market conditions, filtering out false signals and highlighting only high-probability spike setups in real-time. Featuring
Trade Tracker PRO
Curtis Daniel Jr -
1. Overview Trade Tracker Pro is a real-time trading performance dashboard built as a MetaTrader 5 Indicator. It overlays a fully customizable panel on any chart, giving you an instant, always-visible view of your daily and lifetime trading performance — without interfering with your charts or placing any trades.   Designed specifically for prop firm traders, funded account holders, and disciplined retail traders who need to monitor risk rules in real time. Trade Tracker Pro keeps your key numbe
Euro Escalper
Cristofher Robles
Euro Escalper V1 — Peulopesyeoneol Gigugeup Seukael-ping Jipyo Euro Escalper V1 eun mobeun jingib-eseo gigugeub jeongmilseong-eul yoguhaneun teuleideoui goseongneung georae jipyo. Hapseong Jisu (Deriv), Forex mich MetaTrader 5 eseo sayong ganeunghan modeun jasan-e jeogyong. Fibonacci giban yudongseong jiyeog, naejang SuperTrend enjin mich silsigan jeonmun daesiboeleu-leul gyeolhap. Juyo Jangjeom Jaegeurim Eobseum: Signal hwasalpyo-neun bong maegam si-eman natanago jeoldae umjigiji ankeo sarajiji
Visual Trend Reversals — Professional Trend Reversal Indicator for MetaTrader 5 Visual Trend Reversals is a modern and efficient indicator for MetaTrader 5, specifically designed for the timely identification of trend reversal points and analysis of market conditions on any instrument: forex, cryptocurrencies, stocks, indices, and commodities. The indicator is optimized to improve entry quality, minimize false signals, and maximize clarity for traders of any experience level. Key Advantages of V
Frontier Pivots
Nestor Jose Mendez Boza
FRONTIER PIVOTS - Geometric Levels Indicator This indicator plots support and resistance levels/ranges on the chart using mathematical calculations. It helps traders identify potential price reaction zones based on geometric patterns. Main Features: Automatically calculates and displays key price levels Plots both support and resistance lines Uses daily price data for level calculation Clean visual presentation with different colors for different level types No repainting - levels remain static
FXLAND Smart Reversal Indicator (MT5) FXLAND Smart Reversal Indicator is a professional technical analysis tool designed to help traders identify potential price reversal zones and key market turning points with clarity and precision. The best reversal indicator and price return by choosing only one ceiling or floor in each time frame A masterpiece of combining mathematics and Gann, fractal matrix, Fibonacci, movement angle and time. Completely intelligent Key Features Detects potenti
SunSignal ML — AI Gold Signals with Multi-Timeframe Confluence SunSignal ML is an advanced AI-powered signal indicator purpose-built for XAUUSD gold trading. It combines a proprietary adaptive trend algorithm with six machine learning models trained on confirmed price pivots to produce high-confidence entry signals with multi-timeframe validation. The indicator runs efficiently on M1, M5 and M15 timeframes and is designed for traders who want precision entries guided by data rather than guesswor
Skiey
Vitalii Zakharuk
Skiey - Indicator of easy solutions! Using this indicator is very simple, since the simplest is to look at the chart and act according to the color arrows. Such a calculation option takes into account intraday price fluctuations and focuses on measuring the "candlestick" share in the trend. The algorithm takes into account the measurement of prices, this method also emphasizes the measurement of each of the price drops (H / C, H / O, LC, LO) - which gives more detailed information but also mor
Liquidity Map
Alex Amuyunzu Raymond
Liquidity Map  Overview The Liquidity Map indicator is an advanced visualization tool based on ICT Smart Money Concepts . It automatically identifies daily Buy Zones , Sell Zones , and Liquidity Levels , showing where price is likely to reverse or continue based on institutional order flow. It calculates key levels from the daily session — such as the previous day’s high, low, and midpoint — then derives a premium (sell bias) and discount (buy bias) structure. When price trades into these mapped
SPECIAL LAUNCH OFFER: $30 (1-Month Rent) Limited time offer to build our community and gather feedback! AmbM GOLD Institutional Scalper A high-precision M5 algorithm for XAUUSD (Gold) , engineered to trade exclusively at Institutional Liquidity Levels ($5/$10 psychological marks). PERFORMANCE DATA (BUY ONLY) • Win Rate: 87.09%. • Safe Growth: +$4,113 profit on $10k (13.75% Max Drawdown). • Extreme Stress Test: Successfully generated +$22,997 in a 5-year stress test (2020-2026), proving
I recommend you to read the  product's blog  (manual) from start to end so that it is clear from the beginning what the indicator offers. This multi time frame and multi symbol supply and demand zone dashboard indicator sends alerts when the price has reached a supply/demand zone. It is also possible to use it to be alerted about regular double tops/bottoms instead of zones. It can be used with all time frames from M1 to MN. Maximum 9 time frames can be shown in the dashboard at the same time. 
다중 시간대 이동 평균선 지표 다중 시간대 이동 평균선 지표를 사용하여 시장 추세를 더 깊이 이해하십시오. 이 강력한 MQL5 도구를 사용하면 하나의 차트에서 5가지 다른 시간대의 이동 평균선을 동시에 시각화할 수 있습니다. 여러 지표 인스턴스로 작업 공간을 복잡하게 만들지 않고도 다양한 관점에서 가격 역학에 대한 포괄적인 통찰력을 얻을 수 있습니다. 주요 기능: 다중 시간대 분석: 하나의 차트에 다른 시간대(예: M15, H1, H4, D1, W1)의 최대 5개의 이동 평균선을 표시합니다. 사용자 정의 기간: 표시되는 모든 선에 대해 원하는 이동 평균 기간을 쉽게 설정할 수 있습니다. 다양한 MA 유형: 단순(SMA), 지수(EMA), 평활(SMMA), 선형 가중(LWMA)을 포함한 광범위한 이동 평균 유형 중에서 선택하십시오. 조정 가능한 시간대: 모니터링하려는 5가지 시간대를 선택하여 비교할 수 없는 유연성을 제공합니다. 깔끔한 시각화: 여러 추세 관점을 한눈에 확인하여 시간대
HalfTrend trendline with ATR pullback zones — built for trend traders. Spot the trend direction instantly, use ATR bands to judge “normal” pullbacks vs extended moves, and get alerts on trend flips and optional trendline touches .  HalfTrend ATR Bands & Alerts (MT5) is a trend-following indicator that plots a clean HalfTrend trendline together with ATR-based bands/zones . It provides trend change arrows , optional touch alerts (price touches the trendline), and EA/iCustom signal buffers for au
Go Binary
Fabio Oliveira Magalhaes
The main idea of this product is to generate statistics based on signals from 5 different strategies for the Binary Options traders, showing how the results would be and the final balance based on broker's payout. Strategy 1: The calculation is secret. Strategy 2: The signal is based on a sequence of same side candles (same color). Strategy 3: The signal is based on a sequence of interspersed candles (opposite colors). Strategy 4: The signal consists of the indicators bollinger (we have 3 type
The Trend Scanner 1
Alejandro Quintana Martinez
The Trend Scanner – Multi-Timeframe & Multi-Asset Analyzer Discover market direction at a glance! The Trend Scanner is a powerful tool designed for Boom & Crash, Volatility Indices, Jump Indices, and even Forex (EURUSD) , allowing traders to instantly spot bullish or bearish trends across multiple assets and timeframes in a single, easy-to-read window. Key Features: Monitors trends from M1 up to Monthly . Covers a wide range of assets: Boom & Crash Indices Volatility Indices Jump Indice
RSIScalperPro
PATRICK WENNING
RSIScalperPro를 소개합니다 - 메타트레이더 5용 RSI 기반의 혁신적인 인디케이터로, 1분 차트에서의 스캘핑에 최적화되어 있습니다! RSIScalperPro를 사용하면 정확한 진입 및 청산 신호를 제공하는 강력한 도구를 손에 넣을 수 있습니다. RSIScalperPro는 서로 다른 두 가지 RSI 지표를 사용하여 과매수 및 과매도 레벨에 대한 명확한 신호를 제공합니다. 2개의 RSI의 시간 프레임 및 제한 값을 원하는 대로 조정하여 트레이딩 전략에 최적화된 결과를 얻을 수 있습니다. 차트 상의 개별 화살표는 거래 진입 및 청산 타이밍을 쉽게 파악하는 데 도움이 됩니다. 또한 RSIScalperPro의 특징 중 하나는 사용자 정의 가능한 3개의 이동 평균선입니다. 이를 통해 트렌드의 방향을 판단하고 강력한 거래 신호를 확인하는 데 도움이 됩니다. 이를 통해 조기에 트렌드를 감지하고 수익성 높은 거래에 참여할 수 있습니다. 뿐만 아니라 RSIScalperPro는 새로운 거래
If you are unsure how to use this indicator, please feel free to reach out to me. I will explain it to you and provide reading materials to help you make the most of it. TD Sequential Scanner: An Overview The TD Sequential scanner is a powerful technical analysis tool designed to identify potential price exhaustion points and trend reversals in financial markets. Developed by Tom DeMark, this method is widely used by traders to gauge market cycles and potential turning points with precision. Ho
LTL Long Trend Locator
Muhammad Usman Siddique
LTL 장기 추세 탐지기 v2.0 - 전문 추세 거래 지표 LTL 장기 추세 탐지기는 강력하고 지속적인 추세를 식별하여 트레이더가 시장에 진입하고 퇴출할 최적의 시점을 찾는 데 도움을 줍니다. 추세가 시작되고 끝나는 시점에 명확한 신호를 제공하여 올바른 방향으로 적시에 거래할 수 있도록 지원합니다. 강력한 시장 추세를 발견하고 명확한 진입점, 손절매 수준, 목표수익 수준을 통해 거래를 배치할 정확한 위치를 보여줍니다. 주요 기능: 명확한 매수/매도 신호: 시장이 상승 또는 하락할 준비가 되었을 때 화살표 표시 거래 라인 표시: 차트에 모든 수준이 명확히 표시된 완전한 거래 설정을 그립니다 추세 구역: 차트를 강세(녹색) 또는 약세(분홍색) 기간으로 색상 구분 통계 표시: 각 추세가 지속된 바 수와 포인트 수 표시 정보 패널: 현재 추세 상태 및 마지막 신호 시간 표시 알림 시스템: 새로운 신호 발생 시 팝업, 이메일 또는 소리 알림 수신 신호당 한 번만 알림(성가신 반복
The Absorption & Exhaustion Detector Professional indicator is a sophisticated volume analysis tool designed to identify critical market turning points by analyzing the relationship between price movement and cumulative volume delta (CVD). This indicator helps traders spot when price movements lack volume confirmation, indicating potential absorption or exhaustion zones. KEY FEATURES Real-time Cumulative Volume Delta (CVD) calculation and normalization Price-volume divergence gap measurement dis
Visual Range Directional Force Indicator
AL MOOSAWI ABDULLAH JAFFER BAQER
Range Directional Force Indicator – Designed for You to Optimize! The Range Directional Force Indicator is a cutting-edge tool designed to empower traders by visualizing market dynamics and directional strength. Built to offer insights into market trends and reversals, this indicator is an invaluable asset for traders seeking precision in their strategies. However, it is important to note that this indicator is not optimized, leaving room for you to tailor it to your unique trading preferences.
First time on MetaTrader, introducing IQ Star Lines - an original Vedic Astrology based indicator. "Millionaires don't use astrology, billionaires do" . - J.P. Morgan, Legendary American financier and banker. IQ Star Lines, an unique astrological indicator purely based on   Vedic astrology   calculations, published for the   first time on Metatrader.  This unique tool plots dynamic planetary grid lines based on real-time stars, constellations, and celestial movements, which allows you to plot t
ZIVA TrendX
Hassan Abdullah Hassan Al Balushi
ZIVA TrendX is a professional trend-oriented indicator engineered to provide a clear and structured assessment of market direction through a cloud-based analytical framework. The indicator analyzes price behavior relative to dynamically derived trend boundaries, forming a continuous cloud structure that visually represents the prevailing market bias. This structure enables traders to maintain alignment with dominant directional conditions while filtering short-term market noise. All internal ca
Fibrillar
Vitalii Zakharuk
It is very easy to use the Fibrillar indicator, since the simplest is to look at the chart and act according to the indications of the colored arrows. The algorithm takes into account the measurement of prices, and this method also focuses on measuring each of the price drops (H / C, H / O, LC, LO) - which gives more detailed information, but also more averaged. When calculating this indicator, logarithmic gains are first calculated at the closing price, which allows you to filter out the tren
Mean Reversal Heikin Ashi Indicator calculates special trade reversal points based on Heikin Ashi candlesticks patterns. This indicator can be used on all symbols, even in Forex or B3 Brazillian Markets. You can configure just the position of each arrow. Then, after include the indicator on the graphic, pay attention on each arrow that indicates a long or short trade.
# SSL ST Strategy MT5 Indicator - Korean Version SSL ST Strategy MT5 지표는 거래자가 거래 차트에서 매수 및 매도 신호를 명확하게 식별하도록 도와주기 위해 설계된 기술 분석 도구입니다. 선과 화살표 같은 시각적 지표, 음성, 팝업 및 푸시 알림을 제공하여 거래 기회가 발생할 때 거래자에게 즉시 알립니다. ## 주요 장점 - 색상이 지정된 선(SSL1 및 기준선)과 매수(녹색 삼각형) 및 매도(빨간색 삼각형) 신호를 위한 화살표를 사용하여 차트에서 직접 명확한 시각 신호를 제공합니다. - 음성 알림, 팝업 알림 및 모바일 푸시 알림을 지원하여 거래자가 화면에서 멀리 있어도 중요한 신호를 놓치지 않도록 합니다. - 신호 로직 반전을 허용하여 다양한 거래 전략이나 시장 조건에 적응할 수 있습니다. - 고가, 저가 및 종가를 기반으로 한 지수 이동 평균(EMA)을 사용하여 보다 반응성 높고 부드러운 신호 생성을 제공합니다. - 동
이 제품의 구매자들이 또한 구매함
AriX
Temirlan Kdyrkhan
1 (4)
AriX Indicator for MT5 A powerful trend-following and signal-evaluation tool AriX is a custom MT5 indicator that combines Moving Averages and ATR-based risk/reward logic to generate clear buy/sell signals. It visualizes dynamic SL/TP levels, evaluates past trade outcomes, and displays win/loss statistics in a clean on-chart panel. Key features include: Buy/Sell signals based on MA crossovers ATR-based SL/TP1/TP2/TP3 levels with visual lines and labels Signal outcome tracking with real-time stat
OmniSync Projection
Antonio-alin Teculescu
5 (1)
Chronos Fractal Engine is an innovative price projection indicator for MetaTrader 5, designed to transform your technical analysis by intelligently identifying and projecting historical price patterns. Built upon an advanced correlation algorithm and the fractal principles of the market, this powerful tool visualizes potential future price movements, giving you a unique edge in your trading decisions. What is Chronos Fractal Engine? At its core, the Chronos Fractal Engine employs a sophisticat
Azimuth Pro
Ottaviano De Cicco
5 (4)
LAUNCH PROMO Azimuth Pro price is initially set at 299$ for the first 100 buyers. Final price will be 499$ . THE DIFFERENCE BETWEEN RETAIL AND INSTITUTIONAL ENTRIES ISN'T THE INDICATOR — IT'S THE LOCATION. Most traders enter at arbitrary price levels, chasing momentum or reacting to lagging signals. Institutions wait for price to reach structured levels where supply and demand actually shift. Azimuth Pro maps these levels automatically: swing-anchored VWAP, multi-timeframe structure lines, an
ARIPoint
Temirlan Kdyrkhan
ARIPoint is a powerful trading companion designed to generate high-probability entry signals with dynamic TP/SL/DP levels based on volatility. Built-in performance tracking shows win/loss stats, PP1/PP2 hits, and success rates all updated live. Key Features: Buy/Sell signals with adaptive volatility bands Real-time TP/SL/DP levels based on ATR Built-in MA Filter with optional ATR/StdDev volatility Performance stats panel (Success, Profit/Loss, PP1/PP2) Alerts via popup, sound, push, or email Cu
" Dynamic Scalper System MT5 " 지표는 추세 파동 내에서 스캘핑 방식으로 거래하도록 설계되었습니다. 주요 통화쌍 및 금에서 테스트되었으며, 다른 거래 상품과의 호환성이 가능합니다. 추가적인 가격 변동 지원을 통해 추세에 따라 단기 포지션 진입 신호를 제공합니다. 지표의 원리 큰 화살표는 추세 방향을 결정합니다. 작은 화살표 형태의 스캘핑 신호를 생성하는 알고리즘은 추세 파동 내에서 작동합니다. 빨간색 화살표는 상승 방향을, 파란색 화살표는 하락 방향을 나타냅니다. 민감한 가격 변동선은 추세 방향으로 그려지며, 작은 화살표의 신호와 함께 작용합니다. 신호는 다음과 같이 작동합니다. 적절한 시점에 선이 나타나면 진입 신호가 형성되고, 선이 있는 동안 미결제 포지션을 유지하며, 완료되면 거래를 종료합니다. 권장되는 작업 시간대는 M1~H4입니다. 화살표는 현재 캔들에 형성되며, 다음 캔들이 이미 시작되었더라도 이전 캔들의 화살표는 다시 그려지지 않습니다. 입
CGE Trading Suite
Carl Gustav Johan Ekstrom
5 (1)
CGE Trading Suite delivers the analytical edge typically reserved for professional trading desks. The platform integrates a full suite of analytical tools into one seamless workflow: dynamic grid mapping, liquidity behavior analysis, ECM, trend lines, MIDAS, trade cycles, and directional channel projections. Together, these provide a unified view of market structure and momentum. Directional clarity is further enhanced by the capital flow index, which measures currency basket strength to identif
Pointer Trend Switch — precision trend reversal indicator Pointer Trend Switch is a high-precision arrow indicator designed to detect key moments of trend reversal based on asymmetric price behavior within a selected range of bars. It identifies localized price impulses by analyzing how far price deviates from the opening level, helping traders find accurate entry points before a trend visibly shifts. This indicator is ideal for scalping, intraday strategies, and swing trading, and performs equa
ARIScalping
Temirlan Kdyrkhan
ARIScalp is a powerful trading companion designed to generate high-probability entry signals with dynamic TP/SL/DP levels based on volatility. Built-in performance tracking shows win/loss stats, PP1/PP2 hits, and success rates all updated live. Key Features: Buy/Sell signals with adaptive volatility bands Real-time TP/SL/DP levels based on ATR Built-in MA Filter with optional ATR/StdDev volatility Performance stats panel (Success, Profit/Loss, PP1/PP2) Alerts via popup, sound, push, or email Cus
Institutional Secret Method
Tshidiso Sydwell Moiloa
The Institutional Secret Method  represents a paradigm shift in market analysis, moving away from lagging indicators and into the realm of Topological Finance . It is engineered to decode the hidden geometry of price movement by calculating the most efficient path—the Geodesic —between current price action and institutional liquidity targets. The system views the market as a physical landscape where price is naturally drawn toward massive pools of liquidity (Stops). It uses two primary calculati
Transaction Speed MT5
Ivan Stefanov
5 (3)
이 지표는 시장에서 관심이 나타나는 영역 을 강조 표시한 후, 주문이 누적되는 영역 을 보여줍니다. 이는 **대규모 오더북(호가창)**처럼 작동합니다. 이것은 거대한 자금 을 위한 인디케이터입니다. 성능은 탁월하며, 시장에서 어떤 관심이 있든 반드시 포착할 수 있습니다 . (이것은 완전히 새로 작성되고 자동화된 버전 입니다 – 이제 수동 분석은 필요하지 않습니다.) **거래 속도(Transaction Speed)**는 새로운 개념의 인디케이터로, 시장에 대규모 주문이 언제, 어디에 쌓이는지를 보여주며 , 그 이점을 분석합니다. 매우 초기 단계에서 트렌드 전환 을 감지할 수 있습니다. FX 시장에서 흔히 사용하는 "거래량(volume)"은 오해입니다. 실제로는 시간당 가격 변화량 이므로, 올바른 용어는 거래 속도 입니다. 우리가 어떻게 사고하고, 행동하며, 분석하느냐 가 가장 중요합니다. 분석 패러다임의 전환 은 필수적입니다. 이 인디케이터는 외환 시장에서의 볼륨 개념을 논리적으로
TrendMaestro5
Stefano Frisetti
note: this indicator is for METATRADER4, if you want the version for METATRADER5 this is the link:  https://www.mql5.com/it/market/product/108106 TRENDMAESTRO ver 2.5 TRENDMAESTRO recognizes a new TREND from the start, he never makes mistakes. The certainty of identifying a new TREND is priceless. DESCRIPTION TRENDMAESTRO identifies a new TREND in the bud, this indicator examines the volatility, volumes and momentum to identify the moment in which there is an explosion of one or more of these da
Weis Wave with Alert MT5
Trade The Volume Waves Single Member P.C.
4.94 (17)
Rental/Lifetime Package Options and Privileges  Rent Monthly Six Months   Yearly/Lifetime Weis Wave with Speed with Alert+Speed Index x x x Manual  x x x Quick Set up Video x x x Blog x x x Lifetime Updates x x x Setup and Training Material x x Discord Access Channel "The SI traders"          x Rectangle Break Alert Tool      x How to trade with it:    http://www.tradethevolumewaves.com   ** If you purchase please contact me to setup your  : Training Room and  complete manual access.  Wei
Rtc ML Ai Predictor
Muhammad Faisal Sagala
Rtc ML Ai | Predictor CORE MACHINE LEARNING ENGINE Adaptive ML Market Predictor – Multi-Bar Trend & Candle Forecast What This Indicator Does This indicator is a  real-time market prediction engine  designed to analyze price behavior and estimate  future market tendencies . Unlike conventional indicators, this system  does not rely on static parameters or historical curve-fitting , but adapts its internal state dynamically during live market operation. Instead of using static rules, the indic
Jita Indicator Pro
Jimmy Mwaba
1 (1)
Jita Indicator Pro MT5 | All Timeframes Professional Trend Agreement System – Premium Edition ($500) What Is Jita Indicator Pro? Jita Indicator Pro is a structured trend-confirmation system designed for serious traders who value precision, alignment, and controlled signal behavior. It combines: Advanced band-based trend direction logic ATR-driven structural trigger engine Dual-confirmation agreement system Locked history update design This indicator prints signals only when multiple conditions
Recommended TimeFrame >= H1. 100% Non Repainted at any moment.  Use it carefully, only with Trend Direction. Trading Usage: 2 Variants: as Range System or as BreakOut System (Both Only With Trend Direction)::: (Always use StopLoss for minimise Risk); [1] as Range System: (Recommended) in UP TREND:  - BUY in Blue Line , then if price goes down by 50 points (on H1) open Second BUY.   Close in any Profit you wish: TrailingStop(45 points) or Close when Price touches upper Gold Line. in DOWN TREND
Max Ribbon Mt5
Stefano Frisetti
WARNING: This indicator is distributed EXCLUSIVELY on MQL5.com MT4 version:   https://www.mql5.com/it/market/product/160363 MT5 version:   https://www.mql5.com/it/market/product/160410 ============================================================================================= MAX RIBBON ver 1.00 The indicator that shows you the TREND clearly and unambiguously! ============================================================================================= DESCRIPTION MAX RIBBON is an advanced tre
AlgoEAs Trend Dashboard V1 Indicator for MT5 Introduction: This is a Dashboard Indicator based on 7 built in Multi Timeframe indicators. This strategy gives Buy/Sell Ideas based on 9 trend states. Easy to view gas guage to view current trend. Has as optional Alerts to enable with 9 messages. Run on M15 chart, with M15, H1, and H4 indicator time frames. Great tool! Features: Non-Repainting Dashboard For Desktop MT5 Only, Works On Any Mt5 Pair Great for Intraday and Swing Trading Easy view gas
IVISTscalp5
Vadym Zhukovskyi
5 (6)
당신에게 소개하는 iVISTscalp5 지표는 독특하면서도 거래 작업에서 효과적입니다. 이 지표는 시간 데이터를 기반으로 하며 금융 시장의 많은 경험과 깊은 분석의 결과입니다. iVISTscalp5 지표는 수동 거래에 뛰어난 도구입니다. 편리성, 간단함 및 시각화 - 모든 복잡성은 숨겨져 있습니다. 우리는 iVISTscalp5 지표의 설정과 사용을 최대한 단순화했습니다. 이 지표는 MT5 터미널에서 가지고 있는 모든 금융 상품에 적합합니다. 시간 기준으로 작동하는 시간은 4am에서 8pm (UTC+3)입니다. iVISTscalp5 지표 메뉴 (스크린샷 1 참조): History - 표시할 주간 수 계산 dT_min - 시간 설정 간격 선택 (분) TFline - 수평 볼륨 생성 (타임프레임) BARSline - 수평 볼륨 생성 (바 수) TFtrend1 - 매일 채널 생성 (타임프레임) BARStrend1 - 매일 채널 생성 (바 수) TFtrend2 - 주간 채널 생성 (타임프레임
+++++++++++++++++++++++++++++++++++++++++++++++++++++++++++++++++++++++++++++++++++++++++++++++++ +++ Link to EURUSD Only Free Version -->  https://www.mql5.com/en/market/product/156904?source=Unknown +++++++++++++++++++++++++++++++++++++++++++++++++++++++++++++++++++++++++++++++++++++++++++++++++ Hallo Trader, This is a traditional GANN & FIBONACCI strategy based on detection of an impulsive move in the opposite direction. This is called a Breakout. At the moment of Breakout, the indicator draw
Big Player Range
Thalles Nascimento De Carvalho
5 (3)
BigPlayerRange – MT5 최고의 지표 BigPlayerRange 는 MetaTrader 5에서 미니 인덱스와 미니 달러를 위한 최고의 지표 로 평가받고 있습니다. 이 도구는 주요 기관 투자자들의 전략적 영역을 강조하여 높은 정확도의 기관 기술 분석을 제공합니다. BigPlayerRange 사용법: 이 지표는 매수 구간(녹색선)과 매도 구간(빨간선)을 표시합니다. 가격이 이 구간 밖에서 마감되면 추세 움직임이 예상됩니다. 녹색선 위에서 마감: 강한 매수세와 상승 추세 가능성. 빨간선 아래에서 마감: 매도 압력과 하락 가능성. 범위 내에서 마감: 횡보 시장, 돌파 신호 대기. 주요 혜택: 기관 투자자 영역 매핑: 주요 투자자들의 활동 구간을 식별합니다. 자동 목표 지점 산출: 거래 종료에 적합한 목표 지점을 제공합니다. 풀백 분석: 리스크 관리를 위한 가격 반등 가능성 평가. 활용 방법: BigPlayerRange와 함께 Imba
무료 AUX 지표, EA 지원 및 전체 가이드를 얻으시려면 방문하세요 – https://www.mql5.com/en/blogs/post/763955 트렌드를 포착하세요. 패턴을 읽으세요. 진입 시점을 타이밍하세요. 30초 이내의 3단계! 분석 없이도 쉽게 거래하세요 — 당신의 스마트 어시스턴트가 워크플로우를 단순화해 드립니다. 더 이상 차트 과부하 없음. 스마트 바이어스 감지로 자신감 있게 거래하세요. 모든 통화, 암호화폐, 주식, 금속, 지수 및 모든 시간대와 호환됩니다. 그냥 클릭하고 실행하세요 — 정말 간단합니다. 속도와 명확성을 원하는 바쁜 트레이더에게 이상적입니다. TPTSyncX는 추세, 패턴, 그리고 캔들스틱 트리거 분석을 하나로 통합하여 깨끗하고 지능적인 시각 시스템으로 동기화하는 강력한 올인원 MetaTrader 5 인디케이터입니다. 명확성, 정밀성, 속도를 원하는 트레이더를 위해 설계되었으며, 가격 행동, 구조적 패턴 및 시장 타이밍 도구의 조합을 통해 높은 확
From The Sons comes the Alpha. Our intention is to bridge institutional with retail analysis just to ensure level ground at affordable rates for us all.  The Mathematical Inevitability of Alpha: ATHENA x PROMETHEUS = Predator Pulse AI (Alpha)  In the global theater of finance, the "retail trader" is often just liquidity for the giants. To survive, you don't need a better indicator; you need a fundamental shift in how you perceive reality. The ATHENA x PROMETHEUS system is not a tool—it is a mat
Meravith MT5
Ivan Stefanov
마켓 메이커를 위한 도구. Meravith는 다음과 같은 기능을 제공합니다: 모든 타임프레임을 분석하고 현재 유효한 추세를 표시합니다. 강세와 약세 거래량이 동일한 유동성 구간(거래량 균형 구간)을 강조 표시합니다. 서로 다른 타임프레임의 모든 유동성 레벨을 차트에 직접 표시합니다. 텍스트 기반 시장 분석을 생성하여 참고용으로 제공합니다. 현재 추세를 기반으로 목표가, 지지선 및 손절가를 계산합니다. 거래의 위험 대비 보상 비율(Risk/Reward)을 계산합니다. 계좌 잔고에 따라 포지션 크기를 산출하고 잠재 수익을 추정합니다. 시장에 중대한 변화가 발생할 경우 경고도 제공합니다. 지표의 주요 라인: 강세/약세 거래량 소진 라인 — 목표가로 사용됩니다. 시장 추세를 나타내는 라인. 시장이 강세인지 약세인지에 따라 색상이 변경되며 추세 지지선 역할을 합니다. 색상은 주로 시장 심리를 보여줍니다. 거래량 균형선(Eq). Eq(Volume Equilibrium) 라인은 시스템의 핵심입니
Hunter Spike
Jaime Humberto Gomez Arias
Hunter Spike This indicator consists of two regression channels calibrated with the current movement of the synthetic index algorithm, for any Deriv or Weltrade broker. Each channel has a signal, a target that alerts us when the price touches them, indicating buys on booms or gains and sells on crashes or pains. -configuration for booms or gains: Channel zone 1 (30) Channel zone 2 (0) -configuration for crashes or pains: Channel zone 1 (100) Channel zone 2 (70) Zones freely configurable by
Pantera Indicator
Temirlan Kdyrkhan
5 (1)
A tool for on-chart strategy backtesting and performance analysis. A utility for developing, debugging, and testing custom trading ideas and indicator functions. An indicator designed to quickly test trading concepts and visualize the effectiveness of different input parameters. An all-in-one sandbox for testing everything from simple crossovers to complex, multi-condition trading systems.
VTrende Pro
Andrii Diachenko
5 (1)
VTrende Pro - MTF indicator for trend trading with a display panel for MT5 *** Videos can be translated into any language using subtitles (video language - Russian) Although the signals of the VTrende Pro indicator can be used as signals of a full-fledged trading system, it is recommended to use them in conjunction with the Bill Williams TS. VTrende Pro is an extended version of the VTrende indicator. Difference between Pro version and VTrende: - Time zones - Signal V - signal 1-2 waves -    S
WanaScalper
Isaac Wanasolo
1 (1)
A scalping indicator based on mathematical patterns, which on average gives signals with relatively small SL, and also occasionally helps to catch big moves in the markets (more information in the video) This indicator has three main types of notifications: The first type warns of a possible/upcoming signal on the next bar The second type indicates the presence of a ready signal to enter the market/open a position The third type is for SL and TP levels - you will be notified every time price re
Historical Similarity Matcher Indicator (HI.SI.MA) Try it free today — demo version now available!   https://www.mql5.com/en/market/product/167114 Overview The Historical Similarity Matcher is a technical analysis indicator for MetaTrader 5. It scans historical price data to find segments that show statistical similarity to a user-selected reference period on the chart.
How to use Pair Trading Station Pair Trading Station is recommended for H1 time frame and you can use it for any currency pairs. To generate buy and sell signal, follow few steps below to apply Pair Trading Station to your MetaTrader terminal. When you load Pair Trading Station on your chart, Pair Trading station will assess available historical data in your MetaTrader platforms for each currency pair. On your chart, the amount of historical data available will be displayed for each currency pai
XCalper TFO
Aecio de Feo Flora Neto
This oscillator was developed exclusively by xCalper in 2015 based on moving averages calculations to indicate and try predicting oversold and overbought levels. The fast line (white, by default) oscillates basically between values -0.5 (oversold) and +0.5 (overbought). Whenever this line crosses upward value -0.5, it means an oversold price level. When it crosses downward value +0.5, it means an overbought price level. When fast line crosses value 0.0 and returns, it is a strong pull-back indic
제작자의 제품 더 보기
Volatility Trend System - a trading system that gives signals for entries. The volatility system gives linear and point signals in the direction of the trend, as well as signals to exit it, without redrawing and delays. The trend indicator monitors the direction of the medium-term trend, shows the direction and its change. The signal indicator is based on changes in volatility and shows market entries. The indicator is equipped with several types of alerts. Can be applied to various trading ins
" Dynamic Scalper System MT5 " 지표는 추세 파동 내에서 스캘핑 방식으로 거래하도록 설계되었습니다. 주요 통화쌍 및 금에서 테스트되었으며, 다른 거래 상품과의 호환성이 가능합니다. 추가적인 가격 변동 지원을 통해 추세에 따라 단기 포지션 진입 신호를 제공합니다. 지표의 원리 큰 화살표는 추세 방향을 결정합니다. 작은 화살표 형태의 스캘핑 신호를 생성하는 알고리즘은 추세 파동 내에서 작동합니다. 빨간색 화살표는 상승 방향을, 파란색 화살표는 하락 방향을 나타냅니다. 민감한 가격 변동선은 추세 방향으로 그려지며, 작은 화살표의 신호와 함께 작용합니다. 신호는 다음과 같이 작동합니다. 적절한 시점에 선이 나타나면 진입 신호가 형성되고, 선이 있는 동안 미결제 포지션을 유지하며, 완료되면 거래를 종료합니다. 권장되는 작업 시간대는 M1~H4입니다. 화살표는 현재 캔들에 형성되며, 다음 캔들이 이미 시작되었더라도 이전 캔들의 화살표는 다시 그려지지 않습니다. 입
Cyclic Impulse
Vitalyi Belyh
차트를 구조화하고 주기적인 가격 변동을 식별하는 기술 지표입니다. 모든 차트에서 작업할 수 있습니다. 다양한 유형의 알림. 그래프 자체에도 추가 화살표가 있습니다. 역사를 재구성하지 않고, 촛불을 닫는 작업에 임한다. M5 이상에서 권장되는 TF입니다. 사용 및 구성이 쉬운 매개변수입니다. 매개변수가 다른 2개의 지표를 사용하는 경우, 다른 지표 없이 해당 지표만 사용할 수 있습니다. 2개의 입력 매개변수가 있습니다 주기성과 신호 지속 시간 이 2개의 매개변수는 차트 구조의 처리와 관련이 있습니다. Cyclicity - 역전 주기가 얼마나 자주 바뀌는지 조절하고 주기를 매끄럽게 합니다. Signal duration - 최소 숫자에서는 가격 움직임의 충격을 감지하고, 최대 숫자에서는 장기적 추세 움직임을 감지합니다.. --------------------------------
Scalping Lines System MT5 - 은 M1-H1 시간 프레임에서 금(XAUUSD) 자산을 거래하기 위해 특별히 설계된 스캘핑 트레이딩 시스템입니다. 추세, 변동성, 과매수/과매도 시장 분석 지표를 하나의 오실레이터로 통합하여 단기 신호를 식별합니다. 신호선의 주요 내부 매개변수는 사전 설정되어 있습니다. "Trend Wave Duration"은 이동평균선 추세를 사용하여 추세 방향으로 일련의 신호 지속 시간을 조절하고, "Apply Smoothing to Signal Line"은 신호선 생성 방식을 조정하는 매개변수로, 수동으로 조정할 수 있습니다. 시가에서 신호선을 계산할 때는 차트가 다시 그려지지 않습니다. 다른 가격대에서는 신호 화살표가 깜빡일 수 있습니다. 신호는 캔들 마감 후에 나타나며, 다양한 알림 유형을 사용할 수 있습니다. 권장 시간 프레임: M1, M5, M15, M30, H1. 이 지표는 원래 금 거래를 위해 설계되었지만, 스프레드가 낮은 변
Cyclic Impulse MT5 — 이 기술 지표는 차트 구조를 분석하여 주기적인 가격 움직임을 식별합니다. 이를 통해 주기적인 가격 움직임의 반전과 진입 신호를 찾을 수 있습니다. 지표 작동 방식 주기적인 하락 움직임이 감지되면 캔들 마감 후 파란색 하락 막대가 생성됩니다. 현재 캔들에서 잠시 깜빡일 수 있으며, 신호는 아직 확정되지 않았습니다. 파란색 화살표는 가격 차트에 중복 표시됩니다. 주기적인 상승 움직임이 감지되면 캔들 마감 후 빨간색 상승 막대가 생성됩니다. 현재 캔들에서 잠시 깜빡일 수 있으며, 신호는 아직 확정되지 않았습니다. 주황색 ​​화살표는 가격 차트에 중복 표시됩니다. 모든 차트, 시간 프레임, 거래 상품에 사용 가능합니다. 다양한 알림 유형을 제공합니다. 가격 차트에 추가 화살표를 표시합니다. 과거 차트에는 다시 그려지지 않으며, 캔들 마감 시에만 작동합니다. 캔들이 마감되더라도 화살표나 막대는 사라지지 않습니다. 사용 및 매개변수 설정이 간편하며,
Angular Trend Lines MT5
Vitalyi Belyh
5 (1)
추세 지표는 금융시장 거래에 사용되는 기술 분석 분야 중 하나입니다. Angular Trend Lines - 추세 방향을 종합적으로 판단하고 진입 신호를 생성합니다. 캔들의 평균 방향을 매끄럽게 하는 것 외에도 또한 추세선의 경사각도 사용합니다. 갠 각도를 구성하는 원리는 경사각의 기초로 사용되었습니다. 기술 분석 지표는 촛대 평활화와 차트 기하학을 결합한 것입니다. 트렌드 라인과 화살표에는 두 가지 유형이 있습니다. 강세 방향의 빨간색 선과 화살표. 약세 방향의 보라색 선과 화살표. 표시기 기능 이 지표는 사용하기 쉽고 매개변수를 구성할 수 있으며, 추세 분석과 주문 개시를 위한 신호 수신에 사용할 수 있습니다. 지표는 다시 그려지지 않고, 화살표는 캔들 마감 시점에 나타납니다. 신호가 발생하면 여러 유형의 알림을 제공합니다. 모든 금융 상품(외환, 암호화폐, 금속, 주식, 지수)에 사용할 수 있습니다. 해당 지표는 모든 시간 범위와 차트에서 작동할 수 있습니다. 이 지표는
Arrow Micro Scalper 는 스캘핑 및 단기 거래용으로 설계된 지표로 모든 차트 및 금융 상품(통화, 암호화폐, 주식, 금속)에 통합되어 있습니다. 그녀는 작업에서 파동 분석과 추세 방향 필터를 사용합니다. M1부터 H4까지의 시간대에 사용하는 것이 좋습니다. 표시기로 작업하는 방법. 표시기에는 설정 변경을 위한 2개의 외부 매개변수가 포함되어 있으며 나머지는 기본적으로 이미 구성되어 있습니다. 큰 화살표는 추세 방향의 변화를 나타내고 파란색 화살표는 하락 추세의 시작을 나타내며 분홍색 화살표는 상승 추세의 시작을 나타냅니다. " Only trending direction " 매개변수는 내부 트렌드를 사용하는 모드를 켜고 끄며 자신만의 트렌드를 사용하거나 트렌드 방향 없이 작업할 수 있는 기회를 제공합니다. 또한 트렌드에서만 트렌드 화살표 및 신호 화살표 표시를 켜거나 끕니다. . 지표의 가장 중요한 개체인 작은 신호 화살표는 "매수" 거래의 경우 분홍색, "매도" 거
Developed methods for trading collected in one indicator. In the form of arrows, it defines entries in the direction of the trend. It has 2 types of arrows - trend and signal guides, informing about the potential movement in the direction of the trend. Works without redrawing, ready for use on all symbols/tools. The most suitable time frames to use are M15, M30, H1, H4. How to use The indicator finds the direction of the trend in the form of a signal arrow, a graphic rectangle stretches along
Point Directions MT5 – 가격 변동 중 포인트 지지선과 저항선을 표시하는 지표입니다. 화살표는 지정된 방향으로 가격이 반등할 때를 나타냅니다. 화살표는 다시 그려지지 않으며 현재 캔들을 기준으로 형성됩니다. 모든 시간대와 거래 상품에서 작동합니다. 여러 유형의 알림을 사용할 수 있습니다. 모든 차트에 대한 신호를 사용자 정의할 수 있는 고급 설정이 있으며, 추세 및 조정 거래에 맞게 구성할 수 있습니다. 화살표를 표시하려면 두 가지 유형의 이동 평균선과 화살표 강도 수준을 사용할 수 있습니다. 자세한 설정은 입력 매개변수에 설명되어 있습니다. 사용 관련 문의는 비공개 메시지를 보내주세요. 입력 매개변수 Method MA – 화살표 생성에 이동 평균을 사용할지 선택합니다(표준 또는 가속). Accelerated MA period/Standard MA period – 이동 평균 기간(5~500)을 변경합니다. Ma Metod – 이동 평균 방식을 변경합니다. Ma
Arrow Micro Scalper 는 스캘핑 및 단기 거래용으로 설계된 지표로 모든 차트 및 금융 상품(통화, 암호화폐, 주식, 금속)에 통합되어 있습니다. 그녀는 작업에서 파동 분석과 추세 방향 필터를 사용합니다. M1부터 H4까지의 시간대에 사용하는 것이 좋습니다. 표시기로 작업하는 방법. 표시기에는 설정 변경을 위한 2개의 외부 매개변수가 포함되어 있으며 나머지는 기본적으로 이미 구성되어 있습니다. 큰 화살표는 추세 방향의 변화를 나타내고 파란색 화살표는 하락 추세의 시작을 나타내며 분홍색 화살표는 상승 추세의 시작을 나타냅니다. " Only trending direction " 매개변수는 내부 트렌드를 사용하는 모드를 켜고 끄며 자신만의 트렌드를 사용하거나 트렌드 방향 없이 작업할 수 있는 기회를 제공합니다. 또한 트렌드에서만 트렌드 화살표 및 신호 화살표 표시를 켜거나 끕니다. . 지표의 가장 중요한 개체인 작은 신호 화살표는 "매수" 거래의 경우 분홍색, "매도" 거
Wave Reversal Indicator
Vitalyi Belyh
4 (2)
Wave Reversal Indicator - determines the direction of trend waves and price reversals. The indicator shows wave movements and trend directions. It gives recommendations where to follow the trader, helps to follow the trading strategy. It is an addition to an intraday or medium-term strategy. Almost all parameters are selected for each time frame and are changed automatically, the only parameter for manual adjustment is the wavelength. Works on various trading instruments and timeframes, recomme
FREE
Volatility Trend System - a trading system that gives signals for entries. The volatility system gives linear and point signals in the direction of the trend, as well as signals to exit it, without redrawing and delays. The trend indicator monitors the direction of the medium-term trend, shows the direction and its change. The signal indicator is based on changes in volatility and shows market entries. The indicator is equipped with several types of alerts. Can be applied to various trading ins
Upper and Lower Reversal - 반전 순간의 조기 예측을 위한 시스템입니다. 상한 및 하한 가격 이동 채널의 경계에서 가격 전환점을 찾을 수 있습니다. 표시기는 신호 화살표의 색상을 다시 지정하거나 위치를 변경하지 않습니다. 빨간색 화살표는 매수 신호, 파란색 화살표는 매도 신호입니다. 모든 기간 및 거래 수단에 맞게 조정됩니다. 표시기는 다시 그려지지 않으며 양초가 닫힐 때만 작동합니다. 신호에 대한 경고에는 여러 유형이 있습니다. 이 표시기는 사용하기 쉽고 2개의 외부 구성 매개변수만 있습니다. Channel Length - 신호가 구축될 가격 채널의 길이를 조정합니다. Signal Normalization - 신호 화살표의 품질 수준을 변경합니다. 매개변수가 높을수록 잘못된 신호가 줄어듭니다(BTC, 금 및 변동성이 높은 상품의 경우 몇 배로 변경됨). Alerts play sound / Alerts display message / Alerts send n
Point Directions
Vitalyi Belyh
5 (1)
Point Directions – 가격 변동 중 포인트 지지선과 저항선을 표시하는 지표입니다. 화살표는 지정된 방향으로 가격이 반등할 때를 나타냅니다. 화살표는 다시 그려지지 않으며 현재 캔들을 기준으로 형성됩니다. 모든 시간대와 거래 상품에서 작동합니다. 여러 유형의 알림을 사용할 수 있습니다. 모든 차트에 대한 신호를 사용자 정의할 수 있는 고급 설정이 있으며, 추세 및 조정 거래에 맞게 구성할 수 있습니다. 화살표를 표시하려면 두 가지 유형의 이동 평균선과 화살표 강도 수준을 사용할 수 있습니다. 자세한 설정은 입력 매개변수에 설명되어 있습니다. 사용 관련 문의는 비공개 메시지를 보내주세요. 입력 매개변수 Method MA – 화살표 생성에 이동 평균을 사용할지 선택합니다(표준 또는 가속). Accelerated MA period/Standard MA period – 이동 평균 기간(5~500)을 변경합니다. Ma Metod – 이동 평균 방식을 변경합니다. Ma Pri
Wave Price Channel - 충동과 수정을 검색하도록 설계된 거래 분석 시스템입니다. 이 지표를 사용하면 변동성을 기반으로 구축된 가격 채널 방향으로 작업할 수 있습니다. 채널에 위쪽 또는 아래쪽 화살표가 그려지면 이 방향으로의 신호가 가격 변화에 민감한 점 표시로 확인됩니다. 같은 색의 점이 계속되는 한 신호는 계속됩니다. 화살표는 있지만 같은 색상의 점이 없으면 신호는 거짓이므로 점이 나타나면 이를 따라가야 합니다. 표시기에는 다양한 기간에 대해 변경할 수 있는 유일한 변경 가능한 매개변수인 "가격 채널 길이"가 있습니다. Time Frames M15 이상에서 사용하는 것이 좋습니다. 모든 거래 상품에 사용할 수 있습니다. 화살표에는 여러 유형의 경고가 있습니다. 작동 중에 신호 화살표를 1개의 캔들로 변경할 수 있습니다. 빨간색 위쪽 화살표가 나타나면 구매하라는 신호이고 빨간색 점은 화살표 궤적의 연속입니다. 노란색 아래쪽 화살표가 나타나면 판매하라는 신호이고 노란
Candle Binary Scalper - is a technical analysis product for forex and binary options. Includes several technical indicators combined into a trading system. Suitable for manual trading within a trend, for scalping and binary options. Works on all time frames and trading instruments. Recommended Timeframes for trading M15, M30, H1 and H4, M5 and M1 should be used in case of high volatility. There are several types of alerts. How to use the product The optimal settings have already been selected
The BB Reversal Arrows technical trading system has been developed to predict reverse points for making retail decisions. The current market situation is analyzed by the indicator and structured for several criteria: the expectation of reversal moments, potential turning points, purchase and sale signals. The indicator does not contain excess information, has a visual understandable interface, allowing traders to make reasonable decisions. All arrows appear to close the candle, without redrawin
Indicator for manual trading and technical analysis for Forex. It consists of a trend indicator with the opening level of the trading day and a arrow indicator for determining entry points. The indicator does not recolor; it works when the candle closes. Contains several types of alerts for signal arrows. Can be configured to work on any chart, trading instrument or time frame. The work strategy is based on searching for price movements along the trend.  To make " Buy " transactions: The tre
Trade Balance Indicator
Vitalyi Belyh
5 (1)
A trend indicator showing the strength of bulls and bears in a trading range. Consists of two lines: The green line is a balanced overbought/oversold condition. The red line is the direction of trading activity. Does not redraw calculations. Can be used on all Symbols/Instruments/Time Frames. Easy to use and set up. How to use the indicator and what it determines. The basic rule is to follow the direction of the red line: if it crosses the green line from the bottom up, the market is dominat
FREE
" ZigZag on Trend " 지표는 가격 움직임 방향을 파악하는 데 도움이 되는 지표이며, 막대 및 핍 계산기 기능도 제공합니다. 이 지표는 추세 지표, 가격 방향을 추적하는 지그재그로 표현된 추세선, 그리고 추세 방향으로 지나가는 막대 수와 수직선의 핍 수를 계산하는 카운터로 구성됩니다(계산은 막대의 시작점을 기준으로 합니다). 이 지표는 다시 채색되지 않습니다. 편의상 색상이 있는 막대 또는 선으로 표시됩니다. 모든 시간대에서 사용할 수 있지만, M5 이상에서 사용하는 것이 가장 좋습니다. " Period "은 가격 방향을 검색할 막대 수를 결정합니다. 한 방향으로 완만한 추세를 얻기 위해 방향의 길이를 계산합니다. " Diapason "는 추세 방향의 빈도를 조정하며, 주로 다양한 거래 상품의 첫 번째 매개변수를 조정합니다(EURUSD의 경우 최대 10개, GOLD의 경우 최대 100개). 핍 카운터는 모든 시간대 및 거래 상품에 대한 조정을 지원합니다. 주요 지표
Arrow indicator with trend filter. Generates trend input without delays or delays - on the emerging candle. Suitable for use on any trading tools and timeframes. Easy to use, contains the direction of the trend in the form of a histogram lines and signal generator. Input parameters Period Trend Line - Period of the Histogram Line Signal Generator Period - If the period is longer, then the arrows are less Play sound Display pop-up message Send push notification Send email Sound file signal - Fi
Channel Cluster
Vitalyi Belyh
5 (1)
Cluster indicator working in the price channel. For operation, the indicator builds a channel line - (dashed line). Inside the channel, cluster sections are determined that determine the direction of the price movement - (histograms in two directions), start with large arrows. Small arrows are plotted above / below each histogram - indicator increase volatility. The indicator does not redraw the values. Works on any tools and timeframes. Entrances are made when large arrows appear, inside small
A technical indicator that calculates its readings based on trading volumes. It has an oscillatory line that follows the change in volumes. Large arrows on the line indicate reversal values. A channel is built around the line with small arrows showing the strengthening of price movement in the direction of increasing volumes. The indicator does not redraw values. Works on any instrument and timeframe. It can complement any trading strategy by finding a trend or make entries in the direction of a
Max Min Cycle
Vitalyi Belyh
Cyclical indicator for trading and predicting the direction of the market. Shows the cyclical behavior of the price in the form of an oscillator. Gives signals for opening deals when rebounding from the upper and lower boundaries of the oscillator. In the form of a histogram, it shows the smoothed strength of the trend. Will complement any trading strategy, from scalping to intraday. The indicator does not redraw. Suitable for use on all symbols/instruments. Suitable time frames for short-term t
Max Min Reversal Arrows - an arrow reversal indicator for predicting price movement. The indicator is built on the support and resistance levels at the local lows and highs of the price. Product features Arrows appear on the current candle. The indicator does not redraw. Can be used on all time frames and trading instruments. Recommended timeframes to use M30, H1, H4. The dotted lines are the support and resistance levels within the signal. Price movement from these levels means a reversal. Pr
Scalping Entry Points - is a manual trading system that can adjust to price movements and give signals to open trades without redrawing. The indicator determines the direction of the trend by the central level of support and resistance. The dot indicator provides signals for entries and exits.  Suitable for manual intraday trading, scalping and binary options. Works on all time frames and trading instruments. The indicator gives several types of alerts. How to use the product The blue line det
Binary Lines
Vitalyi Belyh
Binary Lines is a technical analysis indicator for currencies, commodities, cryptocurrencies, stocks, indices and any financial instruments. Can be used for binary options or Forex scalping. Shows entry and exit points at fixed intervals and provides traders the necessary information about the results of possible transactions. Entry points are formed at the very beginning of the candle, in the direction of the MA line, duration trades in bars can be adjusted manually and adjusted to any financia
A technical indicator that calculates its readings on trading volumes. In the form of a histogram, it shows the accumulation of the strength of the movement of the trading instrument. It has independent calculation systems for bullish and bearish directions. Works on any trading instruments and time frames. Can complement any trading system. The indicator does not redraw its values, the signals appear on the current candle. It is easy to use and does not load the chart, does not require addition
Line Breakouts
Vitalyi Belyh
Line Breakouts - System for trend trading. Contains a trend identifier that can be adapted to any chart and trading instrument using the period and smoothing function. And a determinant of support and resistance levels. When the price is below the resistance line, open Sell trades, and when the price is above support lines - open Buy transactions. Stop loss should be placed a few points from the lines, Take Profit should be fixed after several candles (3-10-15), based on the time frame. The indi
Point Trend Indicator - An indicator of the upper and lower level of the trend, which can determine the trend direction and indicate its strengthening. The trend direction is determined by round dots; if the points are above the zero line, the trend is bullish; if below, the trend is bearish. The increase in directional movement is indicated by arrows. It has the only parameter for manual adjustment - Duration of the trend direction.   Possibilities Works on all time frames Adapts to any financ
필터:
리뷰 없음
리뷰 답변