WaveTheory Fully automatic calculation
- Indicatori
-
Kaijun Wang
 Cooperation contact QQ: 556024
Cooperation mailbox: 556024@qq.com
Cooperation WeChat: 556024
TGGOUP: https://t.me/+qmlWO6RSTPY1ODc1 - Versione: 7.10
- Aggiornato: 11 aprile 2023
- Attivazioni: 5
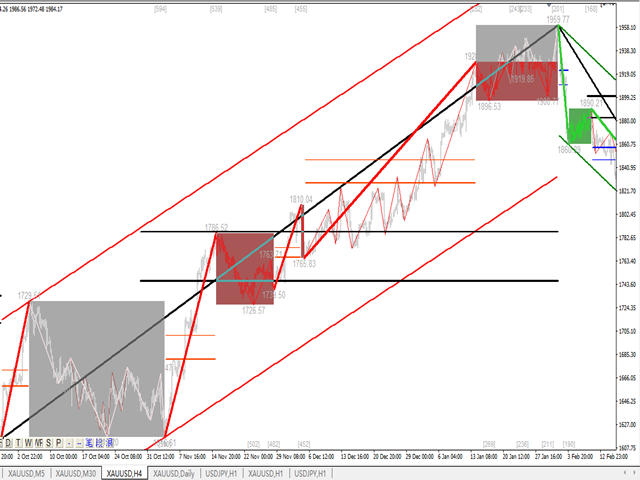
Questo indicatore è un indicatore per l'analisi automatica delle onde perfetto per il trading pratico!
Nota: non sono abituato a usare nomi occidentali per la classificazione delle onde a causa dell'influenza della convenzione di denominazione di Tang Lun (Tang Zhong Shuo Zen), ho chiamato l'onda base come penna e la banda dell'onda secondaria come segmento At allo stesso tempo, il segmento ha la direzione del trend. La denominazione è principalmente segmento di trend (questo metodo di denominazione verrà utilizzato nelle note future, lasciatemelo dire prima), ma l'algoritmo ha poco a che fare con la teoria dell'avvolgimento e non dovrebbe esserlo. confuso. Riflette le regole operative in continua evoluzione e complesse riassunte dalla mia analisi del mercato.
La banda è stata standardizzata e definita in modo che non sia più diversa per persone diverse È stato eliminato il metodo di disegno dell'interferenza artificiale, che svolge un ruolo chiave nell'analisi rigorosa dell'ingresso nel mercato.
Utilizzare questo indicatore equivale a migliorare l'estetica dell'interfaccia di trading, abbandonando il trading originale della linea K e portandoti a un nuovo livello di trading. Se non è per il trading, migliorerà anche la percezione del cliente in termini di pubblicità.
Contenuto dell'indicatore:
1. Onda di base (penna) : in primo luogo, troviamo il punto di svolta della fluttuazione di base nel processo di fluttuazione dei prezzi. Naturalmente, il suo ordine è basso, il che fornisce una base per la fase successiva del calcolo.
2. Banda d'onda secondaria ( segmento ) : Sulla base dell'onda base, attraverso l'analisi algoritmica si ottiene una banda d'onda secondaria più evidente. La banda d'onda secondaria fornisce una base di analisi per l'onda.
3. Onda ( onda ): ha un andamento più chiaro e una direzione più chiara e intuitiva. Per analizzare se un'onda continua, è necessario osservare la forma della banda secondaria e analizzare la composizione della banda secondaria per ottenere previsioni successive. dell'onda.
4. Canale: il canale viene calcolato utilizzando la regressione lineare.
5. Ritracciamento: alla fine di ciascuna banda verranno visualizzati due importanti ritracciamenti nell'onda. La forza relativa di questi importanti ritracciamenti e i ritracciamenti effettivi determinati dal combattimento reale determinano lo slancio del trend.
6. Campo di oscillazione: il campo di oscillazione è contrassegnato nell'indicatore.
Indicatori in azione:
1. La teoria pratica deriva dalla teoria ondulatoria di base e dalla teoria del Tao.
2. La teoria pratica deriva dalla pratica reale Otterrai qualcosa dopo aver letto l'immagine mille volte.
3. Inizialmente volevo scrivere qualche esperienza pratica, ma dopo aver scritto questo, ho scoperto che il piano operativo è stato leggermente adattato alle diverse varietà e ai diversi punti di forza. Il trading viene costantemente scritto e aggiornato. Il trading è come un filo sepolto nella sabbia , anche se prendi la corda. Ma la sabbia continua a cambiare forma.
4. Dopo aver utilizzato la quantificazione per definire le onde, il trading diventerà semplice ed efficace, la tendenza diventerà molto chiara, avrai in mente la tendenza generale e tutto diventerà semplice ed efficace.
5. Che si tratti di trading a sinistra o a destra, che si tratti di trading di trend o di shock trading, questo insieme di indicatori ha la sua risposta. Tutti hanno bisogno di sentire il ritmo, il livello, il livello potenziale e il momento del trend e dello shock estremamente importante.
6. Per comprendere le onde e le onde commerciali, è necessario condurre analisi multilivello e multiciclo.
Esperienza pratica:
1. Sebbene la teoria delle onde e la teoria del Tao siano state scritte nei libri, non sono diagrammi completamente conformi alle leggi delle fluttuazioni naturali. Durante l'effettivo processo di analisi delle transazioni, si troveranno molte situazioni difficili da gestire.
2. Di seguito possiamo dividere il mercato in due tipologie, il mercato ordinato e analizzabile e il mercato disordinato.
3. Ci sono tendenze e shock nel mercato ordinato e analizzabile. Questo mercato può essere analizzato da noi, cioè la parte che può essere tracciata e negoziabile. Una volta stabilita questa parte dell'ordine, continuerà ad avere le caratteristiche di ordine, in modo da poterne trarre abbastanza profitto
4. In condizioni di mercato disordinate, le fluttuazioni appariranno disordinate, il che è diverso dagli shock. Non è possibile partecipare a condizioni di mercato disordinate. Raccogliere denaro in ordine ed evitarlo in disordine.
È più adatto per oro, petrolio greggio, sterlina, bitcoin e altri prodotti di grande tendenza.


L'utente non ha lasciato alcun commento sulla valutazione.