Guarda i video tutorial del Market su YouTube
Come acquistare un Robot di Trading o un indicatore
Esegui il tuo EA
hosting virtuale
hosting virtuale
Prova un indicatore/robot di trading prima di acquistarlo
Vuoi guadagnare nel Market?
Come presentare un prodotto per venderlo con successo
Nuovi indicatori tecnici per MetaTrader 4 - 10

is designed to enhance the visual representation of financial charts in MetaTrader 4 by dynamically altering the colors of various chart elements, including candlesticks, bars, line charts, and volume bars. Its primary purpose is to improve trader intuition and engagement during market analysis by introducing smooth, cyclical color transitions that can highlight momentum shifts, trends, or volatility without overwhelming the display. This functionality is particularly beneficial for traders who
FREE

is a user-friendly MetaTrader 4 indicator that creates a centralized dashboard for traders to oversee several cryptocurrency pairs simultaneously across different timeframes, presenting price movements through simple dots or miniature candlestick charts, complemented by volume indicators to facilitate quick assessments of market trends and fluctuations. It automatically resizes grid cells according to the number of bars shown per timeframe for better use of screen space, features adjustable co
FREE
Range Cycle Indicator. Gives signal on price range cycling smoothed by moving average. It is better to use it on H1+ timeframes and avoid side markets. Because if market is flat this indicator will give too many zero profit or even losing signals. Parameters: PopUpAlert - to allow it to alert when trend changes; EMailAlert - for email alerts; period - this is a smoothing criteria, use higher values on lower timeframes; TimeFrame(new) - higher timeframe (or the same) to use for calculation, defa
FREE

Middle Band Maestro: Your Guide to Smarter Trading Decisions! Are you tired of confusing market signals and missing out on profitable trends? Introducing Middle Band Maestro , the intelligent MT4 indicator designed to cut through the noise and show you exactly when to enter and exit trades with confidence. This isn't just another indicator; it's your personal market mentor, guiding you to make decisions like a seasoned pro! Why "Middle Band Maestro" is a Must-Have: The market is full of ups and
FREE
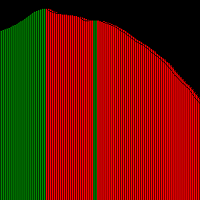
This technical indicator is suitable for foreign exchange and precious metal trading, featuring low noise. Red indicates a downtrend, while green represents an uptrend. Utilizing advanced technology and years of trading experience, it eliminates noise to form smooth curves, making it ideal for trend-following traders. It provides clear trend identification and offers straightforward entry and exit conditions for traders. Source code is available upon request. For further assistance or other serv

This is a professional trader's breakthrough system indicator that can be used for trading in various categories. Using the Hull moving average to create trend charts and provide price pressure and support positions, it provides traders with trading references for each cycle. Welcome to use it, if you have any questions, please contact us. The last 50 candlesticks for price pressure and support settings can be reset according to your needs

NeuroSlope is a precision-tuned market strength indicator that enhances RSI analysis using adaptive neuro-style smoothing. It intelligently filters out noise and volatility spikes while maintaining the RSI’s natural rhythm, creating a clean, flowing signal that better reflects underlying price momentum. The dual-histogram structure — the smart smoothed RSI (blue) and its advanced slope curve (yellow) — provides a clear visual framework for identifying directional bias, shifts in market strength,

你好,本次上架产品为内测产品,仅为内部测试,购买前务必与买家沟通,感谢你的关注,后续我们会上架一整套交易系统,谢谢。 谢谢。 谢谢。 谢谢。 谢谢。 谢谢。 谢谢。 谢谢。 谢谢。 谢谢。 谢谢。 谢谢。 谢谢。 谢谢。 谢谢。 谢谢。 谢谢。 谢谢。 谢谢。 谢谢。 谢谢。 谢谢。 谢谢。 谢谢。 谢谢。 谢谢。 谢谢。 谢谢。 谢谢。 谢谢。 谢谢。 谢谢。 谢谢。 谢谢。 谢谢。 谢谢。 谢谢。 谢谢。 谢谢。 谢谢。 谢谢。 谢谢。 谢谢。 谢谢。 谢谢。 谢谢。 谢谢。 谢谢。 谢谢。 谢谢。 谢谢。 谢谢。 谢谢。 谢谢。 谢谢。 谢谢。 谢谢。 谢谢。 谢谢。 谢谢。 谢谢。 谢谢。 谢谢。 谢谢。 谢谢。 谢谢。 谢谢。 谢谢。 谢谢。 谢谢。 谢谢。 谢谢。 谢谢。 谢谢。 谢谢。 谢谢。 谢谢。 谢谢。 谢谢。 谢谢。 谢谢。 谢谢。 谢谢。 谢谢。 谢谢。 谢谢。 谢谢。 谢谢。 谢谢。 谢谢。
FX Trend Matrix Pro Your all-in-one multi-symbol trend, correlation, and signal analysis system. Overview FX Trend Matrix Pro is a professional multi-symbol dashboard that combines trend direction, currency correlation, and signal detection into one structured matrix view.
Instantly see how trends align across symbols and timeframes — revealing the strongest trading opportunities in real time. ️ Key Features Multi-timeframe trend matrix (M1–W1) Currency correlation mapping (positive &

Трендовый индикатор. Стрелки не перерисовываются, не запаздывают и не пропадают. Подходит для работы на любом инструменте и любом таймфрейме.Подходит как дополнение к любой стратегии и стилю торговли. Рекомендовано использовать данный индикатор по принципу трёх окон. Пример: пара XAUUSD, открываем три окна данного инструмента ТФ М5,М15,Н1....первый сигнал ждем на старшем ТФ, в нашем случае Н1, второй на М15 и далее на М5. Три сигнала совпали в одном направлении входим в сделку и т.д. Выходим из
XAU Scalper MT4 Versione MT5 Uno strumento analitico per l'osservazione dei movimenti di prezzo a breve termine nelle coppie d'oro. L'Indicatore XAU Scalper fornisce segnali di acquisto e vendita basati sulla stabilità della candela, sull'RSI e sul momentum a breve termine. È progettato per aiutare i trader a identificare potenziali punti di ingresso durante i brevi movimenti di mercato nelle coppie XAU. Caratteristiche Indice di Stabilità della Candela ( Candle Stability Index ): Misura la prop
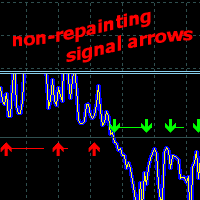
Price Direction Oscillator - è un indicatore progettato per rilevare i movimenti di mercato a breve e medio termine. Adattabile a qualsiasi mercato e timeframe,
è costituito da una linea di tendenza, un oscillatore di volatilità di mercato e un potenziale generatore di segnali di trading.
Utilizzo dell'indicatore
Determina il trend in base alla volatilità del mercato e fornisce segnali per l'apertura di ordini di ACQUISTO o VENDITA. Senza ridisegnare i dati storici, le frecce del segnale non c
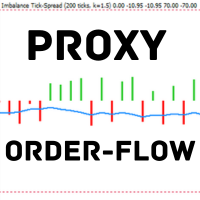
Indicatore basato sul disequilibrio del tick-spread. TF:
Funziona su tutti i timeframe (da M1 a D1). Coppie:
Compatibile con Forex, indici, oro e CFD (regolazione automatica per JPY, Oro e CFD). Impostazioni: TickWindow (200) – finestra di osservazione dei tick SpreadWeight (1.5) – peso dello spread NormalizationPeriod (20) – periodo di normalizzazione (z-score) Overbought / Oversold (±3.0) – soglie di allerta AlertCooldown (300s) – tempo di raffreddamento tra gli avvisi Conclusione:
Proxy Or
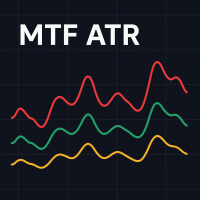
L’indicatore Multi-Timeframe ATR è una versione avanzata dell’indicatore ATR standard per MetaTrader 4 che consente ai trader di visualizzare la volatilità di qualsiasi timeframe scelto direttamente sul grafico corrente. A differenza dell’ATR standard, che mostra dati solo del timeframe attivo, questa versione permette di selezionare un altro timeframe, ad esempio mostrare l’ ATR giornaliero mentre si lavora su un grafico M15 o H1. Come funziona:
L’indicatore ottiene i valori ATR dal timef
FREE
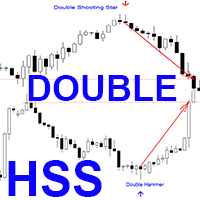
Indicatore Crypto_Forex "Doppio Martello e Stella Cadente" per MT4, senza ridisegnare, senza ritardi.
- L'indicatore "Doppio Martello e Stella Cadente" è un indicatore molto potente per il trading basato sulla Price Action. - L'indicatore rileva il Doppio Martello rialzista e la Doppia Stella Cadente ribassista sul grafico: - Doppio Martello rialzista - Segnale freccia blu sul grafico (vedi immagini). - Doppio Martello ribassista - Segnale freccia rossa sul grafico (vedi immagini). - Dispone d
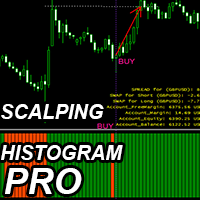
Indicatore Crypto_Forex "Scalping Histogram Pro" per MT4, senza ridisegno.
- L'indicatore Scalping Histogram Pro può essere utilizzato per la ricerca di segnali di ingresso nella direzione principale del momentum dei prezzi dopo una piccola correzione di prezzo. - L'indicatore Scalping Histogram Pro può essere disponibile in 2 colori: arancione per il momentum ribassista e verde per quello rialzista. - Quando si vedono almeno 10 barre consecutive dell'istogramma dello stesso colore, significa
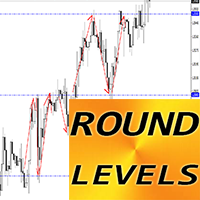
Indicatore Forex "Round Levels" per MT4.
- L'indicatore "Round Levels" è un indicatore ausiliario indispensabile per i trader che prendono in considerazione supporto/resistenza. - I livelli rotondi sono molto rispettati dal prezzo: il prezzo rimbalza molto spesso dai livelli rotondi. - Utilizzare un intervallo di 1000 punti per i timeframe H4 e D1. - Utilizzare un intervallo di 500 punti per i timeframe H1 e inferiori (per il trading intraday). - I livelli rotondi sono inoltre utili per alloca
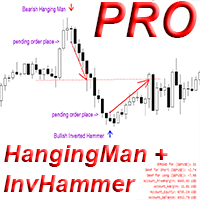
Indicatore Crypto_Forex "Hanging Man and Inverted Hammer Pro" per MT4, senza ridisegnare, senza ritardi.
- L'indicatore "Hanging Man and Inverted Hammer Pro" è un indicatore molto potente per il trading basato sulla Price Action. - L'indicatore rileva pattern Inverted_Hammer rialzisti e Hanging_Man ribassisti sul grafico: - Inverted_Hammer rialzista - segnale freccia blu sul grafico (vedi immagini). - Hanging_Man ribassista - segnale freccia rossa sul grafico (vedi immagini). - Con avvisi su P
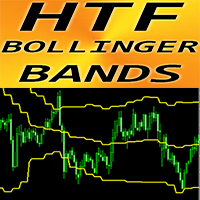
Indicatore Crypto_Forex "HTF Bollinger Bands" per MT4.
- Migliora i tuoi metodi di trading con l'indicatore professionale "HTF Bollinger Bands" per MT4. HTF significa "Higher Time Frame". - Le Bande di Bollinger sono uno dei migliori indicatori sul mercato, uno strumento perfetto per il trading. - Circa il 90% dell'andamento dei prezzi si verifica tra le due bande. - L'indicatore HTF Bollinger Bands è eccellente per i sistemi di trading multi-time frame con ingressi di Price Action o in combin
DESCRIZIONE TECNICA Nexus Signal System è un indicatore MT4 che combina 12 criteri tecnici per generare segnali di trading. Il sistema analizza la congiunzione di più fattori (trend, momentum, volume, zone di supporto/resistenza) prima di confermare un segnale, riducendo il numero di falsi segnali rispetto agli indicatori che utilizzano un solo criterio. CRITERI DI ANALISI (Punteggio 0–15): Rilevamento pattern (pin bar, engulfing) Analisi Multi-Timeframe (conferma del trend su timeframe superior
DESCRIZIONE TECNICA Nexus Signal System è un indicatore MT4 che combina 12 criteri tecnici per generare segnali di trading. Il sistema analizza la congiunzione di più fattori (trend, momentum, volume, zone di supporto/resistenza) prima di confermare un segnale, riducendo il numero di falsi segnali rispetto agli indicatori che utilizzano un solo criterio. CRITERI DI ANALISI (Punteggio 0–15): Rilevamento pattern (pin bar, engulfing) Analisi Multi-Timeframe (conferma del trend su timeframe superior

Indicatore Crypto_Forex "Correction Breakout Pattern" per MT4, senza ridisegnazione, senza ritardo.
- L'indicatore "Correction Breakout Pattern" è un indicatore molto potente per il trading di Price Action. - L'indicatore rileva barre di breakout rialziste e ribassiste dopo la correzione del prezzo: - Pattern di breakout di correzione rialzista - Segnale di freccia blu sul grafico (vedi immagini). - Pattern di breakout di correzione ribassista - Segnale di freccia rossa sul grafico (vedi immag
VolumeRejectionSignals v5.0 Indicatore avanzato di analisi del volume Descrizione generale
VolumeRejectionSignals v5.0 è un indicatore tecnico avanzato progettato per identificare con precisione movimenti significativi dei prezzi attraverso un’analisi approfondita dei rifiuti di volume.
Combinando la dinamica del flusso di ordini e la struttura del mercato, rileva le zone in cui la pressione di acquisto o vendita diminuisce, permettendo di anticipare inversioni o accelerazioni di tendenza. Sist
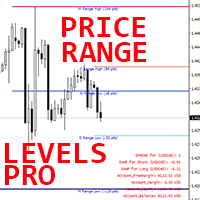
Indicatore Forex "Price Range Levels Pro" per MT4.
- L'indicatore "Price Range Levels Pro" è uno strumento di trading ausiliario professionale molto utile. - Mostra i livelli più probabili giornalieri, settimanali e mensili, raggiungibili dal prezzo (livelli del range di prezzo). - Il range giornaliero è utile per i trader intraday. - I range settimanali e mensili sono utili per i trader swing e a lungo termine. - L'indicatore è eccellente per pianificare i propri obiettivi di Take Profit o pe
HTF Power of Three (ICT) - MT4 Indicator - Version 1.1 Overview The HTF Power of Three indicator is a professional implementation of the Inner Circle Trader's (ICT) Power of Three concept, inspired by Larry Williams. This indicator visualizes higher timeframe (HTF) candle development in real-time on any lower timeframe chart, making it an essential tool for ICT traders who study institutional price movement patterns. What is Power of Three (PO3)? Power of Three represents a three-staged Sma
Hurst Buy and Sell This innovative indicator, inspired by xAI Grok intelligence, uses the Hurst exponent to identify the nature of the market and generate buy/sell signals. The EA for this indicator (Hurst Razer PRO EA MT5) is now available, you can see it by clicking here! https://www.mql5.com/es/market/product/153441?source=Site+Profile+Seller If you want more signals from the indicator, change the minimum number of bars between consecutive signals. The lower the value, the more signals it
FREE

DiverX is a powerful and versatile divergence indicator developed for the MetaTrader 4 platform. It detects both Regular and Hidden Divergences based on five popular technical indicators: RSI (Relative Strength Index) , RVI (Relative Vigor Index) , Stochastic Oscillator, CCI (Commodity Channel Index) , and MACD (Moving Average Convergence Divergence) . The indicator plots results directly on the main chart, providing visual lines, arrows, and labels for easy analysis.
FREE

What is G Force Trend? G Force Trend is a technical analysis indicator developed for the MetaTrader 4 platform. It analyzes price movements to identify trend direction and generates buy/sell signals. The indicator creates a dynamic channel to track price behavior within the channel and visualizes trend changes. What Does It Do? Trend Detection : Determines whether the price is in a bullish or bearish trend. Buy/Sell Signals : Generates clear buy and sell signals when the price crosses the channe
FREE

What is Macro Kill Boxer? Macro Kill Boxer is a technical analysis indicator developed for the MetaTrader platform. It visualizes market movements during specific time intervals (e.g., Asia, London Open/Close, New York AM/PM) by drawing colored boxes on the chart. Each box represents the high and low price levels within the defined time period, often associated with macroeconomic events or high-volatility sessions. What Does It Do? Time-Based Analysis : Displays price movements as boxes for 58 c
FREE
What is the Market Sessions Indicator? The Market Sessions Indicator is a technical analysis tool designed for the MetaTrader 4 platform. It visually represents the trading hours of major financial markets (Asia, Europe, USA, and other key sessions) on the chart. By marking each market session with colored rectangles, it helps traders understand which markets are active and their impact on price movements. What Does It Do? Visualizes Market Sessions : Displays key trading sessions such as Asia,
FREE

You can see resistance and support levels with the Gann Square 9 calculator. You can adjust the sensitivity setting to suit your needs and the symbol. If you leave the sensitivity at 0, it will work with the default values. I recommend adjusting it to suit your needs and the symbol. Good luck.
I plan to improve the Gann Square 9 indicator and create signals in the next version. If you have any requests, please leave them in the comments. Thank you.
FREE
What is TMA NRP 12 Indicator? TMA NRP 12 is a versatile trading indicator designed for advanced technical analysis. It's based on TMA (Triangular Moving Average) bands and enhanced with additional indicators including 100 MA, 5 EMA, and 26 EMA. What Does It Do? TMA Bands : Displays price movements as bands at 1.618 and 2.618 standard deviation levels Multi-Signal System : Detects trading opportunities through 5 different signal groups Trend Analysis : Determines trend direction using 100 MA Conf

Quantum Balance is a modern arrow indicator that identifies key price reversal points in the market with high accuracy. It is based on a combination of WPR (Williams %R) and RSI (Relative Strength Index), which allows you to identify overbought/oversold moments and enter trades at points of maximum potential.
The indicator analyzes price dynamics and market conditions, generating signals only when several confirming factors coincide. This reduces the number of false signals and increases tradin

ATR Progress Advisor
Overview
The indicator shows how far the current price has deviated from the daily open as a percentage of the daily ATR and provides clear textual recommendations for entries and profit-taking. A simple volatility filter to help make intraday and swing-trading decisions.
Key ranges and interpretation
<50% — "Good window for continuation entries"
Risk relative to ATR is low; trend-following entries with a normal position size are preferred.
50–70% — "Cautious entry, o
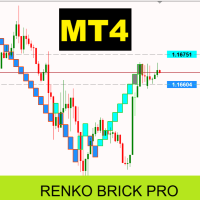
Renko Brick Pro - Advanced Renko Indicator for MT4 Professional Renko bricks with intelligent ATR sizing and ready-to-use EA integration buffers. Renko charts eliminate market noise by creating bricks only when price moves a specific amount. Unlike traditional price charts, each brick represents the same price movement, giving you cleaner trend identification and better entry points. This indicator brings true Renko analysis to MT4 with intelligent ATR-based brick calculations that automatically
Indicator Title: Supply and Demand Zones Short Description: This indicator for MetaTrader 5 automatically identifies and draws supply and demand zones on the price chart, providing key visual information for trading decisions. Based on the analysis of price action and candle structure, the indicator highlights areas where the price is likely to react. Detailed Description: The Supply and Demand Zones indicator analyzes price history to identify specific candlestick patterns that suggest the pr

Pullback Power: Catch the Trend, Maximize Your Profit! Tired of chasing trades and getting caught in market noise? The Pullback Power indicator is your essential tool for finding high-probability entries in a trending market. It's not about guessing; it's about trading with confidence, knowing you have a system designed to confirm genuine trend continuation after a brief pullback . This smart indicator combines the reliability of EMA Crosses for established trend direction with the dynamic conf
FREE
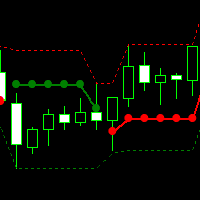
This technical indicator is particularly suitable for short-term traders, as it can quickly reflect the starting point and reversal of the trend. The red beads represent the rise and the green beads represent the fall, which can clearly and timely reflect the current market situation. The source code price can be calculated separately. If you need it, please contact us

Gina Dual TPO — Brief MQL4 indicator TPO + Volume profile overlaid on chart — fast, scalable, and beginner-friendly. Built for traders who read market structure by POC and Value Area. What it is An MQL4 indicator that overlays dual market profiles—Time-at-Price (TPO) and Volume-at-Price (VPO)—directly on your chart. It’s fast (pixel-based drawing), scalable, and beginner-friendly. Who it’s for Intraday and swing traders who read market structure via POC (Point of Control) and Value Area to spot
FREE
Unlock High-Confidence Trading with Flash Signal! Tired of signals that appear too late or repaint? The Flash Signal: EMA-Stoch System indicator is engineered to deliver timely, filtered trade entries, transforming complicated market analysis into clear, actionable buy and sell arrows. Stop guessing and start trading with conviction! Key Advantages: Why You Need Flash Signal Filtered for Quality: This isn't just a simple EMA crossover. We combine the power of three Exponential Moving Averages (
FREE
Unlock Unstoppable Signals : Your Edge in Trading Stop guessing and start trading with confidence! The Unstoppable Signals (BB-AO-MACD System) indicator is your all-in-one tool for catching high-probability moves in the market. We've fused the power of three proven indicators— Bollinger Bands (BB) , Awesome Oscillator (AO) , and MACD —into one simple system that gives you confirmed, non-repainting signals right on your chart. Why You Need This Indicator This isn't just another average tool; it'
FREE
Edge Finder 11 i s your all-in-one visual trading assistant, designed to cut through the market noise and highlight high-probability trading opportunities at a glance. How It Works (The Core Idea): Instead of overloading your chart with complex numbers, Edge Finder 11 uses a unique, color-coded system to paint the market picture clearly. Trend & Momentum Visualization: The indicator analyzes the market and dynamically colors the price bars. Specific colors instantly tell you if the trend is st
Dominate the Market with the Laguerre Edge Signal Indicator! Stop guessing and start trading with confidence! Our Laguerre Edge Indicator is your ultimate tool for spotting high-probability entry points. This indicator combines the power of two classic analysis methods— moving averages for trend direction and the Laguerre RSI for pinpointing reversals —all filtered by the solid EMA 200 trend line . It's designed to give you clear, objective signals directly on your chart. Key Features and Adva
FREE
Classic ZigZag formula. But no lags and repaints. You can see on screenshots that it shows values between peaks and it is useful to test strategies based on indicator. Because sometimes people find a good idea about it but don't understand that repainting indicators have some things to keep in mind. The parameters are the same as original ZigZag indicator: Depth, Deviation and Backstep.
FREE
(Strikingly Simple, Powerfully Profitable) Edge Finder i s your all-in-one visual trading assistant, designed to cut through the market noise and highlight high-probability trading opportunities at a glance. How It Works (The Core Idea): Instead of overloading your chart with complex numbers, Edge Finder uses a unique, color-coded system to paint the market picture clearly. Trend & Momentum Visualization: The indicator analyzes the market and dynamically colors the price bars. Specific colors

The Elsna ATR is a custom MetaTrader 4 indicator that combines two key features into one clean chart overlay: Average True Range (ATR) Display Calculates the current ATR value for the selected period (default = 14). Can show the value in pips or price units . Candle Countdown Timer Displays a live countdown showing how much time remains until the current candle closes. Updates every second, even when the market is quiet. This indicator helps traders quickly gauge market volatility
FREE

Some short but nice algo giving signals and some ideas for stops. Five moving averages are used to find cross overs and create a zone. All periods and methods are adjustable but default values are optimized already. If you have lags on long history you can reduce MaxBars to make it work faster. Please comment if need to explain the parameters. Also any improvement ideas are welcome.
FREE

Its primary motive is to overlay horizontal lines spaced according to multiples of the Average True Range (ATR), centered on a reference price from defined periods such as trading sessions, candlestick counts, or 12-hour intervals. This facilitates the identification of potential support and resistance levels or expected price ranges. Additionally, it marks major forex trading sessions (Sydney, Tokyo, London, and New York) with arrows to provide contextual awareness of market hours, enhancing d
FREE

Designed to mark a specific price and time point on an MT4 chart based on a single mouse click, synchronizing this data across all timeframes for the same symbol. Its primary purpose is to help traders pinpoint and track critical levels or events (e.g., support/resistance or entry points) with persistent visual markers. The indicator uses dashed lines for price and time crosshairs, accompanied by labels that dynamically adjust to stay within chart boundaries, ensuring clarity regardless of win
FREE
MaSonic MT4 日本語バージョン
このインジケーターはチャート上の任意のポイントをクリックすると、そのポイントを通る移動平均 (MA) をすばやく検索、表示できます。
特徴: 簡単な操作: MA を見つけたい任意のポイントをクリックします。 即時結果: 一致する MA が見つかった場合は表示します。 スリープ機能: 使用していないときにボタンを非表示にして、インターフェースをすっきりさせます。 手動制御: 画面上のボタンを使用して MA を手動で調整します。 MA を固定: MA を発見したら、検索とは関係なくその場所に固定できます。 スキャン ボタン: 1 回のクリックでプロセスを開始します。 今すぐ MA 検索のスピードと使いやすさを体験してください。
---------パラメータ設定---------- MA設定: 移動平均線の種類 MA最小値 MA最大値 マニュアルモードのMA初期値 MAが表示されていない場合に適用されます。 MAの色 MAのスタイル MAの太さ 表示したMAを固定表示、それを消去するキー 検索した MA の固定表示を切り替えるキー。
FREE

Analyze volatility by clicking on a specific candlestick, which triggers the display of horizontal grid lines centered around the candlestick’s closing price, spaced by multiples of the calculated ATR. A vertical line highlights the selected candlestick, and an optional text label can display the ATR value in pips above the candlestick. The indicator is lightweight, using no buffers, and relies on chart objects for visualization. It includes error handling for invalid candlestick selections and
FREE
Avex Pro Signal is an advanced multi-timeframe trading indicator engineered for MetaTrader 4, combining EMA Energy analysis with Trend technology to deliver precise entry signals, dynamic stop-loss levels, and optimal take-profit targets. This indicator is designed for both scalping and swing trading across all currency pairs and timeframes. Core Features Feature Details EMA Energy System 15 synchronized EMAs displaying bullish/bearish momentum with real-time visual confirmation SuperTrend Algor

Z-Corr — это инструмент, разработанный для анализа корреляции между двумя валютными парами. Индикатор в реальном времени отображает отклонения в движении инструментов, помогая трейдеру определить моменты, когда валютные пары начинают расходиться, и своевременно открыть позицию для получения прибыли на их последующем схождении. Основные возможности: Отображает два инструмента и сравнивает их движение. Линии и гистограммы показывают текущую динамику отклонения пар. Жёлтая гистограмма сигнализирует
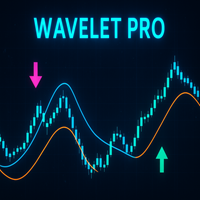
Wavelet Pro is a precision-engineered market analysis indicator designed for traders who demand clarity in complex price movement. It blends wavelet-style trend detection , quantum momentum shifts , and adaptive candle visualization into a unified trading framework. The system’s goal is to provide a refined visual representation of trend strength, phase changes, and market balance without lag or repainting behavior. At its core, Wavelet Pro constructs a dynamic dual-line wave structure that rea
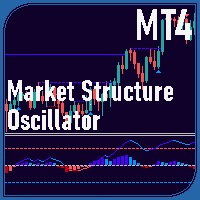
Market Structure Oscillator Overview The Market Structure Oscillator is a technical indicator designed for MetaTrader platforms to analyze market trends across multiple timeframes. It provides a clear visualization of short-term, intermediate-term, and long-term market structures through an oscillator and histogram display in a separate window. The indicator also supports optional chart objects to highlight key market structure points. Features Displays a composite oscillator combining short-ter
Indicator shows balance curves based on magic number for portfolio analysis. It allows to visually estimate different strategies performance on a single symbol. Any of magic number can be hidden by clicking on the value in legend. Parameters: HideAllOnStart - all magics are hidden and can be activated by clicking on its value; MAMode - shows average profit from trades; MAPeriod - Moving average period; Magics - a string with magic numbers separated by comma like "1,2,123". If this field is empty
This indicator represents classic approach to MACD vs price chart divergence with some visual utility and alerts. It can draw lines to define the divergence on both chart or separate window. All is adjustable. The parameters are as follows. MACD: FastEMA, SlowEMA and SignalSMA. Additional: DrawIndicatorLines (to show values on separate window), DrawPriceLines (to show it on chart itself) and DoAlerts (to allow indicator to alert when signal comes).
Harmonic based indicator. Recognizes several patterns: ABCD, 3 Drives, Gartley, Butterfly, Bat, Atlternative Bat, Deep Bat, Crab, Deep Crab, Cypher and Shark. Able to set SL and three levels of TP based on Fibonacci Levels. Three types of alerts are available: PopUp, Email and Push. Trade advices on chart and stats also printed for visual estimation. All patterns are formed by not repainting ZigZiag. Parameters for it are classic: InpDepth, InpDeviation,InpBackstep. MinComplete means the level
Boost your trading accuracy with the Binary KillerX Signal Indicator , specially designed for binary options platforms such as IQ Option, Pocket Option, Quotex , and more. This indicator works seamlessly on all timeframes , giving you clear, reliable signals without any repainting. Key Features: Non-Repainting Signals – Once a signal appears, it will never change, ensuring you trade with confidence. Universal Platform Compatibility – Works on all major binary options platforms, including MT4
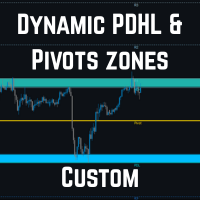
AutoPivot – Indicatore automatico dei punti pivot Indicatore MT4 che mostra i punti pivot (PP, R1/R2/R3, S1/S2/S3) e i livelli del giorno precedente (PDH/PDL). Caratteristiche principali: Adattamento automatico al timeframe del grafico (H4/D1/W1) Zone tra PDH/PDL e il livello di supporto/resistenza più vicino 8 temi di colore preconfigurati Personalizzazione completa di colori, stili di linea e opacità delle zone Etichette compatte con visualizzazione opzionale del prezzo Aggiornamenti automatic
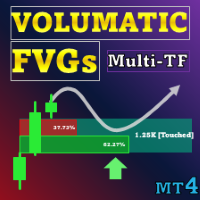
Offerta speciale : ALL TOOLS , solo $35 ciascuno! I nuovi strumenti saranno a $30 per la prima settimana o per i primi 3 acquisti ! Trading Tools Channel on MQL5 : Unisciti al mio canale MQL5 per ricevere le ultime novità Volumatic Fair Value Gaps (FVG) identifica e mantiene zone significative di squilibrio di prezzo e scompone il volume direzionale all’interno di ciascun gap. Il volume è campionato da un timeframe inferiore (M1 predefinito, selezionabile), suddiviso tra acquisti e

Crystal Smart Volume Panoramica Crystal Smart Volume per MT4 è un indicatore avanzato di analisi del volume e del delta, progettato per rivelare l’attività istituzionale nascosta dietro i normali movimenti di prezzo.
Combina i concetti di Smart Money (SMC) , Volume Spread Analysis (VSA) e la logica Delta , analizzando simultaneamente il comportamento di prezzo e volume.
L’indicatore individua eventi come Buying Climax (climax d’acquisto) , Selling Climax (climax di vendita) , Weak Candles (cande
FREE

Media Mobile Adattiva AMD (AAMA)
AAMA è un indicatore di media mobile adattiva per MetaTrader 4 che regola automaticamente la sua reattività in base alle condizioni di mercato. Caratteristiche principali: Media mobile adattiva basata sul Rapporto di Efficienza di Kaufman – reagisce rapidamente durante i trend e filtra il rumore nelle fasi laterali Rilevamento automatico delle 4 fasi di mercato AMD: Accumulazione, Markup (rialzo), Distribuzione, Markdown (ribasso) Adattamento alla volatilità tra
Trend Confluence Indicator
Multi-indicator confluence scoring system for trend analysis
Trend Confluence combines four popular technical indicators (EMA, RSI, MACD, and ADX) into a single numerical score from 0 to 100, helping traders quickly identify market direction and trend strength.
Overview
This indicator assesses market conditions by analyzing the agreement between four technical components. When the indicators align in the same direction, the confluence score strengthens, providing
Multi-Timeframe Trend Sync Sync Multiple Timeframes and Trade with Trend Confluence MTTS Sync is an advanced technical indicator designed for traders seeking precision in multi-timeframe analysis. By consolidating information from multiple timeframes simultaneously, the indicator identifies points of high confluence where multiple timeframes confirm the same market direction.
MAIN FEATURES Simultaneous Multi-Timeframe Analysis
Monitor up to 16 different timeframes simultaneously Fully customi

HiLoTren IQ7 — Confini di mercato intelligenti e mappatura dei pivot Definisci i tuoi livelli di trading con la precisione dell'IA.
HiLoTren IQ7 è un indicatore intelligente basato su pivot che traccia automaticamente i punti pivot , le zone di resistenza (R1–R3) e di supporto (S1–S3) direttamente sul grafico.
Fornisce un quadro visivo chiaro per identificare i confini del mercato, le zone di inversione e i livelli di continuazione del trend , il tutto calcolato in tempo re
FREE

Ti presento Wikirobo — l’indicatore intelligente delle zone di ingresso per tutti i timeframe.
Wikirobo mostra automaticamente i potenziali punti di ingresso sotto forma di Buy Limit e Sell Limit in tutti i timeframe.
Puoi aspettare che il prezzo raggiunga la zona suggerita, osservare come reagisce o si inverte da quel punto, e poi entrare nel trade basandoti sulla tua strategia.
Ogni timeframe mostra il proprio Stop Loss , aiutandoti a gestire meglio il rischio e la dimensione della posizione.
FREE
Questo è un prodotto gratuito che puoi utilizzare per le tue esigenze!
Apprezzo molto anche i tuoi feedback positivi a 5 stelle! Grazie mille!
// Ottimi robot e indicatori di trading sono disponibili qui: https://www.mql5.com/en/users/def1380/seller
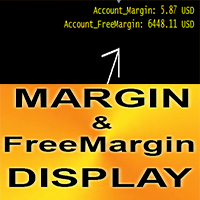
Indicatore Crypto_Forex "Margin Display" per MT4, un ottimo strumento di trading ausiliario.
- Questo indicatore mostra il margine corrente e il margine libero del conto. - È possibile visualizzare i valori in qualsiasi angolo del grafico: 0 - p
FREE

Green Days was created to eliminate confusion around the concept of "smart money" by turning structural shifts like BOS (Breakout of Structure) and CHoCH (Change of Character) into simple buy and sell trading signals. It simplifies structure-based trading by automatically recognizing breakouts and reversals as they occur, allowing traders to focus on execution rather than analysis. Whether the market is continuing a trend or preparing for a reversal, the indicator transforms complex price dyn
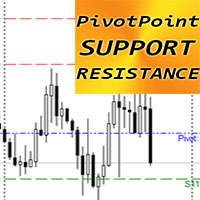
Indicatore Crypto_Forex "PIVOT POINT Supporto Resistenza" per MT4.
- L'indicatore "Pivot Point Supporto Resistenza" è un indicatore ausiliario molto potente per il trading basato sulla Price Action. - I livelli Pivot sono calcolati come media dei prezzi significativi in base all'andamento di un mercato nel periodo di trading precedente. - I livelli Pivot rappresentano i livelli di massima resistenza o supporto, a seconda delle condizioni generali del mercato. - L'indicatore "Pivot Point Supp
Il MetaTrader Market è un negozio online unico di robot di trading e indicatori tecnici.
Leggi il promemoria utente di MQL5.community per saperne di più sui servizi unici che offriamo ai trader: copia dei segnali di trading, applicazioni personalizzate sviluppate da freelance, pagamenti automatici tramite il Sistema di Pagamento e il MQL5 Cloud Network.
Ti stai perdendo delle opportunità di trading:
- App di trading gratuite
- Oltre 8.000 segnali per il copy trading
- Notizie economiche per esplorare i mercati finanziari
Registrazione
Accedi
Se non hai un account, registrati
Consenti l'uso dei cookie per accedere al sito MQL5.com.
Abilita le impostazioni necessarie nel browser, altrimenti non sarà possibile accedere.