MetaTrader 4용 새 기술 지표 - 10

TrendScan is a visual scanner that detects bullish, bearish, or neutral trends across multiple symbols and timeframes. It analyzes market structure, EMA alignment, and price range to display clean, reliable signals. Ideal for traders seeking clarity and speed in their analysis.
Compatible with up to 25 symbols. Support for 8 timeframes. Advanced trend filters. Compact and customizable visual interface.

Target Level MT4 — a smart target-price indicator with an adaptive model based on five algorithms. Target Level MT4 — not just a price forecast: it analyzes the market in real time through five independent algorithms, selects the best one, and builds a reliable target price with visual signals on the chart. Indicator demo video: https://youtu.be/4P1GM-1PTd8?si=SeQVsoByiump6kGP Updates The statistics now include the influence of SL: formulas are evaluated not only by reaching the Target, but also
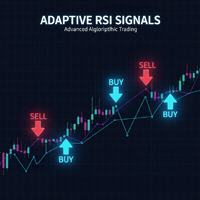
Powered by SVX Strategies Quant Team This is the full implementation of our "Self-Adaptive Trading Rules." It combines Market Structure (Dynamic Support & Resistance) with Adaptive RSI intelligence to generate high-probability buy and sell signals. Want this strategy fully automated?
Manual execution requires constant screen time. If you prefer to have our team manage the execution for you, copy our official algorithms: Copy "Friday Pulse" (Conservative/Stable) Copy "SVX AI Systems" (High Growt
FREE
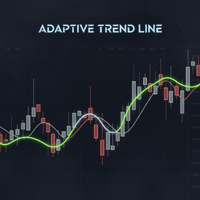
Powered by SVX Strategies Quant Team This indicator is a Smart Trend Regime Filter that changes its state based on internal market strength. Automated Trading Options:
Stop guessing the trend. Use our official algorithms for automated execution: Copy "Friday Pulse" (Conservative) Copy "SVX AI Systems" (High Growth) HOW IT WORKS
It fuses the smoothness of an EMA with the sensitivity of the RSI to filter out noise. Color Logic: Green Line: Bullish (RSI > 55). Buyers are in control. Red Line: Bea
FREE
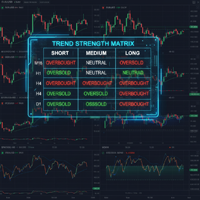
Powered by SVX Strategies Quant Team Tired of switching between charts? Trend Strength Matrix gives you an eagle-eye view of the market. This professional dashboard monitors the Adaptive RSI state across 4 key timeframes (M15, H1, H4, D1) simultaneously. Stop Monitoring, Start Automating
Watching a dashboard all day is exhausting. If you want the execution to be handled automatically by our systems, copy our official algorithms: Copy "Friday Pulse" (Conservative/Stable) Copy "SVX AI Systems" (H
FREE
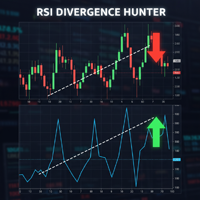
Powered by SVX Strategies Quant Team Divergences are among the most powerful signals in technical analysis, but spotting them in real-time is difficult and subjective. RSI Divergence Hunter automatically scans the market for these discrepancies between price and momentum. Eliminate Subjectivity, Automate Profit
Drawing lines manually leads to errors. If you prefer a fully automated, mathematical approach to trading, copy our official institutional algorithms: Copy "Friday Pulse" (Conservative/S
FREE
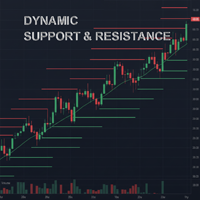
Powered by SVX Strategies Quant Team This indicator automates the identification of critical price levels based on higher timeframe market structure. It projects significant highs and lows directly onto your chart. Looking for Fully Automated Trading?
While this tool helps with manual analysis, our institutional algorithms handle execution automatically. Copy our official signals here: Copy "Friday Pulse" (Conservative/Stable) Copy "SVX AI Systems" (High Growth) HOW IT WORKS
Forget drawing lin
FREE

Powered by SVX Strategies Quant Team This indicator is part of our internal toolkit for institutional volatility analysis. We are releasing it for free to support the retail trading community. Looking for Automated Results?
Manual execution is prone to human error. If you prefer consistent results managed by our team, you can copy our official algorithms directly on MQL5: Copy "Friday Pulse" (Conservative/Stable) Copy "SVX AI Systems" (High Growth) ABOUT ADAPTIVE RSI BANDS
Unlike traditional R
FREE

OB Scanner Indicator — Overview OB Scanner is an enhanced Support & Resistance + Supply & Demand indicator designed to help traders identify where institutions and smart money are placing orders. It scans the chart for: 1. Order Blocks (Improved Demand & Supply Zones) Automatically detects Bullish Order Blocks (Demand) Automatically detects Bearish Order Blocks (Supply) Marks high-probability reversal zones Filters out weak OBs with volume and break-of-structure (BOS) confirmation 2. Buyer
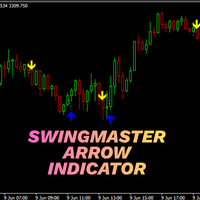
SwingMaster Arrow Indicator – Don’t Let the Big Move Leave You Behind Do you close your charts… and then watch price explode exactly where you were looking?
SwingMaster Arrow Indicator is built to solve that frustration – it pinpoints clean swing entries and exits so you can focus on the real move and ignore the market noise. This is not a random arrow generator.
SwingMaster uses a smart, SuperTrend-style swing engine that tracks price structure and volatility, then marks high-probability turnin

MULTI INDICATOR SCANNER - PROFESSIONAL EDITION
PRODUCT DESCRIPTION
Multi Indicator Scanner is the most comprehensive technical analysis scanner on the market. It analyzes 10 different indicators simultaneously and provides you with clear BUY-SELL-NEUTRAL signals. No more checking dozens of indicators one by one!
Multi Pivot Indicator - Professional Trading Tool MULTI
PIVOT PRO INDICATOR Professional Multi Pivot Indicator for MT4 5-in-1 Pivot Indicator Professional Trading Tool for MetaTrader 4 ENGLISH TÜRKÇE Multi Pivot Indicator PRO Classic Fibonacci Camarilla Woodie DM What is Multi Pivot Indicator? Multi Pivot Indicator is a professional trading tool that displays 5 different pivot calculation methods on your MetaTrader 4 charts. Pivot points are critical support and resistance

The Sessions Partition Indicator draws clear, accurate session separators for the Sydney, Tokyo, London, and New York trading sessions.
It automatically adapts to your broker’s server time and allows full GMT customization. Designed especially for IC Markets (Winter – GMT+2) , this indicator gives traders a clean visual structure of the market’s intraday phases – making session-based strategies MUCH easier to follow. Key Features 4 Major Forex Sessions Marked Sydney Session Tokyo Session Lon
FREE
IMPORTANT NOTE : This is a dashboard indicator and will not work on strategy tester.
Multi-Symbol Trend Scanner - Professional Market Analysis Tool Overview The Multi-Symbol Trend Scanner is a sophisticated trading dashboard that provides real-time market analysis across multiple financial instruments simultaneously. Designed for both novice and professional traders, this powerful indicator displays crucial market data in an intuitive, table-aligned format that's easy to interpret at a glan

TR-LMP Pro — Smart Auto-Mapped Liquidity Zones
TR-LMP Pro is an institutional-grade liquidity mapping indicator that automatically detects high-value liquidity levels above and below price, highlights buy-side and sell-side liquidity zones, and visualizes liquidity intensity using a clean, professional, non-retail display. Instead of manually guessing key levels, TR-LMP Pro reveals where price is most likely to target, sweep, reverse, or continue — giving traders a smarter and more objective w
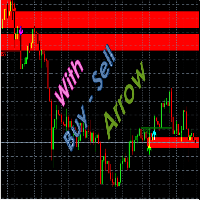
Indicator Guide: Key Price Levels & Structure Shifts 1. Description The indicator is a technical analysis tool for the Meta Trader 4 platform. It is designed to automatically identify specific price movements and to highlight corresponding price zones based on preceding price action. This provides a visualization of key price areas according to the indicator's internal logic. 2. Visual Elements & Their Identification The indicator identifies and draws several types of visual elements on the char
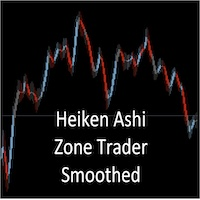
Smoothed Heiken Ashi with AC/AO Zones – Professional Trading Clarity Transform your Heiken Ashi analysis with intelligent smoothing that eliminates noise while preserving actionable signals. What Makes This Different? This isn't just another Heiken Ashi indicator. We've engineered a sophisticated smoothing engine that works with the Accelerator (AC) and Awesome Oscillator (AO) zone logic to give you cleaner entries and exits without sacrificing responsiveness. Four Smoothing Methods at Your Comm

**Product Name:** Gold Seasonality Pro (Auto Fibonacci) **Headline:** Automate the "Smart Money" Seasonal Strategy for Gold (XAUUSD). **Overview** Stop guessing where Gold will reverse. History shows that **March** and **October** are the two most powerful months for institutional trend changes. **Gold Seasonality Pro** automatically scans for these key months, analyzes the buying or selling pressure, and draws the exact Fibonacci "Sweet Spot" levels for you. It turns 45 years of statistical dat

핍스 스토커는 롱 숏 화살표 유형의 지표로, 모든 수준의 트레이더들이 더 나은 시장 결정을 내릴 수 있도록 돕습니다. 이 지표는 절대 재도색되지 않고 RSI를 주요 신호 로직으로 사용합니다. 화살표가 주어지면 절대 다시 도색되거나 다시 도색되지 않고, 화살표 지연도 없습니다.
PIPS STALKER ARROW의 특징 :
통계 패널 전체 승률 %와 연속 최대 승리 및 패배 거래 등 유용한 통계, 그리고 기타 유용한 정보를 보여주는 독특한 정보 대시보드입니다. TP와 SL, 내장된 자금 관리 이 지표는 각 화살표마다 TP와 SL 객체를 제공하므로, 거래자는 자금 및 위험 관리를 내장하고 있으며, SL은 ATR을 기반으로 하며, TP는 현재 ATR SL 가치를 기반으로 한 위험 대비 보상 비율을 기반으로 합니다. 재도색 없음, 높은 조정 가능성 이 인디케이터는 신호 품질 개선을 위한 다양한 옵션을 제공하여 어떤 쌍에서도 약간의 기간 조정만으로 작동하며, 패널은 현재 설정과 기간이 수
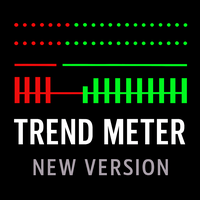
MetaTrader 4용 다중 통화 추세 분석 지표로, 여러 시간 프레임에서 추세 방향과 추세 강도를 시각화합니다. 분석 목적 전용입니다. TREND METER – 다중 통화 추세 분석 지표 (MT4) Trend Meter는 여러 시간 프레임과 심볼에서 추세 방향, 추세 강도 및 추세 정렬 상태를 시각화하도록 설계된 기술적 추세 분석 지표입니다. 본 지표는 시각적 분석 전용이며 자동으로 거래를 실행하지 않습니다. 개념 시장 추세는 시간 프레임과 거래 상품에 따라 달라질 수 있습니다.
Trend Meter는 여러 내부 추세 계산을 통합하여 간결한 시각적 형식으로 표시함으로써 시장 상황을 빠르게 평가할 수 있도록 돕습니다. 본 지표는 다음에 중점을 둡니다: 추세의 존재 여부 추세 방향 상대적인 추세 강도 여러 추세 모듈 간의 일치 여부 지표 구조 Trend Meter는 세 개의 독립적인 추세 모듈로 구성됩니다: Trend Meter 1 조기 반응형 추세 로직 단기 변화에 대한 높은

Range Explosion 소개 Range Explosion은 시장 범위를 감지하고, 정확한 지지선과 저항선을 그리며, 돌파 기회를 정확하게 식별하는 강력하고 무료인 트레이딩 도구입니다.
Break Out Explosion 프로젝트의 일부로서, 초보자와 전문가 모두에게 신뢰할 수 있는 고급 시각적 솔루션을 제공합니다. 이 제품의 MT5 버전은 여기에서 확인할 수 있습니다:
https://www.mql5.com/en/market/product/153004
추세선 돌파 개념에 관심이 있다면, 주요 추세 방향의 돌파를 감지하는 고급 도구를 확인해 보세요:
https://www.mql5.com/en/market/product/155132 이 지표의 화살표를 기반으로 거래하는 EA를 원하시나요? 아래 링크를 통해 $30 에 직접 작업을 생성하시면 제가 만들어드리겠습니다:
https://www.mql5.com/en/job/new?prefered=eeecad Break Out Explosio
FREE

Trendline Alert Pro is a MetaTrader 4 indicator that monitors the objects that you created such as trendlines, horizontal lines, rectangles, Fibonacci levels, and instantly alerts you when price interacts with them.
MT5 version is here PM me to receive a 7-day trial version of the product.
Multi-Object Monitoring Trendlines, channels, and angled lines Horizontal & vertical lines Rectangles (support/resistance zones) Fibonacci retracements & expansions (customizable levels) Flexible Alert Opt

상상:당신은 거대한 이익의 가장자리에 있지만,시장이 갑자기 변경 당신은 기회를 그리워. 또는 더 나쁜,당신은 손실 대신 이익을 얻을. 당신은 사전에 속삭이는 신뢰할 수있는 동맹이 있다면 어떻게:"준비-파도가오고있다!"? Harbinger 을 알아보세요–메타 트레이더 4 에 대한 혁신적인 지표,특별히 혼란의 피곤과 시장의 변화를 예상 할 상인을 위해 설계!
Harbinger 은 숨겨진 추세 변동성 패턴을 분석하여 다가오는 철수,반전 또는 축적을 놀라운 정확도로 알리는 스마트 알고리즘입니다. Harbinger mt5 version
표시기 작업 방법 Harbinger.
Harbinger 의 신호가 차트에 나타나면 신호 이전의 가격 움직임이 함께 풀백 또는 추세 반전과 함께 축적 또는 롤백 또는 축적을 위해 중지된다는 것을 의미합니다. 종종 두 가지 모두 한 번에 발생합니다. 중요한 것은 신호가 나타나면 이전 추세의 변화가 오는 것을 의미한다는 것을 이해하는 것입니다. 이 모든 것이

Dynamic FVG Detector – MetaTrader 4용 공정가치갭(FVG) 지표 Dynamic FVG Detector는 차트에서 공정가치갭(FVG)을 자동으로 감지하고 표시합니다. 세 개의 캔들 구조로 나타나는 비효율 구간을 식별하며, 가격의 되메움 상황에 따라 영역을 실시간으로 업데이트합니다. 주요 기능 상승 및 하락 FVG 자동 감지 설정 가능한 핍 기준값 최소 3캔들 구조 기반 영역 생성 시 즉시 과거 데이터 검증 되메움 동적 추적 가격 반응에 따라 영역을 지속적으로 조정 되메움 비율에 따라 영역 크기 자동 축소 완전히 메워지면 자동 제거 실시간 업데이트 두 가지 모드 제공: 표준 모드: 새로운 캔들이 형성될 때 업데이트 실시간 모드: 모든 틱에서 감지 및 업데이트, 최근 10캔들 기준 최적화 시각적 표시 녹색(상승), 빨간색(하락), 회색(완전 메움) 영역 현재 시간까지 자동 연장 투명도 및 메워진 영역 표시 옵션 지원 성능 최적화 과거 스캔 범위 설정 가능 추적
Correlation Monitor 는 종목 간 관계를 빠르게 탐지하는 지표입니다 . 강한 양 / 음의 상관관계를 가진 페어를 찾고 , 다이버전스를 식별하며 , 헤지 · 페어 · 바스켓 트레이딩에서 보다 근거 있는 의사결정을 내리도록 돕습니다 . Meta traider 5.
주요 기능 • 상관관계 매트릭스와 컴팩트 리스트 : 선택한 심볼 간 관계의 강도를 즉시 보여 주며 , 색상 구분으로 가독성을 높입니다 . • 상관 심볼의 미니 차트 : 메인 차트의 가시 범위와 동기화되어 움직임을 직관적으로 비교할 수 있습니다 . • Top‑5 모드 : 가장 강한 양의 / 음의 관계를 강조 표시하여 빠르게 집중할 수 있습니다 . • 멀티 타임프레임 : 서로 다른 기간에서 평가하며 계산 창 ( 바 수 ) 을 설정할 수 있습니다 . • ‘ 시장 감시 (Market Watch)’ 의 모든 심볼을 지원하며 , 비표준 심볼도 가능합니다 . • 리소스 최적
FREE

제품 제목 Smart Moving Averages (MT4) – SmartView 시리즈의 일부 간단한 설명 MetaTrader 플랫폼에서 독특한 사용자 경험을 제공하는 Moving Averages 지표입니다. 이전에 사용할 수 없었던 고급 기능을 제공하며, 더블 클릭으로 설정 열기, 삭제하지 않고 지표 숨기기/표시하기, 지표 창을 전체 차트 크기로 표시하기 등의 기능을 포함합니다. SmartView Indicators 시리즈의 나머지 부분과 원활하게 작동하도록 설계되었습니다. 개요 SmartView 시리즈는 혁신적인 기능을 통해 MetaTrader 플랫폼의 지표에 독특하고 독특한 사용자 경험을 제공하여 지표 관리를 더 빠르고 쉽게 만듭니다. 각 지표는 차트에 스마트 제어 패널이 장착되어 있어 필수 정보를 표시하고 모든 중요한 기능에 빠르게 액세스할 수 있습니다. 이전에 사용할 수 없었던 고유한 기능 SmartView 시리즈는 지표 작업을 더 쉽고 빠르게 만드는 고급 기능을 제공합니
FREE
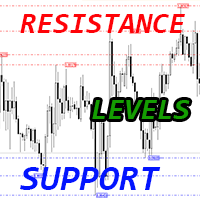
MT4용 Crypto_Forex 지표 "지지 저항선"
- "지지 저항선" 지표는 거래에 매우 유용한 보조 지표입니다. - "지지선"과 "저항선"은 차트에서 가격이 중요하게 고려하는 중요한 영역입니다. - 지지선은 가격이 정기적으로 하락을 멈추고 반등하는 지점입니다. - 저항선은 가격이 일반적으로 상승을 멈추고 다시 하락하는 지점입니다. - "지지 저항선" 지표는 최근 수준을 보여줍니다. - 저항선 - 빨간색 선. 지지선 - 파란색 선. - 계산에 사용되는 막대의 개수, 선 유형 및 색상은 설정에서 조정할 수 있습니다. - "지지 저항선" 지표는 가격 움직임 패턴을 통해 이익실현 목표, 가격 반전 및 재테스트를 계획하는 데 유용합니다.
// 훌륭한 트레이딩 로봇과 지표는 다음 링크에서 확인할 수 있습니다. https://www.mql5.com/en/users/def1380/seller MQL5 웹사이트에서만 제공되는 오리지널 제품입니다.
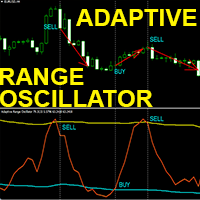
고급 맞춤형 Crypto_Forex 지표 "적응형 범위 오실레이터" - MT4를 위한 효율적인 트레이딩 도구!
- 이 지표는 차세대 오실레이터입니다. 사용 방법은 그림을 참조하세요. - "적응형 범위 오실레이터"는 조정 가능한 적응형 과매도/과매수 영역 및 기타 유용한 설정을 제공합니다. - 이 오실레이터는 동적인 과매도/과매수 영역에서 청산 시점을 정확하게 파악하는 데 적합한 도구입니다. - 과매도 영역: 파란색 선 아래 - 과매수 영역: 노란색 선 위 - 이 지표는 빠른 스캘핑 및 추세 전략에서 가격 조정의 끝을 감지하는 데 유용합니다. - 일반 오실레이터보다 훨씬 정확합니다. - 모든 시간대에서 사용할 수 있습니다. - PC 및 모바일 알림 기능이 내장되어 있습니다.
// 훌륭한 트레이딩 로봇과 지표는 여기에서 확인하실 수 있습니다: https://www.mql5.com/en/users/def1380/seller MQL5 웹사이트에서만 제공되는 정품 제품입니다.

Price Predictor 는 MetaTrader 4용으로 개발된 MQL4 기반의 고급 지표로, 가격 움직임을 보다 깊고 스마트하게 분석할 수 있도록 설계되었습니다. 트렌드 반전 가능성을 미리 포착하고 강한 추세를 높은 정확도로 따라가는 것을 목표로 합니다. 기존 지표와 달리, Price Predictor 는 시장의 변동성과 리듬에 따라 내부 매개변수를 자동으로 조정하는 적응형 로직을 사용합니다. 이를 통해 변동성 구간이나 횡보장에서도 일관된 민감도를 유지하며 노이즈와 허위 신호를 줄입니다. 또한 가격이 소진될 가능성이 높은 구간을 식별하는 능력이 뛰어나, 통계적으로 반전 가능성이 높은 지점을 포착할 수 있습니다. 모멘텀 분석, 반복 패턴, 동적 변동성 추정을 결합한 다층 필터링 알고리즘이 안정적인 신호를 제공합니다. 트레이더는 자신의 스타일에 맞게 파라미터를 자유롭게 조정할 수 있으며, 모든 변경 사항은 차트에 즉시 반영됩니다. 단순하고 직관적인 인터페이스로 주요 구간을 명확히
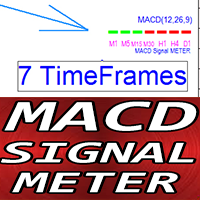
MT4용 Crypto_Forex 지표 MACD 시그널 미터.
- 매우 유용한 MACD 시그널 미터 지표는 7개 시간대의 현재 MACD 값(시그널 라인 위/아래)을 동시에 보여줍니다. - 녹색 사각형 - MACD가 시그널 라인 위에 있습니다. - 빨간색 사각형 - MACD가 시그널 라인 아래에 있습니다. - 외환 지표 MACD 시그널 미터는 다중 시간대 거래 시스템의 거래 진입 필터로 사용할 수 있습니다. ..................................................................................................................................................... // 훌륭한 트레이딩 로봇과 지표는 다음 링크에서 확인하실 수 있습니다: https://www.mql5.com/en/users/def1380/seller 이 제품은 MQL5 웹사이트에서만 제공되는 정품 제품입니다
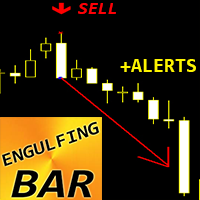
Crypto_Forex 지표 ENGULFING 막대 패턴(MT4용), 재도색 및 지연 없음.
- "ENGULFING 막대" 지표는 가격 움직임 거래에 매우 강력한 지표입니다. - 이 지표는 차트에서 Engulfing 막대 패턴을 감지합니다. - 상승 Engulfing 막대 - 차트에 파란색 화살표 신호(그림 참조). - 하락 Engulfing 막대 - 차트에 빨간색 화살표 신호(그림 참조). - PC, 모바일 및 이메일 알림 기능 제공. - "ENGULFING 막대 패턴" 지표는 지지/저항 레벨과 결합하기 매우 좋습니다.
// 훌륭한 트레이딩 로봇과 지표는 다음 링크에서 확인하실 수 있습니다: https://www.mql5.com/en/users/def1380/seller MQL5 웹사이트에서만 제공되는 오리지널 상품입니다.
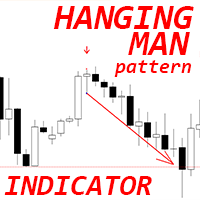
MT4용 Crypto_Forex 지표 "행잉 맨 패턴", 리페인트 없음, 지연 없음.
- "행잉 맨 패턴" 지표는 가격 변동 거래에 매우 강력한 지표입니다. - 이 지표는 차트에서 하락세 행잉 맨 패턴을 감지합니다. 차트에 빨간색 화살표 신호가 나타납니다(그림 참조). - PC, 모바일 및 이메일 알림 기능을 제공합니다. - "행잉 맨 패턴" 지표는 지지/저항선과 함께 사용하기에 매우 좋습니다. ..................................................................................................................................................... // 훌륭한 트레이딩 로봇과 지표는 다음 링크에서 확인하실 수 있습니다: https://www.mql5.com/en/users/def1380/seller 본 제품은 MQL5 웹사이트에서만 제공되는 오리지널 상품입니다.

MFCS (다중 요인 채널 점수) 는 가중 점수 시스템과 변동성 기반 적응형 채널을 통해 시장의 역학을 명확하게 파악하도록 설계된 고급 지표입니다. 주요 특징: 실시간 변동성에 따라 조정되는 적응형 ATR 채널 다중 요인 점수(포지션, 거래량, 모멘텀, 상위 시간 프레임 추세, 변동성) 점수 강도(0–100)에 따라 분류된 신호 점수, 추세, 주요 지표를 보여주는 종합 대시보드 시장 방향 정렬을 위한 다중 시간대 필터링 신뢰성을 높이기 위한 선택적 거래량 검증 주요 매개변수: 조정 가능한 ATR 기간, 배수, 윈도우 구성 가능한 점수 가중치 이동 평균을 통한 거래량 필터링 통합 알림이 포함된 사용자 지정 대시보드 사용 방법:
시장 구조를 정량적으로 평가하려는 트레이더와 기술 분석가를 위해 설계되었습니다.
높은 잠재력 구역 식별, 움직임 강도 측정 및 진입 타이밍 최적화에 도움을 줍니다.
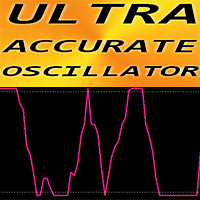
MT4용 초정밀 오실레이터
UA 오실레이터 - EMA와 같은 추세 지표와 함께 사용할 경우 약 80%의 정확도를 제공하는 고급 맞춤형 Crypto_Forex 지표입니다.
- 새로운 고급 계산 방식을 사용합니다. UA 오실레이터는 표준 MT4 오실레이터보다 훨씬 빠르고 정확합니다. - 차세대 오실레이터 - EMA10과 함께 사용하는 방법을 보여주는 그림을 참조하세요. - 과매도: 0.03 미만 // 과매수: 0.97 이상 - 이 지표를 사용하면 표준 전략도 업그레이드할 수 있는 기회가 많습니다. - 지표 설정은 매우 간단합니다. 주요 매개변수: 민감도 - 권장 값 범위: 0.4~0.8 - 모바일 및 PC 알림 기능 내장
// 훌륭한 트레이딩 로봇과 지표는 여기에서 확인하실 수 있습니다: https://www.mql5.com/en/users/def1380/seller 본 제품은 MQL5 웹사이트에서만 제공되는 정품입니다.
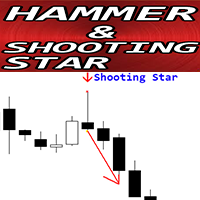
MT4용 Crypto_Forex 지표 "망치형 및 유성 패턴", 리페인트 및 지연 없음.
- "망치형 및 유성 패턴" 지표는 가격 변동 거래에 매우 강력한 지표입니다. - 이 지표는 차트에서 강세 망치형 및 약세 유성 패턴을 감지합니다. - 강세 망치형 - 차트에 파란색 화살표 신호(그림 참조). - 약세 유성형 - 차트에 빨간색 화살표 신호(그림 참조). - PC, 모바일 및 이메일 알림 기능 제공. - "망치형 및 유성 패턴" 지표는 지지/저항선과 결합하기 매우 좋습니다.
// 훌륭한 트레이딩 로봇과 지표는 다음 링크에서 확인하실 수 있습니다. https://www.mql5.com/en/users/def1380/seller 이 제품은 MQL5 웹사이트에서만 제공되는 오리지널 상품입니다.
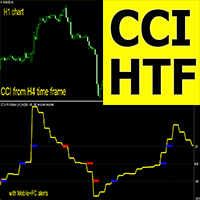
MT4용 Crypto_Forex 지표 CCI HTF 오실레이터
- MT4용 전문가용 CCI HTF 오실레이터로 거래 방식을 업그레이드하세요. HTF는 상위 시간대를 의미합니다. - 상품 채널 지수(CCI)는 현재 가격과 과거 평균 가격의 차이를 측정합니다. - 주요 레벨: +/-200, +/-100. - +200 구간 이상에서는 매도 진입, -200 구간 이하에서는 매수 진입에 유리합니다. - 이 지표는 가격 변동 구간을 이용하는 다중 시간대 거래 시스템이나 다른 지표와 함께 사용하는 데 매우 유용합니다. - CCI HTF 오실레이터 지표를 사용하면 상위 시간대의 CCI를 현재 차트에 추가할 수 있습니다. - 모바일 및 PC 알림 기능이 내장되어 있습니다.
// 훌륭한 트레이딩 로봇과 지표는 여기에서 확인하실 수 있습니다: https://www.mql5.com/en/users/def1380/seller 본 제품은 MQL5 웹사이트에서만 제공되는 정품입니다.

이런 경험, 없으신가요? 화살표 신호가 떠서 진입했는데, 곧바로 반대 방향으로 가서 손절... '곧 오를 것 같다'는 근거 없는 감으로 진입했다가 손실을 떠안게 되는 경우 (포지션 중독) 추세가 나온 것은 알겠는데, 어디서 들어가야 할지 몰라 절호의 기회를 손가락만 빨며 지켜보기만 할 때... 고점 매수, 저점 매도를 반복하며 자금이 조금씩 줄어들 때... 만약, 당신이 하나라도 해당된다면, 그것은 당신의 탓이 아닙니다.
시장의 **'진짜 힘'과 순식간에 사라지는 '노이즈(속임수)'**를 구별하는 '잣대'가 없었을 뿐입니다. 만약, 차트 위에 **'시장 에너지 그 자체'**를 수치화하여, 추세의 시작부터 최고점까지 누구나 명확하게 볼 수 있는 나침반이 있다면...? 당신의 트레이딩이 극적으로 바뀔 것이라고 생각하지 않으십니까? 그 해답이, 바로 여기에 있습니다. **【Hirozo Momentum Analysis】**는 기존의 시그널 툴과는 차별화된, 완전히 새로운 발상에서 태어난
윌리엄스 프랙탈 후행 정지 적응 후행 정지 메커니즘 빌 윌리엄스 프랙탈 분석의 원리를 결합한 전문 거래 도구입니다. 이 표시기는 거래 진입 및 시장 위험 최소화를위한 순간의 정확한 정의를 제공합니다.
이 시스템은 차트에서 프랙탈 구조를 자동으로 식별하고 정지 순서를 이동하기위한 최적의 레벨을 계산합니다. 이를 통해 이익을 보호하고 손실을 제한 할 수 있습니다.
이 표시기는 시장 역학을 지속적으로 분석하고 가격 구조의 변화에 따라 정지 손실 수준을 조정합니다. 당신은 전문적인 위험 관리 도구를 얻을 실시간으로 무역에 입력합니다.
프랙탈의 복잡한 수학적 계산은 이해할 수있는 그래픽 신호로 변형되었습니다. 이 이론에 대한 심층적 인 연구는 필요하지 않습니다.이 시스템은 자본 보호 및 거래 진입을위한 기성품 솔루션을 제공합니다.
이 표시기는 주요 프랙탈 레벨을 식별하고 동적 정지 순서를 설정하는 벤치마크로 사용합니다. 새로운 극단에 도달하면 시스템이 자동으로 정지 레벨을
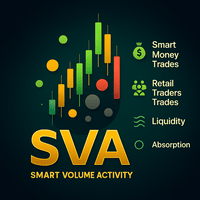
Smart Volume Activity [SVA] is an advanced analytical indicator designed for MetaTrader platforms. It reveals how institutional (Smart Money) and retail traders operate by analyzing volume behavior across multiple timeframes . Unlike ordinary volume tools, SVA automatically adapts to any chart timeframe and highlights zones of absorption — moments when large market participants absorb liquidity from weaker hands. By detecting abnormal volume spikes far beyond typical mark
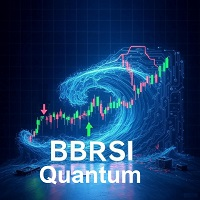
BBRSI Quantum (Free Edition) BBRSI Quantum is a powerful, 100% Non-Repainting indicator for MetaTrader 4 that generates clear Buy and Sell arrows based on an advanced momentum strategy. This tool is designed for traders who want to identify precise entry points during overbought or oversold conditions. This is the fully functional FREE edition. The Core Strategy: Bollinger Bands on RSI Unlike standard indicators, BBRSI Quantum does not apply Bollinger Bands to the price. Instead, it applies th
FREE

SmartReversals Auto Optimized: The Intelligent Indicator That Adapts to Your Chart Tired of indicators with fixed settings that only work in one market? Frustrated by endless manual optimization with no results? Introducing SmartReversals Auto Optimized – the first indicator that automatically optimizes itself for your chart. The real magic is its built-in Auto-Optimization Engine . Revolutionary Feature: Smart Auto-Optimization No more manual backtesting or guessing parameters! Whe
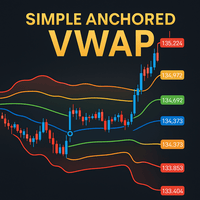
Simple Anchored VWAP is a lightweight yet powerful tool designed for traders who want precise volume-weighted levels without complexity.
This indicator lets you anchor VWAP from any point on the chart and instantly see how price reacts around institutional volume zones. MT5 Version - https://www.mql5.com/en/market/product/155321/
Join To Learn Market Depth - https://www.mql5.com/en/channels/suvashishfx Using VWAP bands and dynamic levels, the tool helps you understand where real buying and s
FREE

Acceleration Bias — Price Acceleration Impulse Indicator Acceleration Bias is a modern analytical tool designed to measure changes in price acceleration and visualize impulse asymmetry using a robust mathematical model.
This indicator is intended for traders working with market volatility, impulse phases, and price-movement structure, as well as those who need algorithmic, rule-based analytical support. Purpose and Core Concept Unlike traditional oscillators that analyze only velocity changes
NYXORA SIGNAL – Precision Scalping Power for XAUUSD (M1) NYXORA SIGNAL is an advanced scalping indicator designed exclusively for XAUUSD (Gold) on the M1 timeframe .
It automatically detects potential reversal zones and refines them into a precise 30-pip area , giving traders fast and accurate entries in the ultra-volatile Gold market. Main Features Auto Reversal Zone Detection – Smart algorithm that identifies and refines potential reversal areas into a consistent 30-pip zone. Custom SL & TP Le
FREE
Market Profile with Dashboard Indicator - Complete User Guide
indicator Overview The Market Profile with Dashboard is a comprehensive trading analysis tool for MetaTrader 4 that displays market profile data, volume analysis, and key market structure information directly on your chart. This indicator helps traders identify significant price levels, market balance areas, and potential trading opportunities based on market profile theory.
Core Components and Features
Market Profile Display - Sh
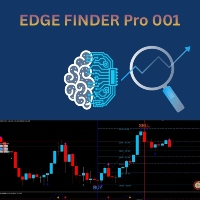
Edge Finder Pro 001 i s your all-in-one visual trading assistant, designed to cut through the market noise and highlight high-probability trading opportunities at a glance. It is an enhanced version with profit-taking levels, improved chart visibility, and greater ease in entering and exiting the market . How It Works (The Core Idea): Instead of overloading your chart with complex numbers, Edge Finder Pro 0 0 1 uses a unique, color-coded system to paint the market picture clearly. Trend & M

This system is very useful for trading because it solves several classic problems: 1. Objectivity & Precision Benefit: It eliminates the trader's personal bias. Every trader might draw a trendline slightly differently, but this indicator uses a precise mathematical logic (Fractals) to find the pivot points. The resulting lines are objective and consistent every time. 2. ️ Dynamic Updates Benefit: Your chart is always current. As soon as a new pivot is confirmed, the new trendline is drawn
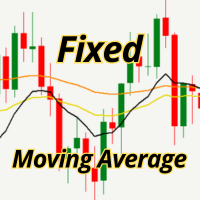
Display any moving average in its original timeframe, regardless of the chart’s timeframe.
What does it do?
This indicator allows you to view a moving average from any timeframe (M5, H1, H4, D1, etc.) directly on your current chart, preserving its original values from the timeframe you selected.
Practical example:
You are trading on the M5 timeframe.
You activate the H1 MA with this indicator.
You see exactly the same line you would see if you switched to H1.
Without changing the timeframe
Chara
FREE
Countdown timer for candle close.
FUNCTIONS:
- Exact countdown to candle close
- It works on all timeframes (M1 to MN)
- 2 display formats
- Customizable font color and size
- Adjustable position on the chart
- Real-time update every second
IDEAL FOR:
- Scalping and day trading
- Trading with precise timing
- Practice time management in operations
- All traders who need timing control
Do you want more?
Upgrade to Timer PRO and get:
- Real-time Profit/Loss display
FREE

JED-Trend Enhanced v5.9 — Elite Non-Repainting Trend Filter
JED-Trend Enhanced v5.9 is a professional trend-following indicator based on a three-dimensional analysis of market dynamics: - Jerk — the third derivative of price (acceleration of acceleration) detects emerging momentum - Shannon Entropy — measures market orderliness and filters out chaotic noise - SMA-Based Phase Analysis — structures the market into bullish, bearish, and flat phases
Key Features
Phase-Based Filteri
Product Name: GM Arrows Pro – Signals & Alerts Short Description:
GM Arrows Pro is a clean, reliable MT4 indicator showing BUY/SELL arrows on the chart with unique alerts at the moment the signal appears. Full Description:
GM Arrows Pro is a professional MT4 indicator designed for traders who want clear, actionable signals: BUY and SELL arrows visible on the entire chart history Unique alerts when a new signal appears (no repeated alerts) Option to disable repetitive signals ( disable_repeatin
Cycle Signals Indicator. Gives signal on price range cycling and smoothed with algorithm. There are very small parameters: allow alerts (Pop Up or Email), colors for chart arrows, timeframe to use for calculation (but better to use current timeframe). And most important parameter is "period". For low timeframes high values are recommended. Current period is good for M5. Decrease it for higher timeframes. Close trade arrows will come soon. MT5 version comes soon (but with some small price).
FREE
FVG Detector Pro — Advanced Fair Value Gap Detection System FVG Detector Pro is a powerful and precise tool designed to automatically identify Fair Value Gaps (FVGs) on any symbol and timeframe.
It helps traders spot potential supply and demand imbalance zones that can signal high-probability reversal or continuation opportunities. This indicator was engineered for professional traders who rely on price action, imbalance, and institutional order flow concepts — while maintaining excellent perfor
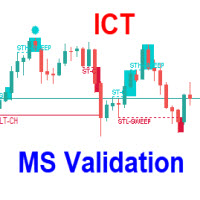
The ICT Anchored Market Structures with Validation trading indicator is designed to bring precision, objectivity, and automation to price action analysis. It helps traders visualize real-time market structure shifts, trend confirmations, and liquidity sweeps across short, intermediate, and long-term market phases — all anchored directly to price, without relying on any external or user-defined inputs. Uses Market structure is one of the most critical foundations of price action trading st

Reversing MACD — Indicator Overview Reversing MACD is a forward-looking analytical tool that calculates the exact price the next bar would need to reach for the MACD line and the signal line to cross on the upcoming candle .
Instead of waiting for a crossover to occur after the fact, the indicator answers a more powerful question: “At what price will the MACD cross on the very next bar ?” Core Idea Behind the Indicator Traditional MACD reacts to price changes after they occur .
A trader only see

ICT Kill Zone Indicator - Smart Trading Session Visualization Tool Product Highlights: Precise, Beautiful, Intelligent Trading Session Identification Why You Need This Indicator? Dear Trader, have you ever missed perfect trading opportunities because you couldn't identify key market sessions? Have you struggled with timezone confusion when analyzing market rhythms? The ICT Kill Zone Indicator is the perfect solution to these challenges! Developed based on core ICT trading concepts, this

Parabolic MA Pro - Système de Trading Avancé Détectez les retournements de tendance avec précision grâce à notre système unique combinant SAR Parabolique et Moyenne Mobile ! CARACTÉRISTIQUES RÉELLES SYSTÈME HYBRIDE INNOVANT SAR Parabolique calculé sur la Moyenne Mobile (au lieu du prix direct) Filtrage des faux signaux grâce à la double validation Algorithme exclusif de retournement de tendance ALERTES PRÉCISES Notifications sonores aux points de retournement Détection automati
FREE

Trade Session Marker is an advanced Session marker Designed for professional traders seeking clarity, accuracy, and smart session label. this gives clear session start and ending. that will enable user to make decision on what to do in the session. It marks all session start and close, for clarity 15M timeframe gives a clear marker. this will boost planning for entry and exit of trades, it also allow you to see how the market has moved over the session.

Trend Flower MT4 Indicator Trend Flower is a professional Buy & Sell signal indicator developed for the MetaTrader 4 platform. It generates precise entry signals with predefined Stop Loss and Take Profit levels, allowing traders to act with clarity, discipline, and confidence.
Default settings are optimized for EURUSD H1
Main Features
True Non-Repaint Signals All Buy and Sell signals are confirmed at candle close and never change, repaint, or disappear. What you see on the chart is

Looking for a powerful yet lightweight swing detector that accurately identifies market structure turning points?
Want clear, reliable buy and sell signals that work across any timeframe and any instrument?
Buy Sell Arrow MT Swing is built exactly for that — precision swing detection made simple and effective. This indicator identifies Higher Highs (HH) , Higher Lows (HL) , Lower Highs (LH) , and Lower Lows (LL) with remarkable clarity. It is designed to help traders easily visualize market str
Signal Histogram 은 MetaTrader 4 플랫폼에서 종가와 이동 평균을 비교하여 현재 추세를 시각적으로 파악하도록 설계된 신뢰할 수 있는 기술 지표입니다. 이 지표는 별도의 창에 히스토그램을 표시합니다. 녹색 막대는 가격이 평균보다 높음을, 빨간색 막대는 가격이 평균보다 낮거나 같음을 나타냅니다. 이러한 접근 방식을 통해 추세 방향을 신속하게 평가하고 잠재적인 반전 지점을 파악할 수 있습니다. 이 지표는 가격과 이동 평균의 교차점에서 거래 신호를 생성하므로 스캘핑 및 일중 거래에 특히 유용합니다. 모든 신호는 봉이 마감된 후에만 생성되므로 재표시되지 않으므로 안정성과 과거 데이터를 기반으로 객관적으로 성과를 평가할 수 있습니다. 정확성을 높이기 위해 Signal Histogram은 시간 필터를 사용합니다. 거래 세션 창을 사용자 지정하여 노이즈가 많은 기간을 제외하고 가장 활발한 시장 세그먼트에 집중할 수 있습니다. 따라서 이 지표는 특정 시간에 거래하는 것을 선호
The Reflection Angle indicator is a high-precision professional tool that delivers over 90% accuracy across all timeframes . It’s designed to detect price reversals and pinpoint ideal entry points with exceptional reliability. Key Features: Works flawlessly on all timeframes with no signal delays. Performs best during high-liquidity sessions such as London and New York . Ideal for news events and volatile market conditions . Proven signal accuracy exceeding 90% in real trading tests. Recom

Indicator Name: BreakingConfirmedLevel
Type: Professional indicator for detecting confirmed breakouts of strong price levels Description:
The BreakingConfirmedLevel indicator is an advanced tool designed to detect confirmed breakouts of strong price levels in the market. It relies on precise price action analysis and multi-layer confirmation logic before generating any signal. This ensures highly accurate entry points after a real breakout, minimizing false signals and increasing consistency in
Banks Session Lines 지표 Banks Session Lines는 가격 변동 시간대를 자동으로 강조 표시합니다. 스마트 머니 트레이더는 아시아, 런던, 뉴욕 등 은행이 거래하는 주요 기관 거래 세션을 차트에 완벽하게 맞춤 설정할 수 있는 세션 라인을 통해 명확하게 표시하고 추적할 수 있습니다.
변동성 주기를 추적할 때 명확성과 정확성이 필요한 트레이더를 위해 설계되었습니다.
Banks Session Lines를 사용해야 하는 이유
모든 주요 변동은 기관 은행의 거래 세션 시간 내에 시작되고 종료되기 때문입니다. 이 도구는 은행의 거래 세션을 시각적으로 명확하게 보여주므로 시장 변동 가능성이 높은 시간에만 거래하고 시장 변동 가능성이 낮은 시간에는 거래를 피할 수 있습니다. 은행이 가격을 형성, 포착, 방출하는 정확한 시간 내에 유동성이 변동하는 경우에만 은행과 거래할 수 있도록 지원합니다. 세션 기반 가짜 거래, 유동성 스윕, 기관 거래 흔적을 파악하는 데 적합합
제품 제목 ZigZag Colored (MT4)
See also >> Smart ZigZag Pro , Smart ZigZag (free)
간단 설명 MT4용 이중 색상 ZigZag. 단일 선 색상 제한을 해결하고, 각 바의 현재 다리 값과 방향을 EA가 읽을 수 있는 버퍼로 제공합니다. 개요 기존 ZigZag 경로를 상승/하락 두 색상으로 분리 표시; 바‑별 값은 EA/지표에서 활용 가능. 주요 기능 이중 색상 다리; EA 버퍼 ZigZag Up , ZigZag Down , ZigZag Per Bar ; 기본 동작; 경량 렌더링; 모든 종목/시간 프레임. 입력 기본 ZigZag 입력: Depth, Deviation, Backstep; 추가로 상승/하락 색상 설정. 버퍼 표준 ZigZag 버퍼와 추가 바‑별 버퍼를 포함: ZigZag Up ; ZigZag Down ; ZigZag Per Bar . 사용 사례 구조/스윙의 빠른 판독; EA에 바‑별 값/방향 제공; 최근
FREE
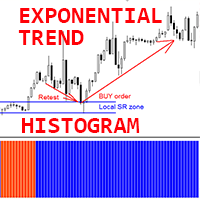
MT4용 Crypto_Forex 지표 "지수 추세 히스토그램", 리페인트 불필요
- 지수 추세 히스토그램 지표는 추세 감지에 매우 효율적입니다. - 가장 효과적인 사용 방법은 지지/저항선 및 재테스트 기법과 함께 사용하는 것입니다(그림 참조). - 지표가 새로운 추세를 감지하면, 해당 지지/저항선의 재테스트를 예상하여 해당 지점에 대기 주문을 설정합니다. - 새로운 추세가 강세일 경우 매수 지정가 대기 주문을, 약세일 경우 매도 지정가 대기 주문을 설정합니다. - 지표는 두 가지 색상으로 표시됩니다. 빨간색은 약세 하락 추세, 파란색은 강세 상승 추세를 나타냅니다(색상은 설정에서 변경 가능). - 모바일 및 PC 알림 기능 제공.
여기를 클릭하여 고품질 트레이딩 로봇과 지표를 확인하세요! 본 제품은 MQL5 웹사이트에서만 제공되는 오리지널 제품입니다.
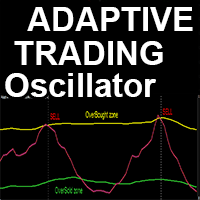
고급 맞춤형 Crypto_Forex 지표 "적응형 트레이딩 오실레이터" - MT4를 위한 효율적인 보조 트레이딩 도구!
- 이 지표는 차세대 오실레이터입니다. 사용 방법은 그림을 참조하세요. - "적응형 트레이딩 오실레이터"는 조정 가능한 적응형 과매도/과매수 영역을 제공합니다. - 이 오실레이터는 동적인 과매도/과매수 영역에서 청산 시점을 정확하게 파악하는 보조 도구입니다. - 과매도 영역: 녹색선 아래 - 과매수 영역: 노란색선 위 - 이 지표는 가격 변동 패턴 및 추세 전략과 함께 사용하기에 적합합니다. - 일반 오실레이터보다 훨씬 정확합니다. - 모든 시간대에서 사용할 수 있습니다. - PC 및 모바일 알림 기능이 내장되어 있습니다.
여기를 클릭하여 고품질 트레이딩 로봇과 지표를 확인하세요! MQL5 웹사이트에서만 제공되는 정품 제품입니다.
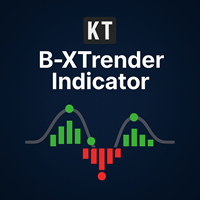
KT B-Xtrender는 원래 Bharat Jhunjhunwala가 IFTA 저널에서 소개한 추세 추종형 도구를 기반으로 발전시킨 고급 버전입니다. 우리는 개념을 정교하게 다듬어 더 정확한 신호와 내장 알림 기능을 제공하여 트렌드가 형성된 시장에서 더 안정적인 기회를 포착할 수 있도록 했습니다. 여러 차트에 적용할 수 있지만, 특히 4시간(H4) 및 일간(Daily)과 같은 높은 시간 프레임에서 최고의 성능을 발휘합니다.
특징
이중 트렌드 관점: 단기와 장기 흐름을 함께 분석하여 단순 조정인지, 실제 추세 전환인지 명확하게 구분할 수 있습니다. 명확한 신호: 매수 및 매도 신호를 직관적으로 제공하고, 포지션 조절 지점까지 제시하여 더 자신 있게 거래를 관리할 수 있습니다. 단기 히스토그램: 큰 추세 속에서 나타나는 단기 조정을 시각적으로 표시합니다. 녹색은 상승 모멘텀을, 빨간색은 단기 약세를 나타냅니다. 장기 히스토그램: 빠른 이동 평균과 느린 이동 평균을 RSI로 부드럽게

Zen Arrows 전문가용으로 설계된 이 시스템은 지연이나 잘못된 업데이트를 방지하는 강력한 신호 로직과 안전한 계산 기능을 갖추고 있습니다. 이전 신호를 다시 그리거나 삭제하거나 수정하지 않습니다. 모든 매수 및 매도 신호는 캔들스틱 자체에서 생성되며 고정됩니다. 실제 거래에서는 신호를 다시 그리지 않고 캔들스틱 자체에 즉시 나타납니다. 전문가 수준의 안정성, 정확성, 유연성을 제공합니다. 이 시스템은 추세 반전과 모멘텀 변화를 정확하게 식별하여 노이즈와 잘못된 신호를 최소화하면서 높은 수익률을 제공하는 신호를 제공합니다. 주요 기능 다단계 필터링 시스템(모듈식, 완벽한 사용자 정의 가능) 사실적인 실시간 시각화 차트에 명확한 텍스트로 바로 표시되는 매수/매도 신호 다단계 알림 시스템 팝업 창, 사운드 각 신호는 반복되지 않고 한 번만 트리거됩니다. MT4에 완벽하게 최적화되었습니다. 모든 통화쌍, 지수, 주식, 외환 및 암호화폐에 적합합니다. 추세 트레이딩, 스윙 트레이딩,
FREE
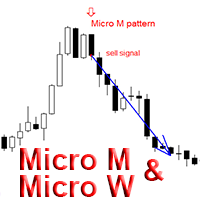
MT4용 Crypto_Forex 지표 "Micro M 및 Micro W 패턴", 리페인트 및 지연 없음.
- "Micro M 및 Micro W 패턴" 지표는 가격 변동 거래에 매우 강력한 지표입니다. - 이 지표는 차트에서 Micro M 패턴과 Micro W 패턴을 감지합니다. - 상승 Micro W - 차트에 파란색 화살표 신호(그림 참조). - 하락 Micro M - 차트에 빨간색 화살표 신호(그림 참조). - PC 및 모바일 알림 기능 내장. - "Micro M 및 Micro W 패턴" 지표는 지지/저항 레벨과 함께 사용하기에도 매우 좋습니다. - 모든 시간대에서 사용 가능합니다. - 추세 변화 또는 조정 종료 시점을 감지하는 데 매우 유용한 지표입니다.
// 훌륭한 트레이딩 로봇과 지표는 다음 링크에서 확인하실 수 있습니다: https://www.mql5.com/en/users/def1380/seller MQL5 웹사이트에서만 제공되는 오리지널 제품입니다.
MetaTrader 마켓은 거래로봇과 기술지표를 판매하기에 최적의 장소입니다.
오직 어플리케이션만 개발하면 됩니다. 수백만 명의 MetaTrader 사용자에게 제품을 제공하기 위해 마켓에 제품을 게시하는 방법에 대해 설명해 드리겠습니다.
트레이딩 기회를 놓치고 있어요:
- 무료 트레이딩 앱
- 복사용 8,000 이상의 시그널
- 금융 시장 개척을 위한 경제 뉴스
등록
로그인
계정이 없으시면, 가입하십시오
MQL5.com 웹사이트에 로그인을 하기 위해 쿠키를 허용하십시오.
브라우저에서 필요한 설정을 활성화하시지 않으면, 로그인할 수 없습니다.