Guarda i video tutorial del Market su YouTube
Come acquistare un Robot di Trading o un indicatore
Esegui il tuo EA
hosting virtuale
hosting virtuale
Prova un indicatore/robot di trading prima di acquistarlo
Vuoi guadagnare nel Market?
Come presentare un prodotto per venderlo con successo
Nuovi indicatori tecnici per MetaTrader 4 - 13
Product Description: BBMA Dashboard Guide BBMA Dashboard Guide is a BBMA-based indicator designed to help traders monitor market structure across all timeframes – from MN1 down to M1 – in one clean and interactive dashboard. With this tool, you no longer need to switch between multiple charts. All key information is displayed in a single, easy-to-read dashboard . Key Features: Multi-Timeframe Structure
Instantly view BBMA analysis from monthly to 1-minute charts, allowing you to track l

Market Vortex.mq4 is a powerful arrow indicator designed to accurately identify reversal points and trend continuations. Built on a smoothed oscillator and adaptive moving averages, it helps traders quickly find market entry and exit points without complex calculations.
Key Features:
Clear arrow signals: The indicator displays Buy/Sell arrows directly on the chart.
Real-time operation: Signals are generated without delays or repainting.
Adaptive calculation: The indicator uses a do
The AX Forex Indicator MT4 is a sophisticated trading tool designed to provide traders with a comprehensive analysis of multiple currency pairs. This powerful indicator simplifies the complex nature of the forex market, making it accessible for both novice and experienced traders. AX Forex Indicator uses advanced algorithms to detect trends, patterns and is an essential tool for traders aiming to enhance their forex trading performance. With its robust features, ease of use, and reliabl

The Ultimate Trading Companion: Smart Trend Tracer Tired of getting lost in market noise? Ready to find the clearest trends with pinpoint accuracy? Introducing Smart Trend Tracer , the ultimate tool designed to cut through the clutter and reveal the most profitable market swings. This isn't just another indicator; it's your personal guide to spotting trends as they form, giving you the confidence to make smarter trading decisions. Smart Trend Tracer identifies significant highs and lows on your
FREE

Unleash Your Trading Potential with the Ultimate Trend Sniper Are you tired of missing out on major market moves? Want to spot trends with laser-like precision? The Ultimate Trend Sniper is a powerful, yet easy-to-use indicator designed to help you do just that. It's not just another moving average—it's a smart tool that gives you a clear edge in the market. Main Features & Benefits: Precision Entry & Exit Signals: The indicator uses two advanced T3 moving averages to generate highly accurate bu
FREE

Zig Zag Robot: A Comprehensive Reversal Trading System The Zig Zag Robot is a powerful tool designed to accurately identify key market reversals and filter out market "noise." It goes beyond a simple Zig Zag indicator by combining multiple tools and built-in logic to provide you with ready-to-use trading signals and help you make more informed decisions. How It Works The indicator uses a multi-level approach to market analysis, which allows it to find high-probability entry points: Signal Filter

TOP DOWN PREMIUM INDICATOR (mt4 version) Introduction The TOP DOWN PREMIUM INDICATOR is the King of Top-Down Analysis Tools for MT4 traders. It gives you the ability to analyze the market across all major timeframes — from as small as hourly data up to yearly projections — with unparalleled accuracy and clarity. This indicator allows traders to forecast, label, and visualize market structure from short-term intraday moves to long-term yearly cycles . With its built-in multi-timeframe forecast

Advanced Renko & Point & Figure Indicator with Win/Loss Pattern Analysis This powerful indicator combines two proven strategies—Renko and Point & Figure (P&F)—into one comprehensive tool for trend identification, pattern recognition, and risk management. With dynamic Box Size calculation (Fixed or ATR-based), moving average filters, and win/loss pattern detection, traders can make smarter, data-driven decisions.
Key Features
Hybrid Renko + P&F System Renko: Noise-free price action with fixed
FREE
Keltner Signals Pro: Trade Smarter, Earn More! Keltner Signals Pro Now available in EA format. Download Now. Boost your trading accuracy and eliminate false signals with Keltner Signals Pro – the advanced yet intuitive indicator designed for serious traders seeking consistent profits! Tired of misleading trading signals? Keltner Signals Pro masterfully combines the power of Keltner Channels for identifying crucial price breakouts with an unbeatable EMA200 Trend Filter . The result? More accurate
FREE

AlphaTrend Pro - Enhanced Visual Trend Detection Indicator Product Title AlphaTrend Pro - Advanced Trend Detection with Crystal-Clear Visual Signals Brief Description AlphaTrend Pro is a sophisticated trend-following indicator that combines volatility analysis (ATR) with momentum oscillators (RSI/MFI) to create dynamic support and resistance levels. Enhanced with large directional arrows and smart visual positioning, this professional MT4 indicator provides unmistakable buy/sell signals that ada
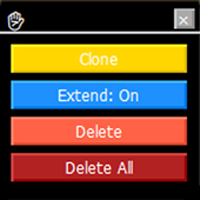
Trendline Toolbox (MT4) Trendline Toolbox is a utility indicator for MetaTrader 4 that helps manage trendlines and common chart objects. It does not provide trading signals and does not guarantee any profit. Main functions Clone the selected trendline (style, angle, and price levels are preserved). Toggle the “Extend” property for the selected trendline. Delete the selected trendline. Delete all objects on the current chart. Double-click the hand icon to enable move mode, then drag the panel to
FREE

Unlock Smarter Trading with Trend-Sensing Pro Are you tired of confusing charts and late signals? Trend-Sensing Pro is a powerful yet simple indicator designed to help you see market trends with crystal clarity. It combines the smoothness of an EMA (Exponential Moving Average) with a unique candle visualization, giving you a clean, noise-free view of the market's direction. Why You'll Love Trend-Sensing Pro See the True Trend : Trend-Sensing Pro cuts through market noise, making it easy to ident
FREE

Trend Zig Zag: A Trend Reversal Indicator The Trend Zig Zag is an advanced indicator designed to precisely identify key market reversals and filter out market "noise." By building upon the classic Zig Zag indicator, it gives traders a clearer view of the trend structure, helping them find optimal entry and exit points. Key Advantages: Focus on the Trend : This indicator uses data from a higher timeframe, which lets you ignore minor price fluctuations and focus on significant movements. This i
Trend Reversal Master Unlock Your Trading Potential with Precision Are you tired of missing key market reversals? Do you struggle to find high-probability entry points? "Trend Reversal Master" is the smart MQL4 indicator designed to help you spot potential trend shifts with confidence and clarity. This powerful tool combines the best of two worlds: the dynamic Parabolic SAR (PSAR) and the robust 200-period Exponential Moving Average (EMA). By filtering PSAR signals through the long-term trend de
FREE

Discover the Power of Trend Strength Pro Unlock a new level of clarity in your trading with Trend Strength Pro , the ultimate tool for visualizing market momentum. Stop guessing and start seeing the true strength of a trend with a single glance. Our elegant and intuitive indicator helps you make smarter, more confident trading decisions. Key Advantages & Features Instantly See Trend Strength : Our color-coded histogram tells you whether the trend is getting stronger or weaker. Green means moment
FREE
Unleash Smarter Trading with the Smart Signal Generator Tired of guesswork in your trading? The Smart Signal Generator is your new essential tool, designed to simplify your strategy and give you a powerful edge. This isn't just another indicator—it's a system built to provide you with high-probability entry signals, saving you time and boosting your confidence. Key Advantages & Features Intelligent Signal Generation : Our system goes beyond basic crossovers. It uses a built-in EMA filter to conf
FREE
BreakBack21 Indicator Premium – Identify powerful EMA21 breakouts with smart confirmation, real-time statistics, and a unique recommendation system. A professional indicator designed to help traders evaluate EMA21 breakouts with clarity, precision, and consistency. Ideal for Binary Options and Forex scalping on M1. Key Features EMA21 Breakout Detection with confirmation candle filter Real-Time Recommendation System — Tracks performance candle by candle, starting fresh each session ADX & ATR Mark
Find Your Trading Direction with Signal Compass Pro ! Tired of guessing your next move? Signal Compass Pro is your answer. This indicator isn't just a tool; it's your personal compass in the financial markets. By combining three powerful momentum indicators— CCI , WPR , and Force Index —we provide confirmed trading signals that are cleaner, more reliable, and less prone to "noise." Key Features & Advantages Confirmed Signals: No more guesswork. This indicator merges the power of three momentum i
FREE

Master Your Market Entries and Exits! Are you tired of confusing, noisy indicators that give you false signals? The Stochastic Market Master is designed to cut through the noise and deliver crystal-clear trading opportunities directly to you. This powerful tool uses a unique double-smoothing process to provide more accurate buy and sell signals, helping you spot trend reversals with confidence and precision. With this indicator, you can stop staring at your screen all day. Our built-in alert and
FREE

Transform Your Trading with the Visual Trend Ribbon Tired of missing the big moves? Do you struggle to identify the market's true direction? The Visual Trend Ribbon is your solution. This powerful indicator cuts through the market noise, giving you a clear, visual understanding of the trend so you can trade with confidence. Instead of a single, lagging line, the Visual Trend Ribbon uses a dynamic band of multiple moving averages to show you the market's true momentum. When the ribbon expands, t
FREE

Представляем "Dragon_Structure_Filter" — это не просто индикатор. Это ваш личный аналитический отдел, встроенный в MetaTrader 4. Он находит мощнейший разворотный паттерн "Дракон" и пропускает его через 7 степеней защиты от убыточных сделок. Наша Технология Фильтрации: Как Мы Отсеиваем 95% "Мусорных" Сигналов Каждый фильтр — это ваш личный страж, который стоит на защите вашего депозита. Вот как они работают: Фильтр 1: Согласование с Глобальным Трендом (Market Structure Filter) Как работает?
FREE

The Wave Rider Indicator: Your Key to Confident Trading Tired of trying to guess market movements? The Wave Rider indicator is your solution. It's an intelligent tool designed to help you spot profitable trends with ease and confidence. What makes it so powerful? See Trends Clearly : Wave Rider simplifies complex market data, so you can easily identify the direction of the trend and make smarter decisions. Get Timely Signals : It gives you clear buy and sell signals, helping you pinpoint the be
FREE

Unleash Your Trading Potential with the Apex Trend Detector! Are you tired of missing out on profitable trades? Do you struggle to find reliable entry and exit points in the volatile forex market? It's time to upgrade your trading arsenal with the Apex Trend Detector – the intelligent MT4 indicator designed to cut through market noise and pinpoint high-probability trading opportunities! The Apex Trend Detector isn't just another indicator; it's a sophisticated signal system that expertly fuses t
FREE

MA Cross Histogram Oscillator (MT4) The MA Cross Histogram Oscillator is a custom indicator designed to visualize the relationship between two moving averages in the form of a color-coded histogram. Instead of drawing standard MA lines on the chart, it highlights the strength and direction of the trend by comparing the difference between a fast and a slow moving average. Green bars – bullish momentum (fast MA is above slow MA and rising). Red bars – bearish momentum (fast MA is below slow MA and
FREE

TurnPoint Indicator – Market Reversal & Trend Signal Tool The TurnPoint Indicator is designed to help traders identify potential turning points and key levels in the market. By analyzing price action, it highlights areas where reversals or continuations are likely to occur, allowing traders to anticipate trend changes more effectively. This tool incorporates advanced logic to filter signals, reducing noise and false alerts. Users can choose between breakout and pullback modes, depending on thei
FREE

Precision Entry Master: Your Key to Confident Trading Tired of second-guessing your trades? The Precision Entry Master indicator is designed to help you find high-quality entry points with confidence. It combines two powerful market analyses to give you a clear signal, filtering out noise and false signals so you can focus on the best opportunities. Our unique system works by finding the perfect moment when market momentum is changing and the overall trend is in your favor. When these two condit
FREE

PipsZenith Trend Range Assistant Overview The PipsZenith Trend Range Assistant is a clean, professional MT4 indicator designed to help traders quickly identify whether the market is in a trend (bullish/bearish) or range (sideways). It removes guesswork and prevents false trades in choppy conditions by combining Moving Average slope and ADX strength filters, while also offering Heiken Ashi confirmation for smoother trading decisions. This tool is lightweight, intuitive, and built with contr
The "POSITION FINDER " indicator visually combines custom Fibonacci retracement levels with a Relative Strength Index (RSI) overlay to highlight important price zones and momentum signals on the chart. It marks key support and resistance areas derived from recent highs and lows, and displays RSI values to help spot possible overbought and oversold conditions, along with buy and sell signals for easier market analysis The indicator can be used as a standalone system for scalping on M1, M5 time fr
The BLACK ZONE PREMIUM INDICATOR is a powerful all-in-one trading assistant built to bring clarity, precision, and consistency to forex trading. It combines multi-timeframe market structure, trade forecasting, risk management, and live monitoring into one professional-grade tool. From planning trades to managing them with discipline, this indicator equips traders with everything they need to make informed and confident decisions. If you’ve been looking for a professional solution that simplifies
SuperSignalsX is a modern indicator designed to simplify market analysis and make it more visual and effective.
Its main function is to automatically detect local highs and lows based on Average True Range (ATR). At these points, the indicator places clear marks in the form of circles with arrows, allowing traders to quickly navigate even in highly volatile market conditions. Using SuperSignalsX significantly increases efficiency, as it removes routine calculations and eliminates the need to man
Golden Trend Matrix Signals— Multi-Filter Trend & Momentum Indicator (H1/H4)
Turn noisy charts into clean, tradeable signals. Golden Trend Matrix Signals fuses 20 proven tools into one professional dashboard and signal engine designed for swing-style entries on H1/H4 with disciplined exits. What it does Finds strong, aligned trends using EMA structure (21/55/200). Confirms momentum with ADX(14) strength plus SuperTrend direction. Times entries with volatility and mean-reversion context (BB, Kelt
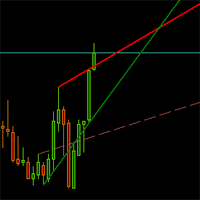
Dynamically draws trend lines, broken trend line. Auto delete after X minutes or Y hours. Enter the # of bars look back period. Lines re-draw at the close of each new bar ensuring the current trend is followed.Inputs include support line color, resistance line color, width, style (solid, dotted, dashed). Watch demo video here: https://www.youtube.com/watch?v=N1Bf82bsqws

SMC Easy Signal was built to remove the confusion around the smart money concept by turning structural shifts like BOS (Break of Structure) and CHoCH (Change of Character) into simple buy and sell trading signals. It simplifies market structure trading by automatically identifying breakouts and reversals as they happen, allowing traders to focus on execution rather than analysis. Whether the market is continuing its trend or preparing to reverse, the indicator translates complex price action in
The price is indicated only for the first 30 copies ( only 2 copies left ). The next price will be increased to $150 . The final price will be $250. Sniper Delta Imbalance is a professional tool for deep delta analysis — the difference between buyer and seller volumes. It takes volume analysis to the next level, allowing traders to see in real time who controls the price — buyers or sellers
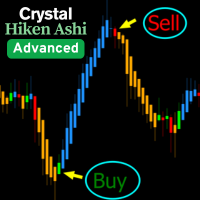
Crystal Heikin Ashi – Visualizzazione Avanzata Heikin Ashi (Versione MT4) Panoramica Crystal Heikin Ashi per MetaTrader 4 è un indicatore Heikin Ashi di livello professionale che migliora la visualizzazione dei grafici e fornisce chiarezza ai trader price action, scalper e analisti.
Questa versione MT4 si concentra sulle candele Heikin Ashi pure con stile intelligente, mantenendo il sistema leggero e veloce. Nota: La colorazione basata sul trend e il rilevamento avanzato del momentum sono dispon
FREE

The Super Arrow Indicator provides non-repainting buy and sell signals with exceptional accuracy. Key Features No repainting – confirmed signals remain fixed Clear visual arrows: green for buy, red for sell Real-time alerts via pop-up, sound, and optional email Clean chart view with no unnecessary clutter Works on all markets: Forex, gold, oil, indices, crypto Adjustable Parameters TimeFrame Default: "current time frame" Function: Sets the time frame for indicator calculation Options: Can be set

PROSPERIUM è un indicatore tecnico completo, sviluppato per trader che cercano la massima affidabilità nell'analisi e nell'esecuzione delle operazioni. Creato per MetaTrader 4 e 5, combina diversi indicatori affermati (RSI, OBV, MACD, Bande di Bollinger, ADX, Ichimoku e Media di Gravità) in un sistema integrato di generazione di segnali di acquisto (CALL) e vendita (PUT). Con un pannello statistico avanzato e il calcolo automatico della percentuale di successo, PROSPERIUM fornisce una visione
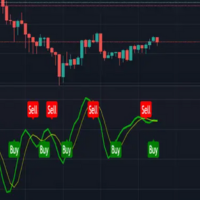
Pine script scalping indicator is a multi-layered analytical system designed for pinpoint interpretation of microstructure price fluctuations under high volatility conditions. At its core lies a complex model of dynamic price series filtration with inter-timeframe projections and nonlinear approximation of trend vectors. Unlike standard technical analysis tools, this indicator is not limited to a static oscillator approach but instead utilizes a hybrid interpretation of market data streams with

Purpose of the indicator:
Oracle Flow is designed to identify BUY/SELL market entry points using a combination of technical indicators and filters. The indicator displays arrows on the chart to signal possible trend reversals or continuations.
Main elements used:
Exponential moving averages (EMAs) – two periods are used: Faster and Slower. These are used to identify crossovers that confirm the strength of the movement.
RSI (Relative Strength Index): – assesses the strength of the trend.
Weekday Stats Overview: A Price Analysis Indicator by weekday. A quantitative technical analysis indicator developed for statistical analysis of price variations, with data classified by weekday. This indicator processes candle data and displays statistical results based on user input parameters. The input parameters allow defining the type and frequency of the statistics to be calculated. This indicator provides a quantitative basis for identifying market patterns. Output Data: The indicator c

Month Stats Overview: A Price Analysis Indicator by month. A quantitative technical analysis indicator developed for statistical analysis of price variations, with data classified by calendar month. This indicator processes candle data and displays statistical results based on user input parameters. The input parameters allow defining the type and frequency of the statistics to be calculated. This indicator provides a quantitative basis for identifying market patterns. Output Data: The indicator
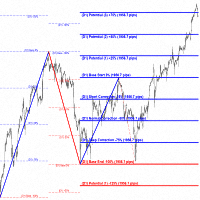
"Impulses and Corrections 4" is created to help traders navigate the market situation. The indicator shows multi-time frame upward and downward "Impulses" of price movements. These impulses are the basis for determining the "Base" , which is composed of zones of "Corrections" of price movements, as well as "Potential" zones for possible scenarios of price movement.
Up and down impulses are determined based on a modified formula of Bill Williams' "Fractals" indicator. The last impulse is always

Read detailed blogpost with screenshots here: https://www.mql5.com/en/blogs/post/764306 Note: This is the MT4 only version. Get the MT5 version here: https://www.mql5.com/en/market/product/150789
Features Kalman smoothing to reduce market noise. Supertrend bands for trend direction. Color-coded dots and arrows for quick reading. Arrow signals for trend continuation. Custom Timeframe for drawing bands Alerts for trend changes. Adjustable inputs for different styles.
How to Use
Green dots = bul
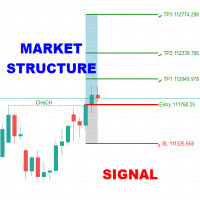
The Market Structure Signal indicator is designed to detect Change of Character (CHoCH) and Break of Structure (BOS) in price action, helping traders identify potential trend reversals or continuations. It combines market structure analysis with volatility (ATR) to highlight possible risk/reward zones, while also supporting multi-channel alerts so that no trading signal is missed. Interpretation Trend Analysis : The indicator’s trend coloring, combined with BOS and CHoCH detection, provide

Divergence
Divergence refers to when the price of a currency pair moves in one direction while the trend indicator is moving in the opposite direction. With divergence, there can be positive and negative signals. Divergences in Forex trading are quite common signals of technical analysis. These are basic early Forex signals indicating the trend reversal and filter false signals. Application of this indicator It is usually not easy to detect divergences by the trader and it may be time-consumin
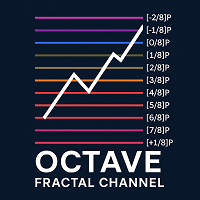
Octave Fractal Channel — Dynamic Gann-Based Support/Resistance Levels with Auto-Scaling. This indicator plots a dynamic channel based on the fractal structure of price movement. Channel levels adapt to the current symbol and timeframe, making it suitable for use across various financial instruments — from currency pairs to cryptocurrencies and indices. The indicator can be used in combination with other technical tools, such as the RSI oscillator, to provide additional signal filtering. How to

Your Good Friends — this is not just an indicator, but your reliable trading assistant, designed for traders who value simplicity, clarity, and stability. It combines the best classic methods of technical analysis — support and resistance levels, reversal signals, visual cues — and presents them in the clearest, most user-friendly format possible. Suitable for both beginners and experienced traders — especially those who want to eliminate chaos, reduce stress, and trade based on clear signals.
Scalping Strategy
BUY SELL
Having a strategy in the market is one of the main conditions for trading. The presence of various and complicated indicators and tools sometimes makes trading difficult, and the user gets confused after trying various methods and gets stuck in a loss cycle, the result of which is usually clear. This indicator is a simple strategy based on the detection of pivots and short-term trends, which helps you to easily trade in trends. Sometimes a simple but efficient s
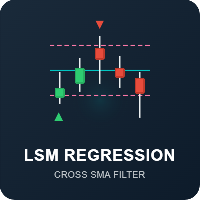
Description of the "Least Squares Method Regression Filter Cross SMA/LWMA" indicator Overview: An innovative trading indicator that combines three different types of signals based on moving averages and linear regression. An ideal solution for traders looking for a multi-level system of confirmation for trading signals. Key features Three types of signals: fast (SMA/LWMA), slow (regression), and filtered Smart filtering: filtering out false signals against the trend Flexible customization: indiv
Advanced Breakout Scanner Dashboard Stop missing powerful breakout opportunities! The Advanced Breakout Scanner Dashboard is a professional-grade trading tool that monitors up to 28 currency pairs in real-time, scanning for ten unique high-probability breakout strategies simultaneously. Attach it to a single chart to get a complete overview of the entire market, instantly identifying the best trading setups as they happen. This is not just a signal indicator; it's a complete trading dashboard d
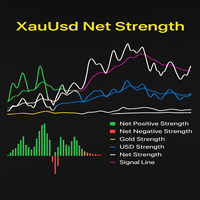
The XauUsd Net Strength indicator is a professional-grade market strength tool designed to track and compare the relative performance of Gold (XAU) against the U.S. Dollar (USD) across a diversified basket of currency pairs. Instead of relying on a single chart, it aggregates information from multiple gold- and dollar-based pairs, applies weighting factors, and translates the results into an easy-to-read strength comparison. The indicator plots six components in a separate window: Green & Red Hi
Major FX Signal Panel (AI Trade Planner's) - Professional Intraday Signal Dashboard
Unlock Your Intraday Trading Potential with a Powerful, All-in-One Signal Dashboard. Are you tired of switching between charts and struggling to find high-probability intraday setups? This Panel is a professional-grade MetaTrader 4 indicator designed to give you a decisive edge. It scans seven major currency pairs in real-time and delivers a complete, data-driven trade plan directly on your chart. Stop guessing a

This is a custom MT4 indicator called “Elsna Moving Average” . It plots three moving averages (MA1, MA2) on the chart with customizable periods, shifts, methods, and applied prices. MA1 & MA2 can optionally be used to create fill areas (histogram-like shading) based on a color-fill setting You can show or hide each MA individually. The indicator is designed for trend identification and visualization , helping traders see MA relationships and potential support/resistance zon
FREE

FVG - Fair Value Gap The FVG - Fair Value Gap is an advanced MQL4 indicator designed for traders who utilize institutional order flow and Smart Money Concepts to identify market inefficiencies. This indicator automatically detects and highlights Fair Value Gaps (FVGs) on your chart, providing a clear visual representation of potential support and resistance zones, reversal points, and high-probability trading setups. Key Features: Automated FVG Detection: The indicator automatically identifies
PipsZenith Volatility Breakout Indicator – Product Description Overview The PipsZenith Volatility Breakout Indicator is a professional MT4 tool designed for traders who want to identify high-probability breakout zones based on volatility and recent price action . With clear visual signals, adjustable display, and safe alerts, this indicator helps you stay ahead of market moves , maximize trading opportunities, and trade with confidence. Key Features Breakout Levels Based on Volatility Automatica
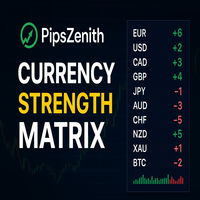
PipsZenith — Currency Strength Matrix & Volatility The PipsZenith Currency Strength Matrix & Volatility Indicator is a powerful and easy-to-use tool designed to transform the way you trade. Whether you're a beginner or an experienced trader, this indicator gives you clear and actionable insights into which currencies are strong, which are weak, and where the best trading opportunities are. With this tool, you’ll always know what to trade and in which direction , so you can make smarter, faster,

OrionFX AI Market Scanner - Your Ultimate Signal Dashboard Stop switching between dozens of charts. See the entire forex market from a single, professional interface. OrionFX is a professional-grade market scanner that combines a powerful 24-instrument dashboard with a high-confluence, five-indicator signal strategy. Designed for traders who demand precision and clarity, this indicator scans the market in real-time, identifying the highest-probability trade setups where all strategic components

Smart Signal Generation - Trend-Following Pro Dashboard - Multi-Currency Trading Indicator Overview The Trend-Following Pro Dashboard is a comprehensive multi-strategy trading indicator designed for serious Forex traders who demand professional-grade analysis across 28 major currency pairs and gold. This all-in-one dashboard combines the most effective trend-following strategies into a single, visually stunning interface that provides clear trading signals, precise entry points, and calculated r

The Multi-Currency Strength Index is a professional analytical tool designed to reveal relative strength and weakness across major currencies and Gold in a single, unified view. Instead of focusing on one symbol at a time, the indicator evaluates multiple instruments simultaneously and plots smooth strength lines in a separate window, making cross-market comparison fast and intuitive. Each colored line represents a currency’s aggregated performance over the selected analysis period. Values above

Reversal Merchant Overview Reversal Merchant is a non-repainting MT5 indicator that identifies high-probability market turning points. It combines Average True Range (ATR) volatility analysis with a long-term 100-period EMA filter to catch exhaustion moves and potential reversals. The tool draws clear buy/sell arrows directly on the chart and can optionally alert you in real time.
Core Logic
Look-Back Reversal Detection: Scans the highest highs and lowest lows over a user-defined period to loc

PipsZenith Momentum Box – Complete Details Indicator Name: PipsZenith Momentum Box Version: 1.0 Platform: MetaTrader 4 (MT4) – ATR-based momentum detection Product Overview: The PipsZenith Momentum Box is a professional ATR-based momentum indicator designed to detect high-probability price moves in real time. It identifies strong momentum candles, highlights them visually with dynamic boxes, and projects potential Take Profit (TP) and Stop Loss (SL) levels to give traders a clear roadmap for
Momentum Scan Pro - The Ultimate Multi-Timeframe Signal Dashboard
Stop switching between charts and timeframes. Momentum Scan Pro is a powerful, all-in-one dashboard that scans the entire market for high-probability momentum signals, delivering everything you need to trade with confidence in a single, clean interface. Built for traders who value speed and efficiency, this indicator scans up to 28 instruments across 5 different timeframes simultaneously. It identifies powerful trend continuations
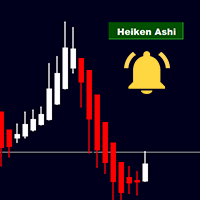
This is a Heiken Ashi indicator with an button adjustable button and alarm options. See more details below:
FEATURES OF THE INDICATOR: It's plug and play. Just drop it on any chart, and you are good to go. It doesn't interfere with any other indicators that are already on the chart. You click the button it shows, you click again and it disappears. You can change the The Heiken Ashi candle width by clicking on the scale button of Metatrader. Or you can preset it to whatever thickness you like.

RegLin Polinómico – Bande di regressione polinomiale con filtri intelligenti RegLin Polinómico è un indicatore professionale che adatta un polinomio (grado 1 , 2 o 3 ) a una finestra scorrevole di prezzo e traccia bande dinamiche sulla base della deviazione standard dei residui dell’adattamento. Include RSI (con time frame selezionabile) e un’opzione “solo in trend” per filtrare i breakout di bassa qualità. È inoltre possibile attivare/disattivare l’audio quando vengono generati segnali visivi (

Lot Size Calculator – Strumento di dimensionamento posizione Questo indicatore calcola la dimensione del lotto in base alla percentuale di rischio selezionata e alla distanza dello stop loss. È progettato per il trading di Forex, metalli, indici, materie prime e criptovalute.
Caratteristiche principali Calcolo della dimensione della posizione basato sul saldo del conto / equity disponibile e sulla percentuale di rischio scelta Modalità ordine a mercato e ordine pendente Livelli visivi sul grafi
Indice di Decomposizione del Volume (VDI) Il VDI è un indicatore proprietario di analisi del volume, sviluppato per identificare la forza e la direzione del movimento del prezzo basandosi sulla decomposizione del volume in attività di acquisto e vendita. L’indicatore visualizza il rapporto tra acquisti e vendite proiettando i dati di prezzo delle candele sul loro volume, permettendo al trader di ottenere una visione più completa della dinamica di mercato — ovvero quanto volume è stato generato d
FREE
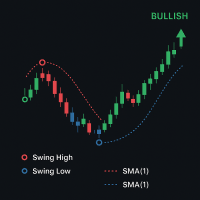
HighLow Swing — Indicatore di rilevamento di trend e swing Descrizione: HighLow Swing è un potente indicatore di rilevamento di trend e swing, progettato per aiutare i trader a identificare facilmente i principali punti di svolta del mercato e le direzioni di tendenza su qualsiasi timeframe del grafico. Evidenzia massimi e minimi significativi, disegna cerchi di tendenza basati sulla struttura dello swing e aiuta a rimanere al passo con il momentum del mercato con chiari segnali visivi. Caratte

Il Solarwind No Repaint è un oscillatore tecnico che applica la Trasformazione di Fisher ai dati di prezzo normalizzati, creando un indicatore basato su istogramma che identifica potenziali punti di svolta del mercato. Questo indicatore converte i movimenti di prezzo in una distribuzione normale gaussiana, rendendo i pattern ciclici e i cambiamenti di momentum più visibili ai trader. Come Funziona L'indicatore elabora i dati di prezzo attraverso diversi passaggi computazionali: Analisi Alto-Bass
FREE
Pearson Indicator Correlator è un indicatore statistico personalizzato che calcola il coefficiente di correlazione di Pearson tra la media mobile esponenziale (EMA) e qualsiasi altro indicatore da te scelto, standard o personalizzato. L’indicatore aiuta a filtrare segnali falsi, rilevare la coerenza del movimento e individuare divergenze tra il trend e le linee di segnale. Viene utilizzato per: filtrare i segnali di altri indicatori, analizzare la coerenza dei movimenti, individuare divergenze t

L'indicatore TMA AI Bands si basa sulla Media Mobile Triangolare (TMA) con bande superiore e inferiore dinamiche e frecce chiare di acquisto/vendita tracciate direttamente sul grafico. Integra un'IA per l'ottimizzazione adattiva e garantisce l'assenza di ridisegno, fornendo segnali precisi di inversione quando il prezzo tocca le bande.
* Coppie: funziona con tutte le coppie di valute
* Timeframe consigliati: D1 / W1 / MN
* Variabili esterne configurabili:
* TimeFrame – periodo di calcolo
Il MetaTrader Market è l'unico negozio online dove è possibile scaricare la versione demo gratuita di un robot di trading che consente di effettuare test e ottimizzazioni utilizzando dati statistici.
Leggi la descrizione dell'applicazione e le recensioni di altri clienti, scaricala direttamente sul tuo terminale e prova un robot di trading prima di acquistarlo. Solo sul MetaTrader Market è possibile testare un'applicazione in modo assolutamente gratuito.
Ti stai perdendo delle opportunità di trading:
- App di trading gratuite
- Oltre 8.000 segnali per il copy trading
- Notizie economiche per esplorare i mercati finanziari
Registrazione
Accedi
Se non hai un account, registrati
Consenti l'uso dei cookie per accedere al sito MQL5.com.
Abilita le impostazioni necessarie nel browser, altrimenti non sarà possibile accedere.