Quarterly Levels Pro

Quarterly Levels Pro v1.0 – Notice Commerciale

Nom du produit :

Quarterly Levels Pro v1.0

Développeur :

KOUAME N'DA LEMISSA

Version :

1.0

Description :

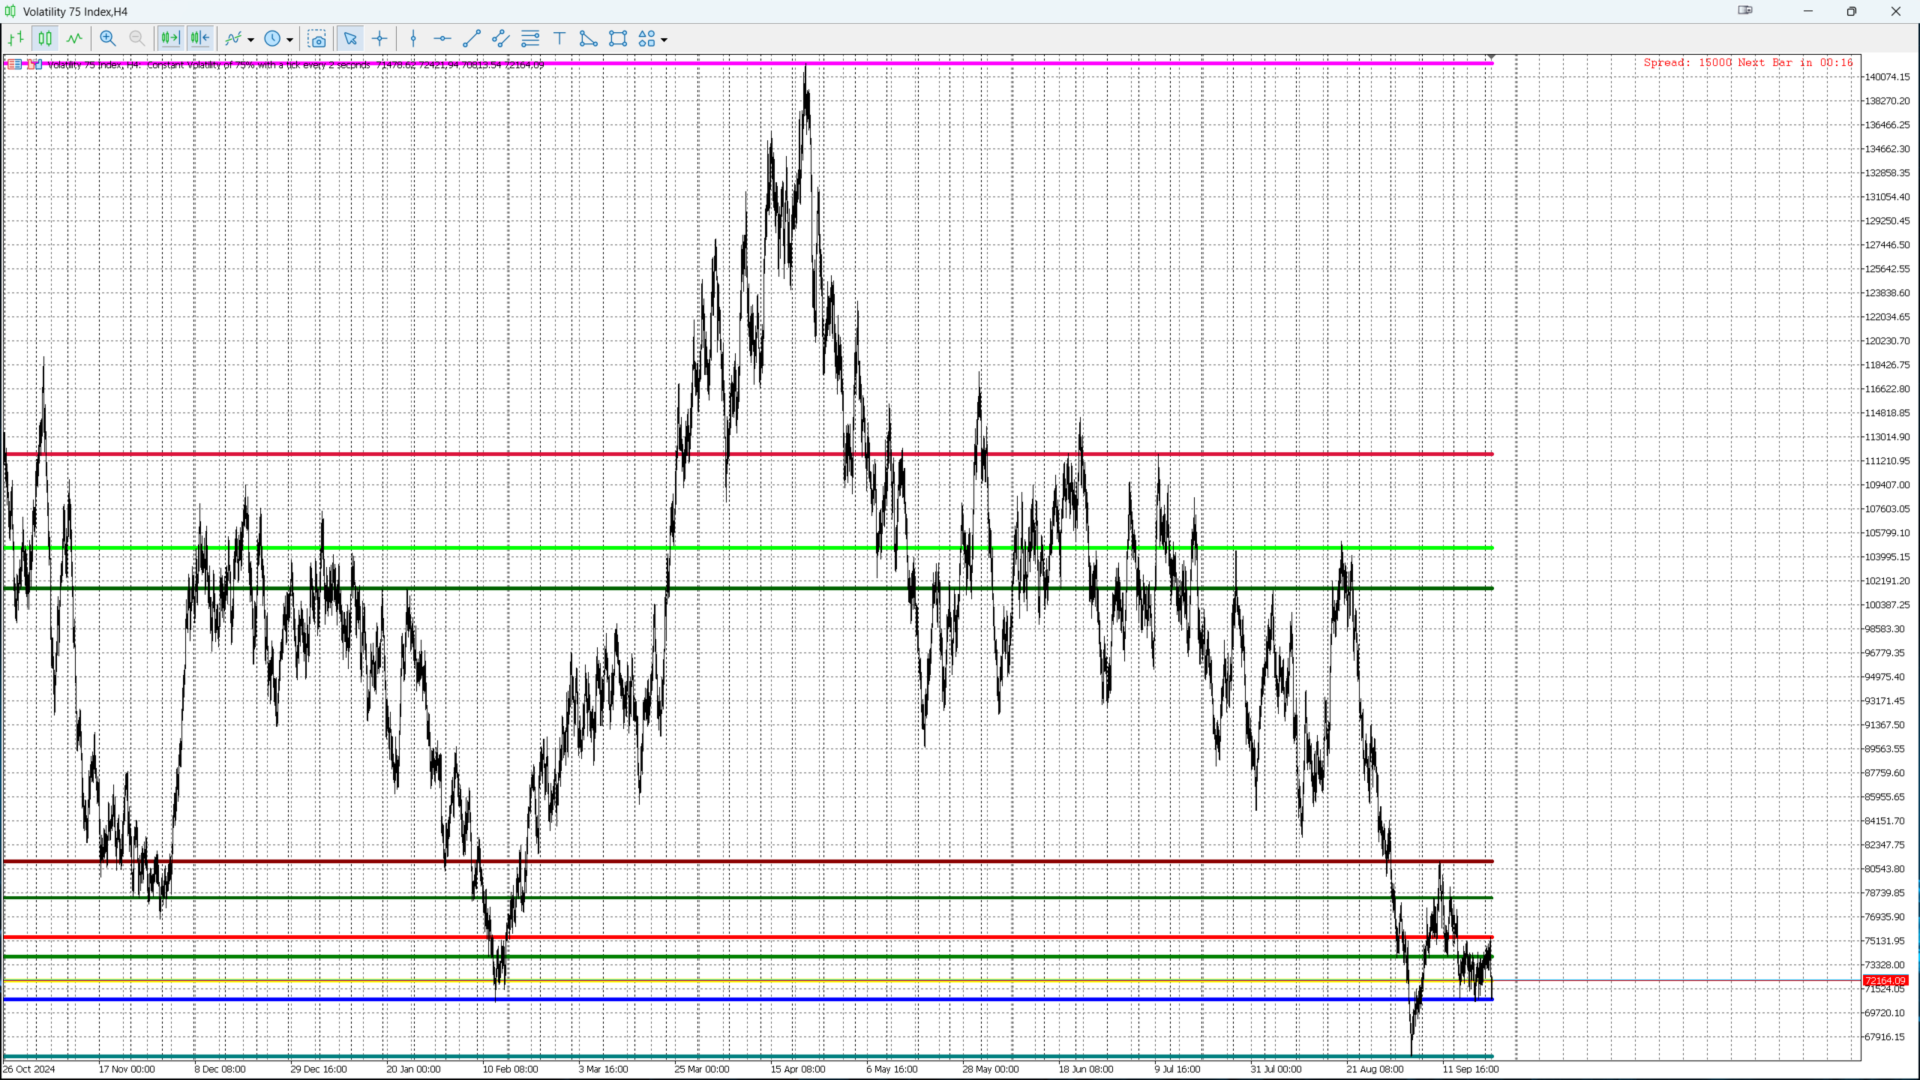
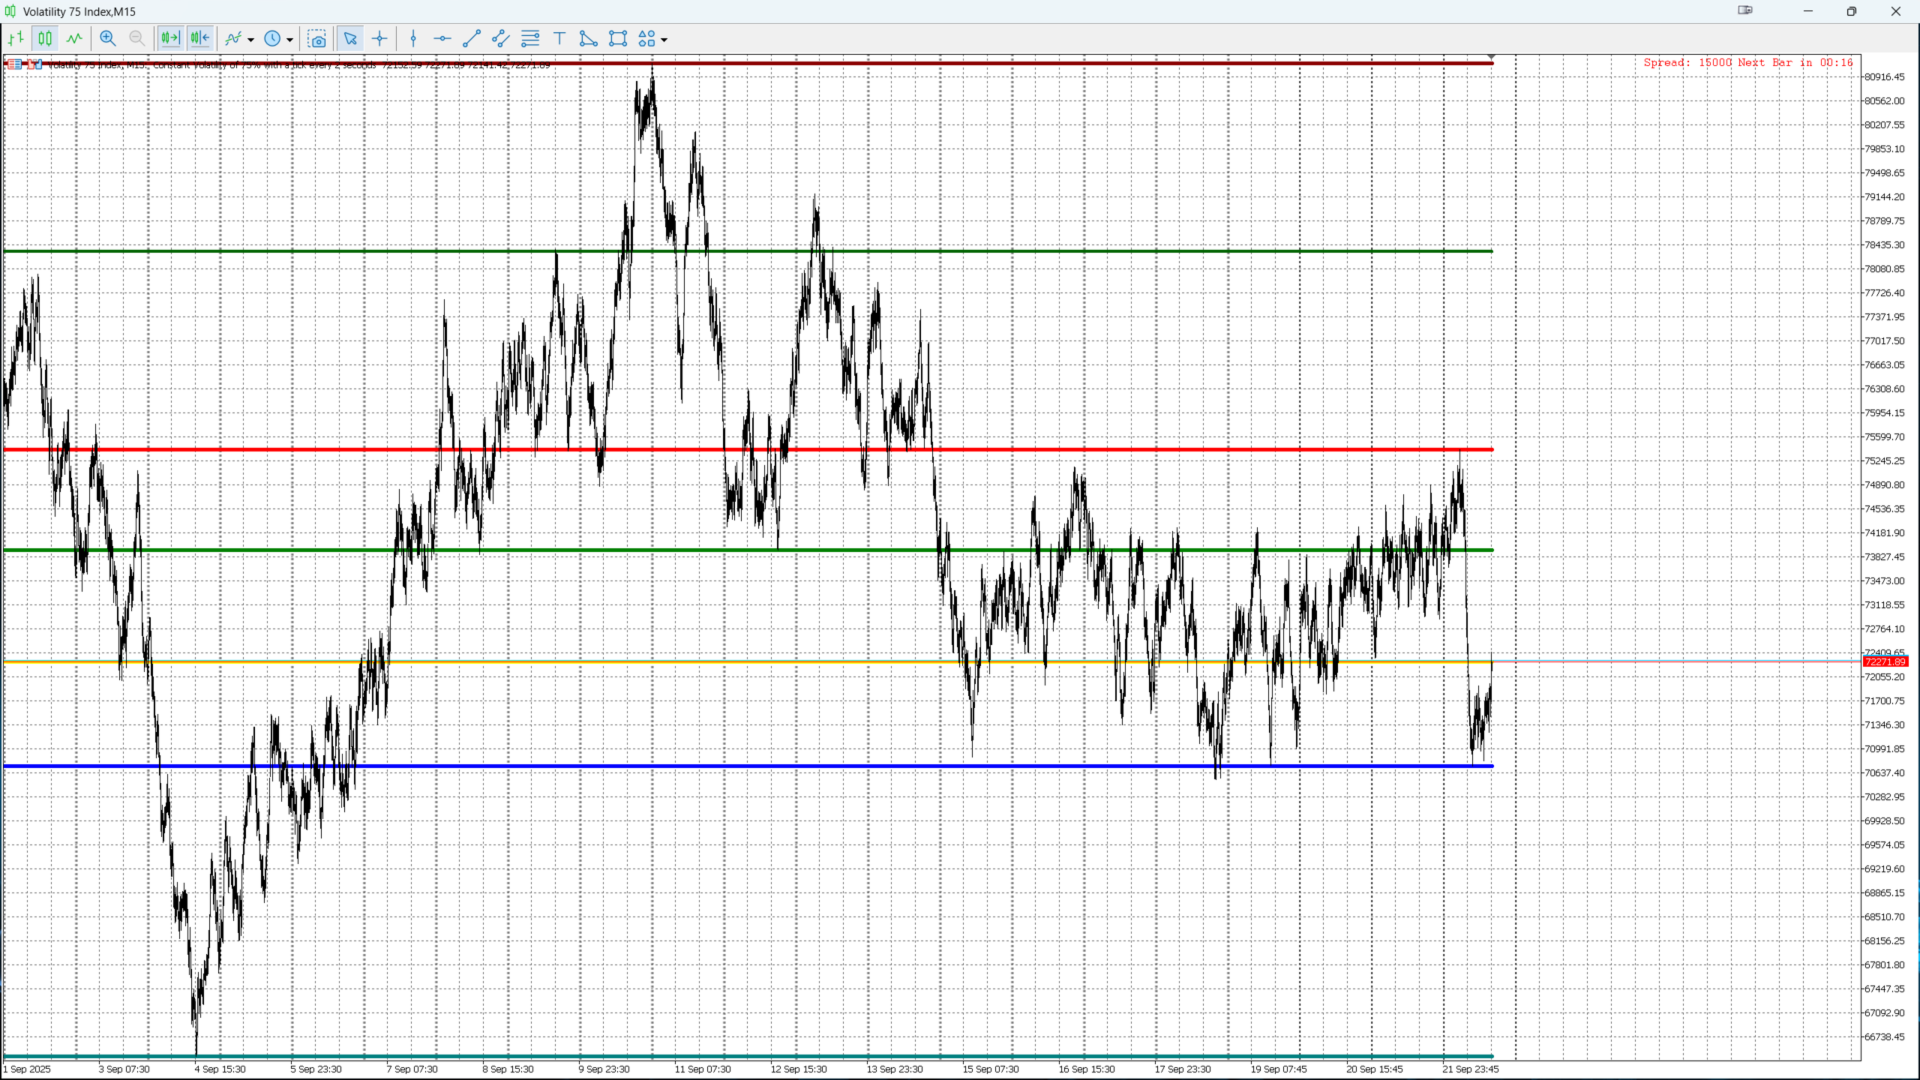
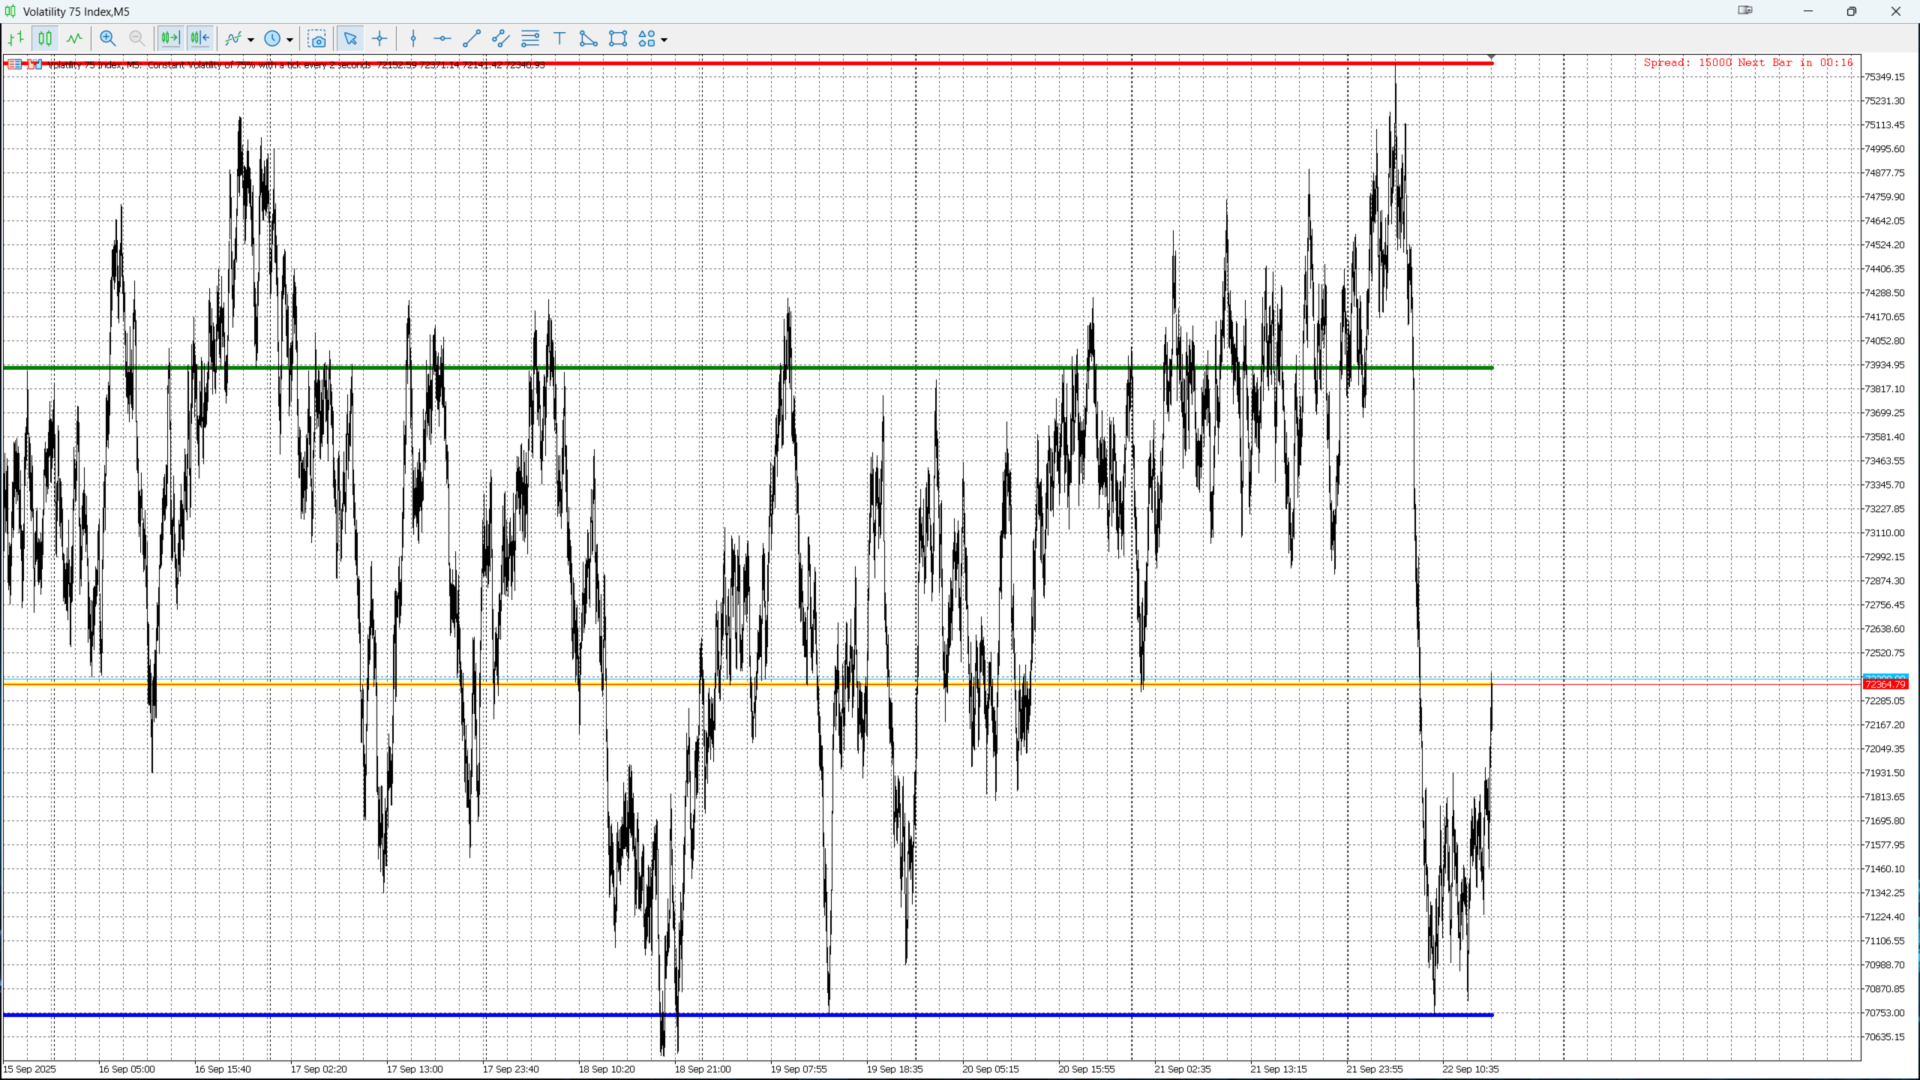
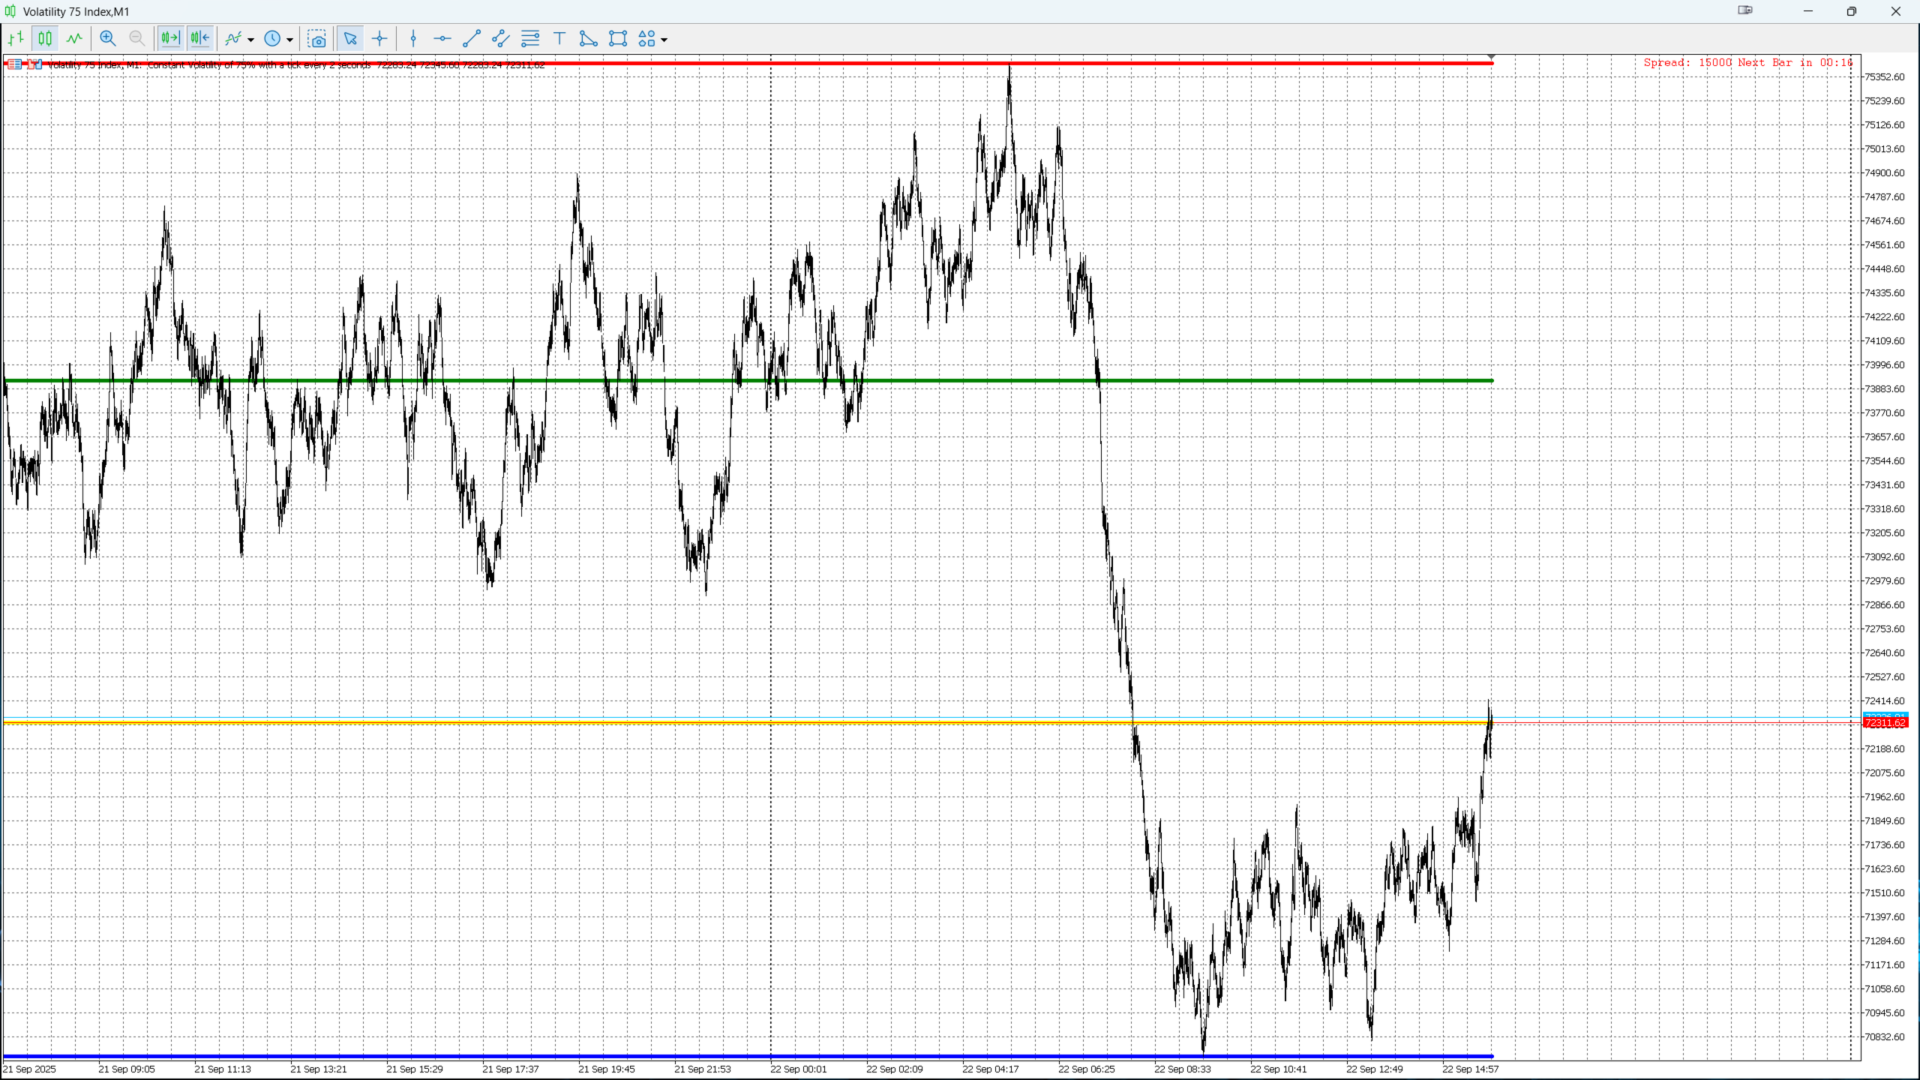
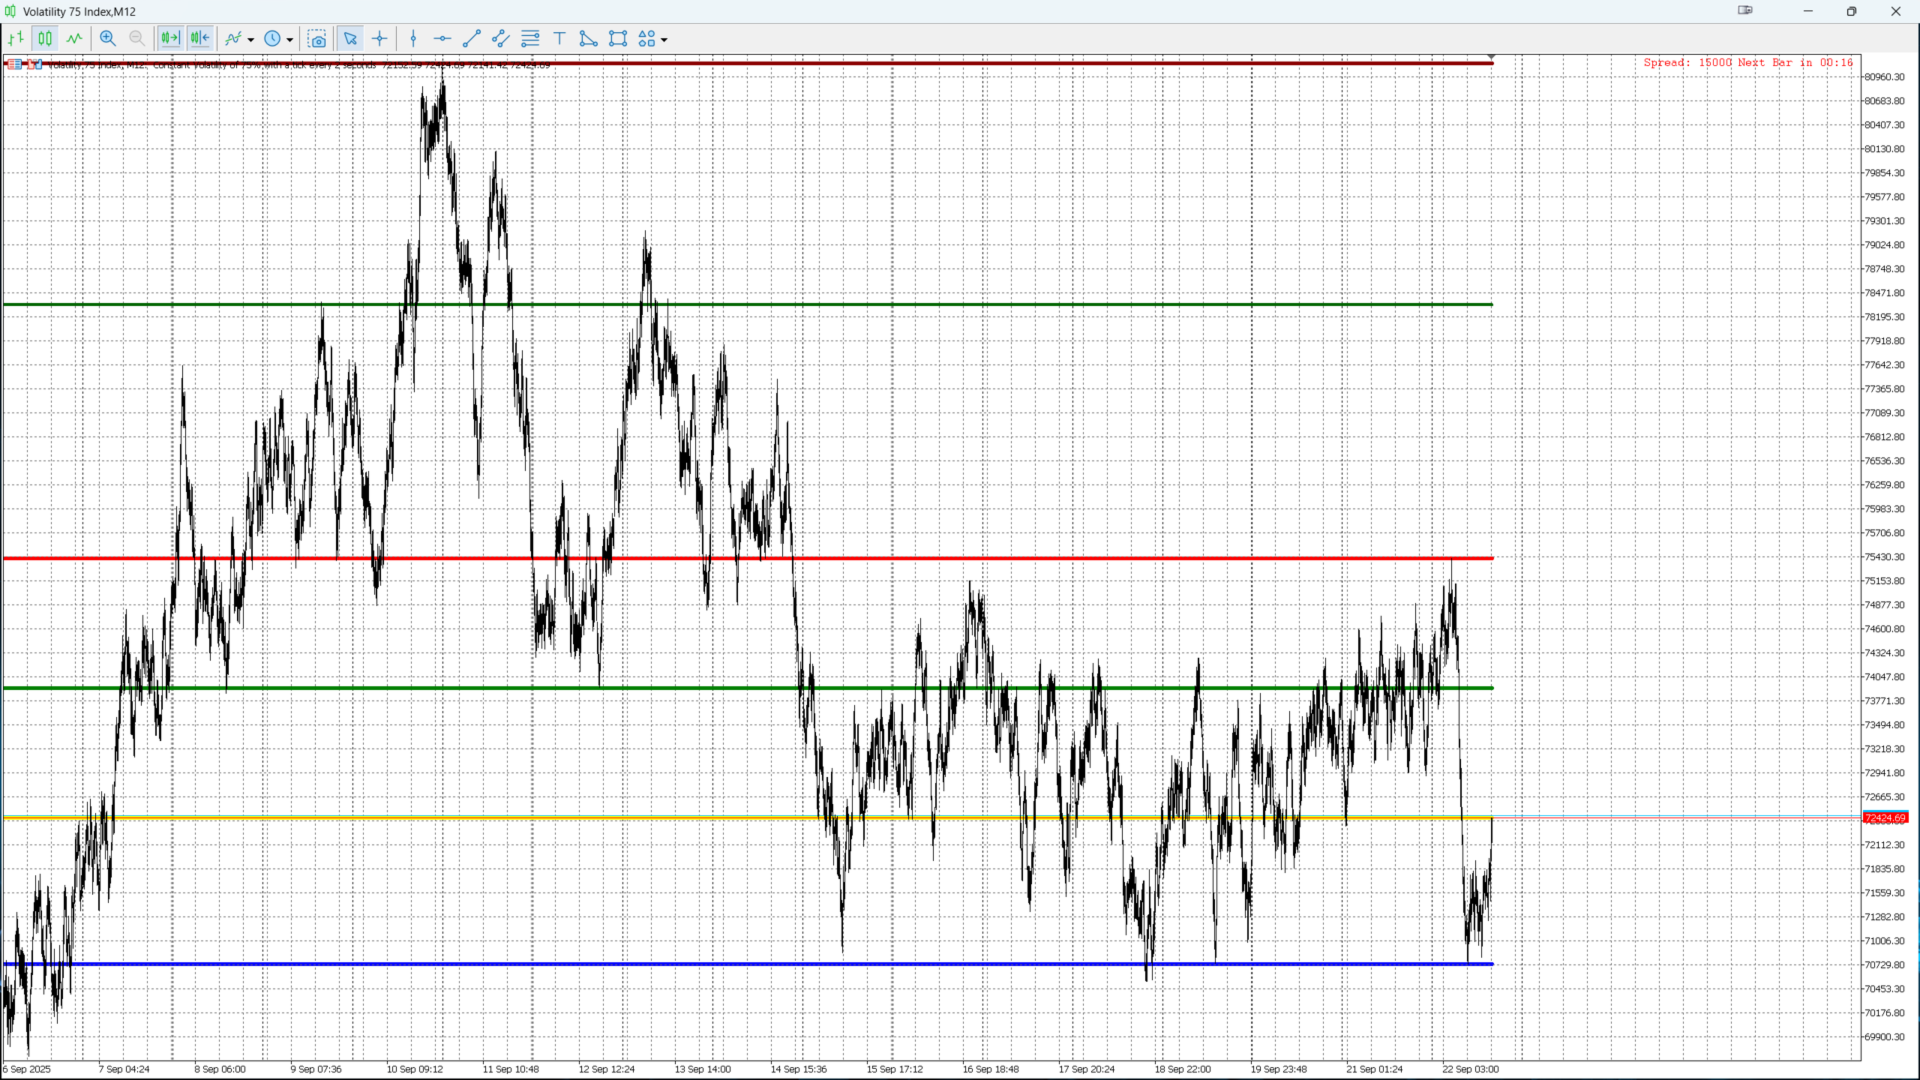
Quarterly Levels Pro, développé par KOUAME N'DA LEMISSA, est un indicateur professionnel pour MetaTrader 5 qui affiche automatiquement les niveaux High, Low, Open et Close d’une période trimestrielle. Il permet aux traders de visualiser clairement les zones clés de support et résistance sur le graphique, facilitant la prise de décision pour les stratégies à moyen terme.

Fonctionnalités principales :

  • Affichage des High, Low, Open et Close trimestriels sur le graphique.

  • Couleurs personnalisées pour chaque niveau :

    • High : Rouge

    • Low : Bleu

    • Open : Vert

    • Close : Orange

  • Largeur des lignes ajustée pour différencier visuellement les niveaux.

  • Possibilité d’afficher les niveaux du trimestre actuel, précédent ou plus ancien grâce au paramètre Quarter_Shift.

  • Compatible avec toutes les paires de devises et instruments financiers disponibles sur MT5.

Paramètres :

Paramètre Description Valeur par défaut
Quarter_Shift Décale l’affichage vers un trimestre antérieur : 0 = actuel, 1 = précédent, etc. 0

Avantages pour le trader :

  • Identification rapide des niveaux trimestriels critiques.

  • Visualisation simplifiée pour prendre des décisions de trading basées sur des niveaux de prix significatifs.

  • Compatible avec toutes les stratégies basées sur le support/résistance ou les zones de consolidation.

Instructions d’installation :

  1. Copier le fichier Quarterly Levels Pro.mq5 dans le dossier :
    MetaTrader 5\MQL5\Indicators

  2. Ouvrir MetaTrader 5 et recompiler l’indicateur dans l’éditeur.

  3. Attacher l’indicateur au graphique désiré depuis le panneau Navigateur → Indicateurs.

  4. Ajuster le paramètre Quarter_Shift si vous souhaitez afficher les niveaux d’un trimestre antérieur.

Support et mises à jour :

Pour toute question ou mise à jour future, contactez KOUAME N'DA LEMISSA via la plateforme MQL5 ou par email fourni lors de l’achat.

Licence :

Produit commercial pour utilisation personnelle. Redistribution interdite sans autorisation de KOUAME N'DA LEMISSA.


Produits recommandés
MercariaPattern1-2-3 відстежує рух ціни, знаходить трьоххвильові структури 1-2-3 та підсвічує момент, коли сценарій підтверджується пробоєм ключового рівня. MercariaPattern1-2-3 tracks price movement, detects three-leg 1-2-3 structures and highlights the moment when the scenario is confirmed by a key level breakout. Індикатор збирає локальні свінги в компактну фігуру 0–1–2–3 , чекає підтвердженого пробою та будує стрілку входу з готовими рівнями SL/TP. The indicator combines local swings into a
STRICTLY FOR BOOM INDEX ONLY!!!!! Here I bring the Maximum Trend Arrows OT1.0 MT5 indicator. This indicator is made up of a combination of different trend indicators for entries and exits, for entries an orange arrow will paint on the chart below the current market and a red flag for closing of trades and it produces buy arrows only. When the orange arrow appears, it will appear along with it's sound to notify you. The 1H timeframe is recommended, don't use it anywhere else than on the 1H timefr
Owl Smart Levels MT5
Sergey Ermolov
4.03 (32)
Version MT4   |  FAQ L' indicateur Owl Smart Levels est un système de trading complet au sein d'un seul indicateur qui comprend des outils d'analyse de marché populaires tels que les fractales avancées de Bill Williams , Valable ZigZag qui construit la structure d'onde correcte du marché et les niveaux de Fibonacci qui marquent les niveaux exacts d'entrée. sur le marché et les endroits où prendre des bénéfices. Description détaillée de la stratégie Mode d'emploi de l'indicateur Conseiller-Assis
Tout d'abord, il convient de souligner que cet outil de trading est un indicateur non repeint, non redessiné et non retardé, ce qui le rend idéal pour le trading professionnel. Cours en ligne, manuel utilisateur et démonstration. L'indicateur Smart Price Action Concepts est un outil très puissant à la fois pour les nouveaux et les traders expérimentés. Il regroupe plus de 20 indicateurs utiles en un seul, combinant des idées de trading avancées telles que l'analyse du trader Inner Circle et le
Stormer RSI 2
Ricardo Rodrigues Lucca
This strategy was learned from Stormer to be used on B3. Basically, 15 minutes before closing the market, it will check RSI and decided if it will open an position. This strategy do not define a stop loss. If the take profit reach the entry price it will close at market the position. The same happens if the maximal number of days is reached. It is created to brazilian people, so all configuration are in portuguese. Sorry Activations allowed have been set to 50.
Gioteen Volatility Index (GVI) - your ultimate solution to overcoming market unpredictability and maximizing trading opportunities. This revolutionary indicator helps you in lowering your losing trades due to choppy market movements. The GVI is designed to measure market volatility, providing you with valuable insights to identify the most favorable trading prospects. Its intuitive interface consists of a dynamic red line representing the volatility index, accompanied by blue line that indicate
Manus Pro
Itumeleng Mohlouwa Kgotso Tladi
MANUS PRO EA The Trading Revolution You've Been Waiting For Are you TIRED of watching other traders make consistent profits while your account bleeds red?   The financial markets don't wait for anyone – and neither should you. MANUS PRO isn't just another Expert Advisor... it's your   TICKET TO FINANCIAL FREEDOM . Why MANUS PRO is Different (And Why Everyone's Talking About It) FOR BEGINNERS: Your Trading Mentor That Never Sleeps Zero Learning Curve   – Install, activate, and watch it wo
Your Trend Friend
Luigi Nunes Labigalini
5 (1)
The trend is your friend! Look at the color of the indicator and trade on that direction. It does not  repaint. After each candle is closed, that's the color of the trend. You can focus on shorter faster trends or major trends, just test what's most suitable for the symbol and timeframe you trade. Simply change the "Length" parameter and the indicator will automatically adapt. You can also change the color, thickness and style of the lines. Download and give it a try! There are big movements w
The new update makes this indicator a complete tool for studying, analyzing and operating probabilistic patterns. It includes: On-chart Multi-asset percentage monitor. Configurable martingales. Twenty-one pre-configured patterns, including Mhi patterns and C3. An advanced pattern editor to store up to 5 custom patterns. Backtest mode to test results with loss reports. Trend filter. Hit operational filter. Martingale Cycles option. Various types of strategies and alerts. Confluence between patter
L'indicateur SMC Venom Model BPR est un outil professionnel pour les traders travaillant dans le concept Smart Money (SMC). Il identifie automatiquement deux modèles clés sur le graphique des prix: FVG   (Fair Value Gap) est une combinaison de trois bougies, dans laquelle il y a un écart entre la première et la troisième bougie. Forme une zone entre les niveaux où il n'y a pas de support de volume, ce qui conduit souvent à une correction des prix. BPR   (Balanced Price Range) est une combinaiso
Manyal trading system, CovEchoTrend Robot, focuses on reliability and flexibility. By employing statistical analysis methods to study the relationships between the base indicator and market patterns, the system enables a deeper understanding of market processes. Intelligent pattern analysis: The application of statistical data processing helps identify key trend reversal points more accurately, signaling significant market shifts. Informed decision-making is based on the intersection of indicato
Introduction to the Manual Backtesting Indicator on MQL5 The MetaTrader platform provides an excellent backtesting tool for evaluating Expert Advisors (EAs). However, when it comes to manually backtesting a strategy to assess its effectiveness, this tool has some limitations: You cannot manually draw zones or trend lines while in backtesting mode. You cannot switch timeframes to check time alignment. For example, if my strategy requires additional confirmation from a higher timeframe (HTF), this
Noize Absorption Index - is the manual trading system that measures the difference of pressure between bears forces and bulls forces. Green line - is a noize free index that showing curent situation. Zero value of index shows totally choppy/flat market.Values above zero level shows how powerfull bullish wave is and values below zero measures bearish forces.Up arrow appears on bearish market when it's ready to reverse, dn arrow appears on weak bullish market, as a result of reverse expectation.
Le niveau Premium est un indicateur unique avec une précision de plus de 80 % des prédictions correctes ! Cet indicateur a été testé par les meilleurs Trading Specialists depuis plus de deux mois ! L'indicateur de l'auteur que vous ne trouverez nulle part ailleurs ! À partir des captures d'écran, vous pouvez constater par vous-même la précision de cet outil ! 1 est idéal pour le trading d'options binaires avec un délai d'expiration de 1 bougie. 2 fonctionne sur toutes les paires de devises
Based on the trading model/strategy/system of gold double-position hedging and arbitrage launched by Goodtrade Brokers, problems encountered in daily operations: 1. Account B immediately places an order immediately following account A. 2: After account A places an order, account B will automatically copy the stop loss and take profit. 3: Account A closes the position of Account B and closes the position at the same time. 4: When account B closes the position, account A also closes the position.
PREngulfing
Slobodan Manovski
PR EA - Système de trading basé sur les motifs Engulfing Détection automatique des chandeliers Engulfing avec confirmation par moyenne mobile Le PR EA est un expert advisor pour MetaTrader 5 qui identifie et trade les motifs Engulfing haussiers/baissiers lorsqu'ils sont confirmés par un filtre de moyenne mobile. Optimisé pour le timeframe M30, compatible avec M15 et H1. Caractéristiques principales : Reconnaissance de motifs - Détecte les formations Engulfing valides Confirmation de tend
Wave Trend MT5
Diego Arribas Lopez
MT4 Version Wave Trend MT5 Wave Trend is an oscillator, which helps identifing in a extremely accurate manner market reversals. The Oscillator being obove the overbought level and a cross down of the fast into the slow MA usually indicates a good SELL signal. If the oscillators is below the oversold level and the fast MA crosses over the slower MA usually highlights a good BUY signal. The Wave Trend indicator can be also used when divergences appear against the price, indicating the current move
# DRAWDOWN INDICATOR V4.0 - L'Outil Essentiel pour Maîtriser Votre Trading ## Transformez Votre Trading avec une Vision Complète de Vos Performances en Temps Réel Dans le monde exigeant du trading Forex et CFD, **connaître vos performances en temps réel** n'est pas un luxe, c'est une **nécessité absolue**. Le **Drawdown Indicator V4.0** est bien plus qu'un simple indicateur : c'est votre **tableau de bord professionnel** qui vous donne une vision claire, précise et instantanée de l'état de vo
##   ONLY GOLD ##   Тiльки Золото ## **Mercaria Professional Trading Zones - Complete Guide** ## **Mercaria Professional Trading Zones - Повний посібник** ### **How Mercaria Zones Work / Як працюють зони Mercaria** **English:** Mercaria Zones is an advanced trading indicator that identifies high-probability support and resistance areas using ZigZag extremes combined with mathematical zone calculations. The indicator works on multiple timeframes simultaneously, providing a comprehensive view
Range Directional Force Indicator – Designed for You to Optimize! The Range Directional Force Indicator is a cutting-edge tool designed to empower traders by visualizing market dynamics and directional strength. Built to offer insights into market trends and reversals, this indicator is an invaluable asset for traders seeking precision in their strategies. However, it is important to note that this indicator is not optimized, leaving room for you to tailor it to your unique trading preferences.
Obtenez l’indicateur AUX GRATUIT, le support EA et le guide complet, veuillez visiter – https://www.mql5.com/en/blogs/post/763955 Repérez la Tendance. Lisez le Motif. Chronométrez l'Entrée. 3 étapes en moins de 30 secondes ! Négociez sans effort — aucune analyse requise, votre assistant intelligent est prêt à simplifier votre flux de travail Fini la surcharge de graphiques. Négociez en toute confiance grâce à la détection intelligente de biais. Compatible avec toutes les devises, crypto-monnai
ROMAN5 Time Breakout Indicator automatically draws the boxes for daily support and resistance breakouts. It helps the user identifying whether to buy or sell. It comes with an alert that will sound whenever a new signal appears. It also features an email facility. Your email address and SMTP Server settings should be specified in the settings window of the "Mailbox" tab in your MetaTrader 5. Blue arrow up = Buy. Red arrow down = Sell. You can use one of my Trailing Stop products that automatical
FREE
Trade smarter, not harder: Empower your trading with Harmonacci Patterns This is arguably the most complete harmonic price formation auto-recognition indicator you can find for the MetaTrader Platform. It detects 19 different patterns, takes fibonacci projections as seriously as you do, displays the Potential Reversal Zone (PRZ) and finds suitable stop-loss and take-profit levels. [ Installation Guide | Update Guide | Troubleshooting | FAQ | All Products ] It detects 19 different harmonic pri
### **Product Title:** **Daily Active Fractals AO - Smart Support & Resistance**  ### **Tagline:** High-probability reversal levels validated by Momentum. Filters false breakouts automatically.   ---   ### **Description: ** Stop cluttering your charts with weak fractals. **Daily Active Fractals AO** is a professional price action tool that identifies the most significant Support and Resistance levels for the current trading day.   Unlike standard indicators, this tool doesn’t just show every
Double HMA MTF for MT5
Pavel Zamoshnikov
4 (4)
This is an advanced multi-timeframe version of the popular Hull Moving Average (HMA) Features Two lines of the Hull indicator of different timeframes on the same chart. The HMA line of the higher timeframe defines the trend, and the HMA line of the current timeframe defines the short-term price movements. A graphical panel with HMA indicator data from all timeframes at the same time . If the HMA switched its direction on any timeframe, the panel displays a question or exclamation mark with a tex
Magic EA MT5
Kyra Nickaline Watson-gordon
Magic EA is an Expert Advisor based on Scalping, Elliot Waves and with filters such as RSI, Stochastic and 3 other strategies managed and decided with the robot smartly. Large number of inputs and settings are tested and optimized and embedded in the program thus inputs are limited and very simple. Using EA doesn't need any professional information or Forex Trading Knowledge. EA can trade on all symbols and all time frames, using special and unique strategies developed by the author. The EA w
Statistical Arbitrage Spread Generator for Cointegration [MT5] What is Pair Trading? Pair trading is a market-neutral strategy that looks to exploit the relative price movement between two correlated assets — instead of betting on the direction of the market. The idea? When two assets that usually move together diverge beyond a statistically significant threshold, one is likely mispriced. You sell the expensive one, buy the cheap one , and profit when they converge again. It’s a statistica
FREE
Bullet indicator x
Dorah Zandile Mahesu
The bullet indicator gives accurate direction of the market structure, it will indicate to you the exact direction whether it be the market is in a downtrend or if it's in an uptrend it will give you that information which will inturn benefits you by saving you the time it takes to analyse that structure, this indicator works on a timeframes and it's most favourable on higher timeframes. How it works: -The green arrow will be at the support of the structure indicating buys -The red arrow will b
New Product Description for MadoCryptoXPro --- MadoCryptoXPro — The Smartest Crypto Warrior ️ Battle-tested on BTC & ETH. Built for real-time chaos. --- MadoCryptoXPro isn’t just another technical bot. It’s a battlefield machine designed to handle the madness of BTCUSD and ETHUSD with surgical precision. Whether the market is flat, trending, or just plain psycho — it stays focused, adapts fast, and protects your capital like a vault guard on Red Bull. --- Core Features: Smart
Ultimate Boom and Crash Indicator The Ultimate Boom and Crash Indicator is a cutting-edge tool developed by  Coetsee Digital , designed to identify potential spike opportunities in the market. Crafted for traders focusing on Deriv and Weltrade synthetic markets, this indicator is optimized to operate exclusively on the 3-minute (M3), 5-minute (M5), 15-minute (M15), 30-minute (M30), and 1-hour (H1) timeframes and supports only the following pairs: PainX 1200, PainX 999, PainX 800, PainX 600, Pai
Les acheteurs de ce produit ont également acheté
AriX
Temirlan Kdyrkhan
1 (4)
AriX Indicator for MT5 A powerful trend-following and signal-evaluation tool AriX is a custom MT5 indicator that combines Moving Averages and ATR-based risk/reward logic to generate clear buy/sell signals. It visualizes dynamic SL/TP levels, evaluates past trade outcomes, and displays win/loss statistics in a clean on-chart panel. Key features include: Buy/Sell signals based on MA crossovers ATR-based SL/TP1/TP2/TP3 levels with visual lines and labels Signal outcome tracking with real-time stat
ARICoins
Temirlan Kdyrkhan
ARICoin is a powerful trading companion designed to generate high-probability entry signals with dynamic TP/SL/DP levels based on volatility. Built-in performance tracking shows win/loss stats, PP1/PP2 hits, and success rates all updated live. Key Features: Buy/Sell signals with adaptive volatility bands Real-time TP/SL/DP levels based on ATR Built-in MA Filter with optional ATR/StdDev volatility Performance stats panel (Success, Profit/Loss, PP1/PP2) Alerts via popup, sound, push, or email Cust
TrendMaestro5
Stefano Frisetti
note: this indicator is for METATRADER4, if you want the version for METATRADER5 this is the link:  https://www.mql5.com/it/market/product/108106 TRENDMAESTRO ver 2.5 TRENDMAESTRO recognizes a new TREND from the start, he never makes mistakes. The certainty of identifying a new TREND is priceless. DESCRIPTION TRENDMAESTRO identifies a new TREND in the bud, this indicator examines the volatility, volumes and momentum to identify the moment in which there is an explosion of one or more of these da
L'indicateur « Dynamic Scalper System MT5 » est conçu pour la méthode de scalping, permettant de trader au sein des vagues de tendance. Testé sur les principales paires de devises et l'or, il est compatible avec d'autres instruments de trading. Fournit des signaux pour l'ouverture de positions à court terme le long de la tendance, avec un support supplémentaire pour les fluctuations de prix. Principe de l'indicateur : De grandes flèches déterminent la direction de la tendance. Un algorithme de
Obtenez l’indicateur AUX GRATUIT et le support EA   Téléchargement direct — Cliquez ici [ D.I.C.E ] The DICE Indicator  Divergence in Chaos Environment est un outil MT5 spécialisé conçu pour les traders appliquant la théorie des vagues d’Elliott dans le cadre des techniques de Trading Chaos. Il identifie les divergences cachées et régulières du prix, synchronisées avec l’environnement de marché chaotique décrit par Bill Williams. Caractéristiques clés Divergence alignée sur les vagues d’Elliott
+++++++++++++++++++++++++++++++++++++++++++++++++++++++++++++++++++++++++++++++++++++++++++++++++ +++ Link to EURUSD Only Free Version -->  https://www.mql5.com/en/market/product/156904?source=Unknown +++++++++++++++++++++++++++++++++++++++++++++++++++++++++++++++++++++++++++++++++++++++++++++++++ Hallo Trader, This is a traditional GANN & FIBONACCI strategy based on detection of an impulsive move in the opposite direction. This is called a Breakout. At the moment of Breakout, the indicator draw
Frontier Pivots
Nestor Jose Mendez Boza
FRONTIER PIVOTS - Geometric Levels Indicator This indicator plots support and resistance levels/ranges on the chart using mathematical calculations. It helps traders identify potential price reaction zones based on geometric patterns. Main Features: Automatically calculates and displays key price levels Plots both support and resistance lines Uses daily price data for level calculation Clean visual presentation with different colors for different level types No repainting - levels remain static
Pantera Indicator
Temirlan Kdyrkhan
5 (1)
A tool for on-chart strategy backtesting and performance analysis. A utility for developing, debugging, and testing custom trading ideas and indicator functions. An indicator designed to quickly test trading concepts and visualize the effectiveness of different input parameters. An all-in-one sandbox for testing everything from simple crossovers to complex, multi-condition trading systems.
Weis Wave with Alert MT5
Trade The Volume Waves Single Member P.C.
4.94 (17)
Rental/Lifetime Package Options and Privileges  Rent Monthly Six Months   Yearly/Lifetime Weis Wave with Speed with Alert+Speed Index x x x Manual  x x x Quick Set up Video x x x Blog x x x Lifetime Updates x x x Setup and Training Material x x Discord Access Channel "The SI traders"          x Rectangle Break Alert Tool      x How to trade with it:    http://www.tradethevolumewaves.com   ** If you purchase please contact me to setup your  : Training Room and  complete manual access.  Wei
Hello I Want to introduce The Forex Buy Sell Arrow Premium MT5 i recently release this premium indicator! its 1000% Non Repaint Indicator, It Work Perfectly Well,, i tested it day by day, Just mind blowing Result,  Including Powerful trend Algorithm! How It Work? well, it work market trend formula, when trend Bullish Or when trend Bearish,  Recommend Timeframe M30, H1 it work all timeframe, and all currency pair, 100% non repaint, How to take signal From Forex Buy Sell Arrow Premium Ind
Big Player Range
Thalles Nascimento De Carvalho
5 (3)
BigPlayerRange – Meilleur indicateur pour MT5 BigPlayerRange est considéré comme le meilleur indicateur pour le Mini Indice et le Mini Dollar sur MetaTrader 5. Cet outil met en évidence les zones stratégiques d’action des gros acteurs du marché, offrant une analyse technique institutionnelle d’une grande précision. Comment utiliser BigPlayerRange : Cet indicateur trace des zones d’achat (ligne verte) et de vente (ligne rouge). Lorsque le prix clôture en dehors de ces zones, une tendance
Enigma 112
issam rahhal sabour
دليل استخدام مؤشر Enigma 112 مؤشر Enigma 112 دليل الاستخدام الكامل - الحل الأمثل للتداول المقدمة مؤشر Enigma 112 هو أداة تحليل فني شاملة تجمع بين مفاهيم متقدمة تشمل بوابات Tesla 3-6-9، نظرية Huddleston، نطاقات PO3، وأنظمة متطورة لإدارة المخاطر. بوابات Tesla 3-6-9 تعتمد على رياضيات دوامة نيكولا تسلا لتحديد مستويات الدعم والمقاومة بدقة نظرية Huddleston تحليل هيكل السوق بناءً على الحجم لتحديد المستويات المؤسسية نطاقات PO3 كشف التذبذب السعري والمستويات المؤسسية لدخول دقيق دليل
VTrende Pro
Andrii Diachenko
5 (1)
VTrende Pro - MTF indicator for trend trading with a display panel for MT5 *** Videos can be translated into any language using subtitles (video language - Russian) Although the signals of the VTrende Pro indicator can be used as signals of a full-fledged trading system, it is recommended to use them in conjunction with the Bill Williams TS. VTrende Pro is an extended version of the VTrende indicator. Difference between Pro version and VTrende: - Time zones - Signal V - signal 1-2 waves -    S
L’indicateur analyse le volume à partir de n’importe quel point et calcule les niveaux d’épuisement du marché pour ce volume. Lignes principales de Meravith : Ligne d’épuisement du volume haussier – sert d’objectif. Ligne d’épuisement du volume baissier – sert d’objectif. Ligne de tendance – indique la tendance du marché. Sa couleur change selon que le marché est haussier ou baissier et elle sert de support de tendance. Comment l’utiliser : double-cliquez sur la ligne verticale violette et dépla
ChartMaster Heikin Ashi with Pivot Indicator for MT5 Take your trading to the next level with ChartMaster Heikin Ashi with Pivot Indicator , a powerful tool that combines the clarity of Heikin Ashi candles with advanced pivot-point analysis. This indicator is designed for traders who want to identify market trends, reversals, and key support/resistance zones with precision. Key Features: Heikin Ashi Visualization – Smooths out market noise for cleaner trend identification. Automatic Pivot
The Second-Level Tick Candlestick Generator is a professional-grade MT5 indicator tool specifically designed for high-frequency trading and short-term scalping. It can convert raw tick data into highly customizable second-level candlestick charts in real-time, helping traders accurately capture micro-market fluctuations and optimize entry and exit timing. This tool provides clear chart displays, allowing you to more intuitively identify price action patterns and improve trading decision efficien
XCalper TFO
Aecio de Feo Flora Neto
This oscillator was developed exclusively by xCalper in 2015 based on moving averages calculations to indicate and try predicting oversold and overbought levels. The fast line (white, by default) oscillates basically between values -0.5 (oversold) and +0.5 (overbought). Whenever this line crosses upward value -0.5, it means an oversold price level. When it crosses downward value +0.5, it means an overbought price level. When fast line crosses value 0.0 and returns, it is a strong pull-back indic
The Expert Advisor and the video are attached in the Discussion tab . The robot applies only one order and strictly follows the signals to evaluate the indicator efficiency. Pan PrizMA CD Phase is an option based on the Pan PrizMA indicator. Details (in Russian). Averaging by a quadric-quartic polynomial increases the smoothness of lines, adds momentum and rhythm. Extrapolation by the sinusoid function near a constant allows adjusting the delay or lead of signals. The value of the phase - wave s
Классификатор силы тренда. Показания на истории не меняет. Изменяется классификация только незакрытого бара. По идее подобен полной системе ASCTrend, сигнальный модуль которой, точнее его аппроксимация в несколько "урезанном" виде, есть в свободном доступе, а также в терминале как сигнальный индикатор SilverTrend . Точной копией системы ASCTrend не является. Работает на всех инструментах и всех временных диапазонах. Индикатор использует несколько некоррелируемых между собой алгоритмов для класси
FFx Universal Strength Meter PRO is more than a basic strength meter. Instead of limiting the calculation to price, it can be based on any of the 19 integrated strength modes + 9 timeframes. With the FFx USM, you are able to define any period for any combination of timeframes. For example, you can set the dashboard for the last 10 candles for M15-H1-H4… Full flexibility! Very easy to interpret... It gives a great idea about which currency is weak and which is strong, so you can find the best pai
The FFx Universal MTF alerter shows on a single chart all the timeframes (M1 to Monthly) with their own status for the chosen indicator. 9 indicators mode (MACD-RSI-Stochastic-MA-ADX-Ichimoku-Candles-CCI-PSAR). Each can be applied multiple times on the same chart with different settings. Very easy to interpret. Confirm your BUY entries when most of the timeframes are showing green color. And confirm your SELL entries when most of the timeframes are showing red color. 2 Alert Options : input to s
The FFx Watcher PRO is a dashboard displaying on a single chart the current direction of up to 15 standard indicators and up to 21 timeframes. It has 2 different modes: Watcher mode: Multi Indicators User is able to select up to 15 indicators to be displayed User is able to select up to 21 timeframes to be displayed Watcher mode: Multi Pairs User is able to select any number of pairs/symbols User is able to select up to 21 timeframes to be displayed This mode uses one of the standard indicators
FFx Patterns Alerter gives trade suggestions with Entry, Target 1, Target 2 and StopLoss .... for any of the selected patterns (PinBar, Engulfing, InsideBar, OutsideBar) Below are the different options available: Multiple instances can be applied on the same chart to monitor different patterns Entry suggestion - pips to be added over the break for the entry 3 different options to calculate the SL - by pips, by ATR multiplier or at the pattern High/Low 3 different options to calculate the 2 TPs -
MetaTrader 4 version available here : https://www.mql5.com/en/market/product/24881 FFx Basket Scanner is a global tool scanning all pairs and all timeframes over up to five indicators among the 16 available. You will clearly see which currencies to avoid trading and which ones to focus on. Once a currency goes into an extreme zone (e.g. 20/80%), you can trade the whole basket with great confidence. Another way to use it is to look at two currencies (weak vs strong) to find the best single pairs
Currency Index Watcher is a simple and user-friendly tool for whoever wish to trade Forex using currencies indexes. Currency Index Watcher is configurable and usable directly from the panel. Indexes of 8 custom currencies EUR, USD, GBP, JPY, CHF, AUD, CAD, NZD (default) Any 3-chars symbol from your market watch could be used (BTC = bitcoin, RUB = ruble, CNH = yuan etc ...) : double click the symbol label  Ability to select which currencies and made-of pairs will be analyzed : check/uncheck wante
MetaTrader 4 version available here: https://www.mql5.com/en/market/product/25793 FFx Pivot SR Suite PRO is a complete suite for support and resistance levels. Support and Resistance are the most used levels in all kinds of trading. Can be used to find reversal trend, to set targets and stop, etc. The indicator is fully flexible directly from the chart 4 periods to choose for the calculation: 4Hours, Daily, Weekly and Monthly 4 formulas to choose for the calculation: Classic, Camarilla, Fibonac
Forex Relative Performance indicator This indicator calculates the relative strength of major currencies against the US dollar. The basic idea behind this indicator is "to buy strong currency and to sell weak currency". This indicator allows you to quickly identify the best forex pair to trade according to your trading style (Intraday, Scalping, Swing, or Long Term)
Pendiente de Precio
Cesar Juan Flores Navarro
Indicador en base a la pendiente de la linea de precio, dibuja una línea de color cuando sube a base de los precios que previamente has sido procesados o linealizados, y cuando baja la pendiente la linea linealizada toma otro color. En este caso se a considerado 6 lineas de diferentes procesos desde pendientes largas hacia las cortas, observándose que cuando coincidan las pendientes se produce un máximo o mínimo, lo que a simple vista nos permitirá hacer una COMPRA O VENTA.
WanaScalper
Isaac Wanasolo
1 (1)
A scalping indicator based on mathematical patterns, which on average gives signals with relatively small SL, and also occasionally helps to catch big moves in the markets (more information in the video) This indicator has three main types of notifications: The first type warns of a possible/upcoming signal on the next bar The second type indicates the presence of a ready signal to enter the market/open a position The third type is for SL and TP levels - you will be notified every time price re
Индикатор Coefficient Of Determination (COD) представляет собой значение коэффициента детерминации или квадрат коэффициента корреляции между зависимой переменной — ценой и объясняющей переменной — тиковым объемом. Что это дает нам на практике? COD отлично распознает кульминацию трендовых движений, что позволяет подбирать оптимальные точки и ловить развороты рынка. Как использовать индикатор: Наиболее популярная торговая стратегия строится совместно с трендовым индикатором Moving Average (MA), пе
Plus de l'auteur
Canal H Pro
N'da Lemissa Kouame
Français – Canal H Pro Nom : Canal H Pro – Support, Résistance & Breakout Description courte : Indicateur premium affichant trois lignes dynamiques (haute, basse, médiane) . Idéal pour Breakout, Range et suivi de tendance. Description complète : Rouge (Haute) → résistance dynamique Bleue (Basse) → support dynamique Jaune (Médiane) → équilibre et filtre de tendance Période et couleurs personnalisables Compatible toutes stratégies et unités de temps Canal H Pro – repérez les zones clés et prenez
NuageTrend Pro
N'da Lemissa Kouame
Nuage Trend Pro – Suivi de Tendance & Signaux Kijun Nuage Trend Pro est un indicateur avancé pour MetaTrader 5 , conçu pour détecter les tendances fortes et les points d’entrée optimaux grâce au croisement de la Kijun . Il transforme vos graphiques en cartes visuelles instantanées pour trader avec précision et confiance. Fonctionnalités principales Croisement de Kijun automatique : repère immédiatement les moments clés où le prix franchit la ligne de base. Nuage de tendance dynamique : col
Weekly Levels Pro
N'da Lemissa Kouame
Description – Weekly Levels Pro Weekly Levels Pro – Niveaux Clés Hebdomadaires est un indicateur simple et efficace pour MetaTrader 5, conçu pour afficher automatiquement les quatre niveaux les plus importants de chaque semaine de trading : Plus haut de la semaine (Weekly High) → zone de résistance naturelle Plus bas de la semaine (Weekly Low) → zone de support naturel Prix d’ouverture de la semaine (Weekly Open) → point de référence de tendance Prix de clôture de la semaine (Weekly Close) →
Pin Bar Pro v1
N'da Lemissa Kouame
Pin Bar Pro v1.0 – Indicateur MQL5 Description générale Pin Bar Pro est un indicateur professionnel pour MetaTrader 5 qui détecte automatiquement les Pin Bars , une formation de bougie japonaise cruciale pour anticiper les retournements du marché. Grâce à cet indicateur, les traders peuvent identifier rapidement les points d’entrée potentiels en achat ou en vente sans avoir à analyser manuellement chaque bougie. Les signaux sont affichés directement sur le graphique sous forme de flèches clair
Monthly Levels Pro
N'da Lemissa Kouame
Monthly Levels Pro v1.0 – L’indicateur ultime des niveaux mensuels du marché Maîtrisez les niveaux clés du marché en un coup d’œil Monthly Levels Pro est l’outil indispensable pour tous les traders souhaitant analyser les tendances à long terme et repérer rapidement les zones clés de support et de résistance . Cet indicateur affiche les niveaux High (Haut), Low (Bas), Open (Ouverture) et Close (Fermeture) d’une bougie mensuelle, révélant instantanément les zones où le prix est susceptible de ré
Indicateur Monthly Levels + Pin Bar Pro Description L’indicateur Monthly Levels + Pin Bar Pro combine la puissance des niveaux clés mensuels (High, Low, Open, Close) avec la détection automatique des figures de retournement Price Action (Pin Bars) . Conçu pour les traders techniques et institutionnels, il permet d’anticiper les zones de réaction du marché et de générer des signaux visuels clairs directement sur le graphique. Fonctionnalités principales Niveaux mensuels automatiques :
Yearly Levels Pro
N'da Lemissa Kouame
Yearly Levels Pro v1.0 – Indicateur annuel de support et résistance Version : 1.0 Développeur : KOUAME N'DA LEMISSA Plateforme : MetaTrader 5 (MT5) Type : Indicateur technique / Zones de prix annuelles Description générale Yearly Levels Pro v1.0 , développé par KOUAME N'DA LEMISSA , est un indicateur puissant qui permet aux traders d’identifier rapidement les niveaux clés annuels du marché. Il calcule automatiquement les prix Open, High, Low et Close d’une année spécifique et les affiche directe
Notice Commerciale – MQL5 Market Multi-Timeframe Levels Pro v1.0 Développeur : KOUAME N’DA LEMISSA Description Multi-Timeframe Levels Pro v1.0 est un indicateur puissant qui trace automatiquement les niveaux clés Daily, Monthly, Quarterly et Yearly (High, Low, Open, Close) directement sur votre graphique. Ces niveaux historiques sont utilisés par les traders professionnels pour identifier : Les zones de support et résistance majeures Les points de retournement probables Les zones de breakout
Marubozu Pro MT5
N'da Lemissa Kouame
Notice Commerciale – Marubozu Pro (MT5) Description Marubozu Pro est un indicateur professionnel pour MetaTrader 5 qui détecte automatiquement les bougies Marubozu (haussières et baissières) directement sur votre graphique. Il vous aide à identifier les zones de force du marché, là où les acheteurs ou les vendeurs prennent totalement le contrôle, en affichant des flèches visuelles d’achat et de vente. Cet outil est conçu pour être simple, efficace et rapide , idéal pour le trading manuel ou c
ETE Detector – Head & Shoulders Indicator Transformez vos graphiques en opportunités de trading claires et visuelles ! À propos de l’indicateur L’indicateur ETE Detector détecte automatiquement les figures Épaule-Tête-Épaule (ETE) et ETE inversées (ETEi) , les configurations classiques de retournement de tendance. Fini les heures passées à chercher manuellement les figures : votre analyse devient rapide, précise et visuelle . Ce que vous obtenez Détection automatique des figures de retourn
Fusion Monthly Levels + PinBar + Marubozu Description Cet indicateur unique combine trois outils puissants de l’analyse technique en un seul : Niveaux mensuels (High, Low, Open, Close) – pour repérer les zones clés de support et de résistance. Détection des PinBars – figure de retournement fiable signalant des rejets de prix. Détection des Marubozu – bougies de tendance fortes indiquant un momentum directionnel. Grâce à cette fusion, vous obtenez un outil visuel, complet et réactif pour an
ABCD Lemissa + Monthly Levels + PinBar + Marubozu Indicator Description Cet indicateur fusionne plusieurs outils puissants pour fournir une vision complète du marché : ABCD Lemissa – Détecte automatiquement les structures ABCD avec points A, B, C et D , zones de support/résistance, et flèches d’achat/vente. Monthly Levels – Affiche les niveaux High, Low, Open, Close des bougies mensuelles pour repérer les zones clés. PinBar & Marubozu – Détecte les bougies PinBar (signaux d’inversion) et Maru
Order Block Pro (MQL5) – Version 1.0 Auteur : KOUAME N'DA LEMISSA Plateforme : MetaTrader 5 Description : Order Block Pro est un indicateur avancé conçu pour détecter automatiquement les Order Blocks haussiers et baissiers sur votre graphique. Grâce à une analyse précise des bougies de consolidation et des bougies suivantes de forte impulsion, cet indicateur vous permet d’identifier les zones clés où les mouvements de prix sont susceptibles de s’accélérer. Cet outil est parfait pour les traders
ETE Detector v4.0 (Head & Shoulders) Auteur : KOUAME N’DA LEMISSA Version : 4.0 Plateforme : MetaTrader 5 Type d’indicateur : Graphique / Signaux de trading visuels Description générale L’ ETE Detector v4.0 est un indicateur technique conçu pour identifier automatiquement les figures chartistes “Épaule-Tête-Épaule” (ETE) classiques et inversées sur les graphiques MT5. Ces motifs sont largement utilisés pour anticiper les retournements de tendance. Grâce à cet outil, les traders peuvent : Détecte
DÉTECTEUR DE PUISSANCE ETE v5.0 (Head & Shoulders Pro) Détection Automatique des Figures "Tête et Épaules" L'indicateur ETE DETECTOR POWER v5.0 est un outil professionnel conçu pour les traders qui souhaitent anticiper les retours majeurs du marché grâce à l'une des figures chartistes les plus puissantes : la Tête et Épaules (ETE) et sa variante inversée. Grâce à son système optimisé et intelligent de gestion d'objets (MaxObjects) , l'indicateur reste fluide et lisible, même sur des graphiqu
Dynamique mensuelle des plages hautes et basses v1.0 Auteur : KOUAME N'DA LEMISSA Description : L'indicateur Monthly High & Low Range Dynamique affiche les niveaux clés d'un mois sur votre graphique, avec des fonctionnalités avancées de suivi dynamique. Il permet de visualiser facilement les zones de support et de résistance mensuelles, ainsi que les zones où le prix tend à dépasser ou à tester ces niveaux, offrant ainsi des opportunités de trading précis. Fonctions principales : Mensu
Monthly High & Low Range Dynamique + Liquidity Zones v1.2 Auteur : KOUAME N'DA LEMISSA Description : Transformez votre analyse du marché avec cet indicateur puissant qui combine : Niveaux Mensuels Clés : High, Low, Open et Close pour identifier les zones de support et résistance les plus importantes. High/Low Range Dynamique : Suivi automatique des variations extrêmes pour détecter les mouvements de prix significatifs. Zones de Liquidité : Rectangles visuels indiquant les zones où les liquidités
Booster Trading Pro Auteur : KOUAME N'DA LEMISSA Plateforme : MetaTrader 5 Type : Indicateur technique multifonction Description Transformez votre analyse de marché avec Booster Trading Pro , l'indicateur tout-en-un qui combine plusieurs outils essentiels pour les traders : Niveaux mensuels clés : haut, bas, ouverture et clôture pour identifier rapidement les zones de support et de résistance. Plage dynamique haute et basse : suivez les mouvements extrêmes des prix au-dessus ou en dessous des
StructureBlocksAuto + MensuelOU Puissance structurelle + précision mensuelle Description Fusion StructureBlocksAuto + MonthlyOR est un indicateur avancé tout-en-un combinant la lecture structurelle du marché (Swing High/Low + blocs automatiques) et la plage d'ouverture mensuelle (Monthly Open Range) . Il permet d'analyser les zones de support/résistance dynamiques , les structures de tendance , et les niveaux clés mensuels , pour une lecture claire du marché et des points d'entrée précis. C
Channel Ultima
N'da Lemissa Kouame
Channel Ultima – Indicateur Multi-Canal Dynamique   Description courte Channel Ultima   est un indicateur avancé qui trace automatiquement   trois canaux dynamiques   du marché. Il offre une   lecture claire des zones de support, de résistance et d'équilibre   , idéale pour les traders techniques et structurels.   Présentation détaillée Channel Ultima   détecte et affiche   trois canaux indépendants   associés sur les pivots majeurs et mineurs du marché. Chaque canal représente une   zon
Carte de liquidité institutionnelle Pro Découvrez où les grandes institutions déclenchent leurs mouvements majeurs Présentation Institutional Liquidity Map Pro est un indicateur professionnel conçu pour cartographier les zones de liquidité institutionnelle à partir des hauts et bas mensuels . Il identifie automatiquement les zones de chasse aux stop-loss , les points de retour probables et les zones d'accumulation/distribution utilisées par les grandes institutions. Grâce à un système de dé
Filtrer:
Aucun avis
Répondre à l'avis