Pan PrizMA CD Phase
- Indicateurs
-
Aleksey Panfilov
 .
.
Hello there!
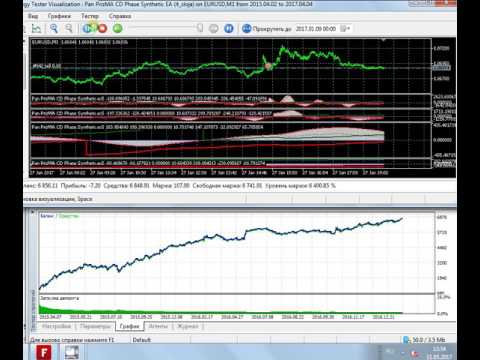
I propose to try and assess the indicators constructed on the basis of recursive calculation. Mathematical basis here: http://dxdy.ru/post1247421.html#p1247421 - Version: 1.4
- Mise à jour: 3 avril 2020
- Activations: 20
The Expert Advisor and the video are attached in the Discussion tab. The robot applies only one order and strictly follows the signals to evaluate the indicator efficiency. Pan PrizMA CD Phase is an option based on the Pan PrizMA indicator. Details (in Russian).
- Averaging by a quadric-quartic polynomial increases the smoothness of lines, adds momentum and rhythm.
- Extrapolation by the sinusoid function near a constant allows adjusting the delay or lead of signals.
- The value of the phase - wave status parameter (which is close in meaning to the trigonometric phase or the angle of the radius-vector rotation in the trigonometric plane) allows digitizing each line point and use any necessary point as a trading signal in the EA. This, in turn, accelerates optimization of strategies.
- Digitization allows you to set asymmetric permission/prohibition intervals during filtering. For instance, the interval prohibiting trading against a trend may comprise 90 degrees starting from any phase, only a quarter of the entire wave period.
- Using synthetic bars by volume, price or their combination allows adjusting the chart scale for the strategy.
External variables
- Line_1_power - degree of polynomial averaging the first line (2-4).
- Fast_line_1_leverage - leverage (an analog of period) of a short average line smoothed by a polynomial.
- Fast_line_2_leverage - leverage of a short line extrapolated by the sinusoid near a constant.
- Base - half of the SMA period subtracted from the price. Analog of a Slow_SMA. The value of 0 excludes subtraction from the price.
- Synthetic_Channel - value of the synthetic bar defined as the sum of price points and the amount of ten millionths of the actual volume. The value of 0 disables synthetic bars.
- Weight_Prices - price multiplier. It allows changing the price value weight in the sum. The parameter can be negative.
- Weight_Volume - multiplier for the volume parts. It allows changing the volume value weight in the sum. The parameter can be negative.
- Multiplikator - histogram multiplier.
- Multiplikator_2 - price multiplier. -1 swaps the top and bottom lines.
- Signal SMA Period - signal line period.
Indicator lines
- "MACD_A0" - histogram. Plotted as the first difference on the extrapolated line. Read from the array 0.
- "Signal_A1" - histogram signal line. Read from the array 1.
- "Fast_line_1" - line averaged by the polynomial. Read from the array 2.
- "Fast_line_2" - extrapolated line. Read from the array 3.
- "Phase_A4" - phase line. Read from the array 4.
-
"-_Phase_A5" - shifted phase line drawn below 0. It allows visualizing the first line on the bends. Read from the array 5.
-
"+-2_Phase_A6" - dotted line provided by the MathArccos function coverted from radians to degrees and multiplied by 2 to exclude coincidences with the phase lines. Read from the array 6.
Note: The EA only illustrates applying the indicator and allows you to evaluate the efficiency of its signals. Adjust the robot to your own strategy and safety margin preferences before using it in real trading.