ABCD Lemissa Monthly PinBar Marubozu Indicator

ABCD Lemissa + Monthly Levels + PinBar + Marubozu Indicator

📝 Description

Cet indicateur fusionne plusieurs outils puissants pour fournir une vision complète du marché :

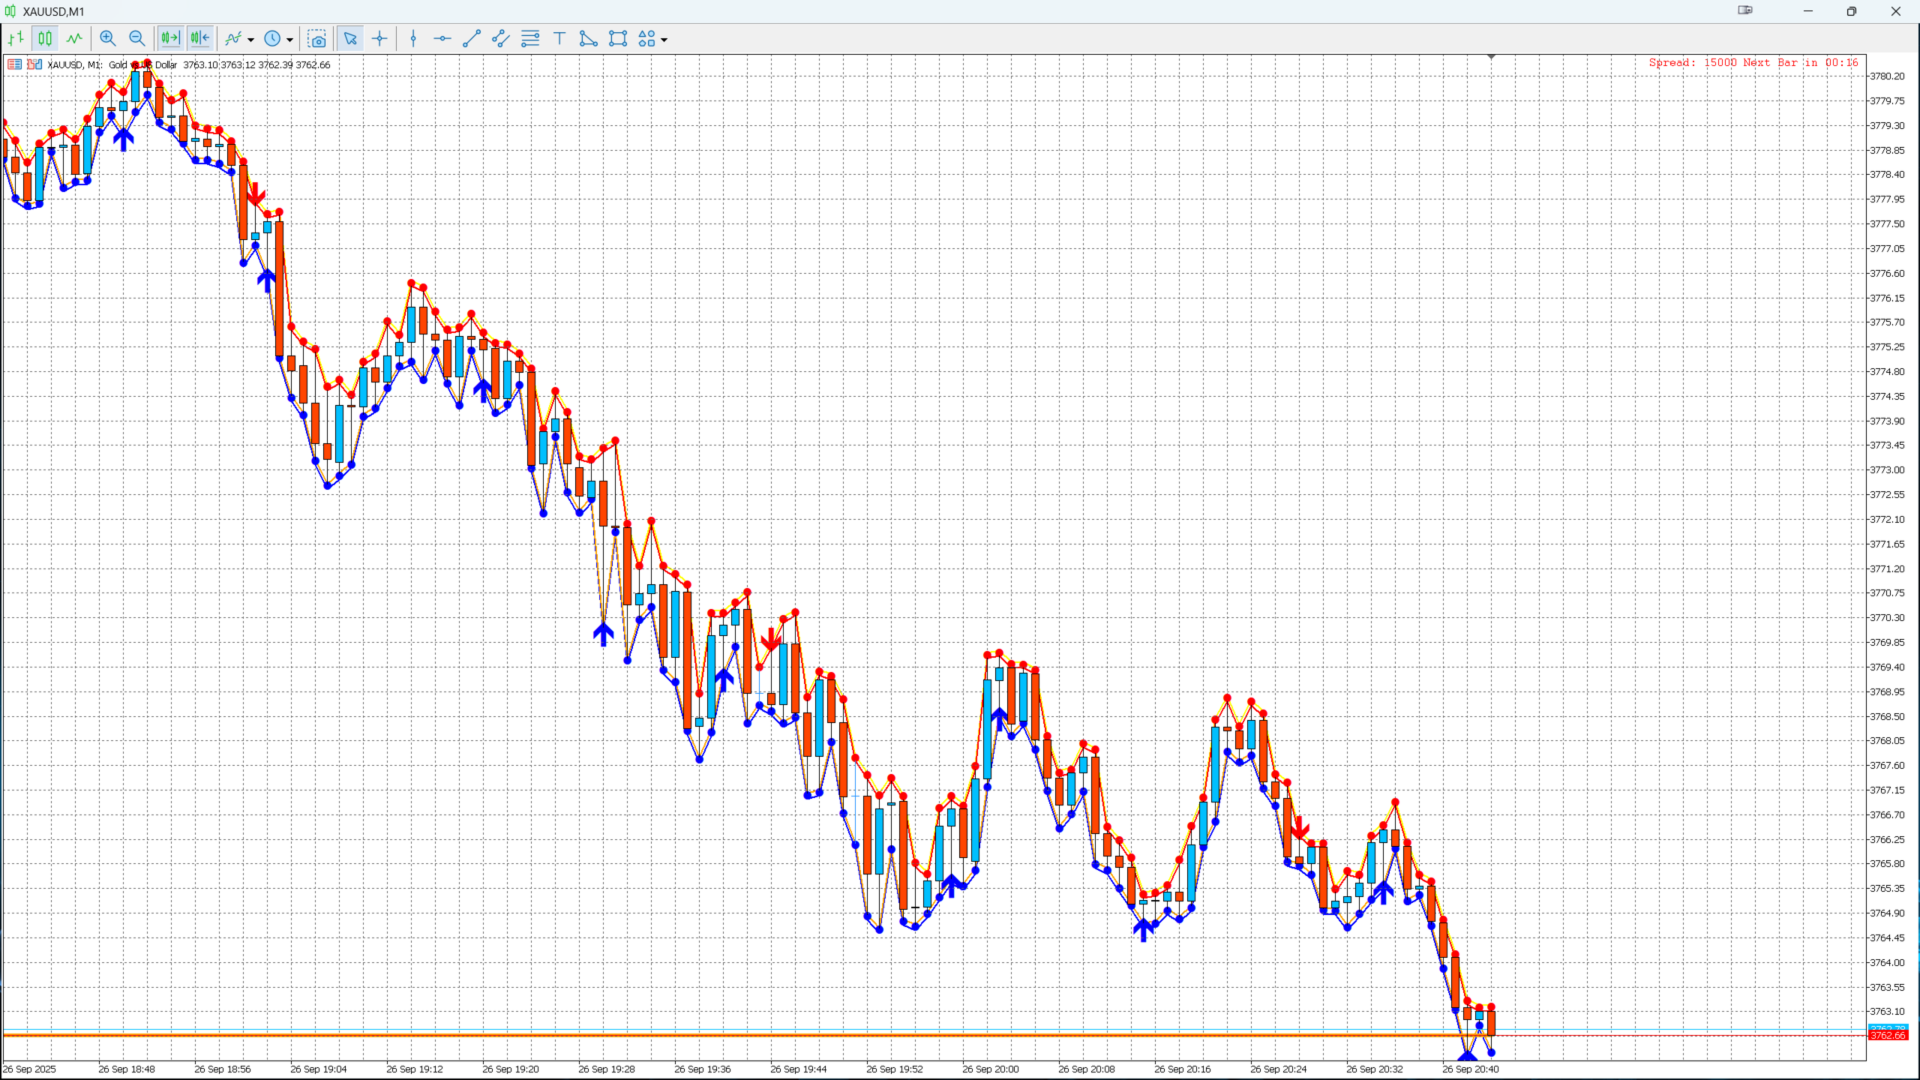
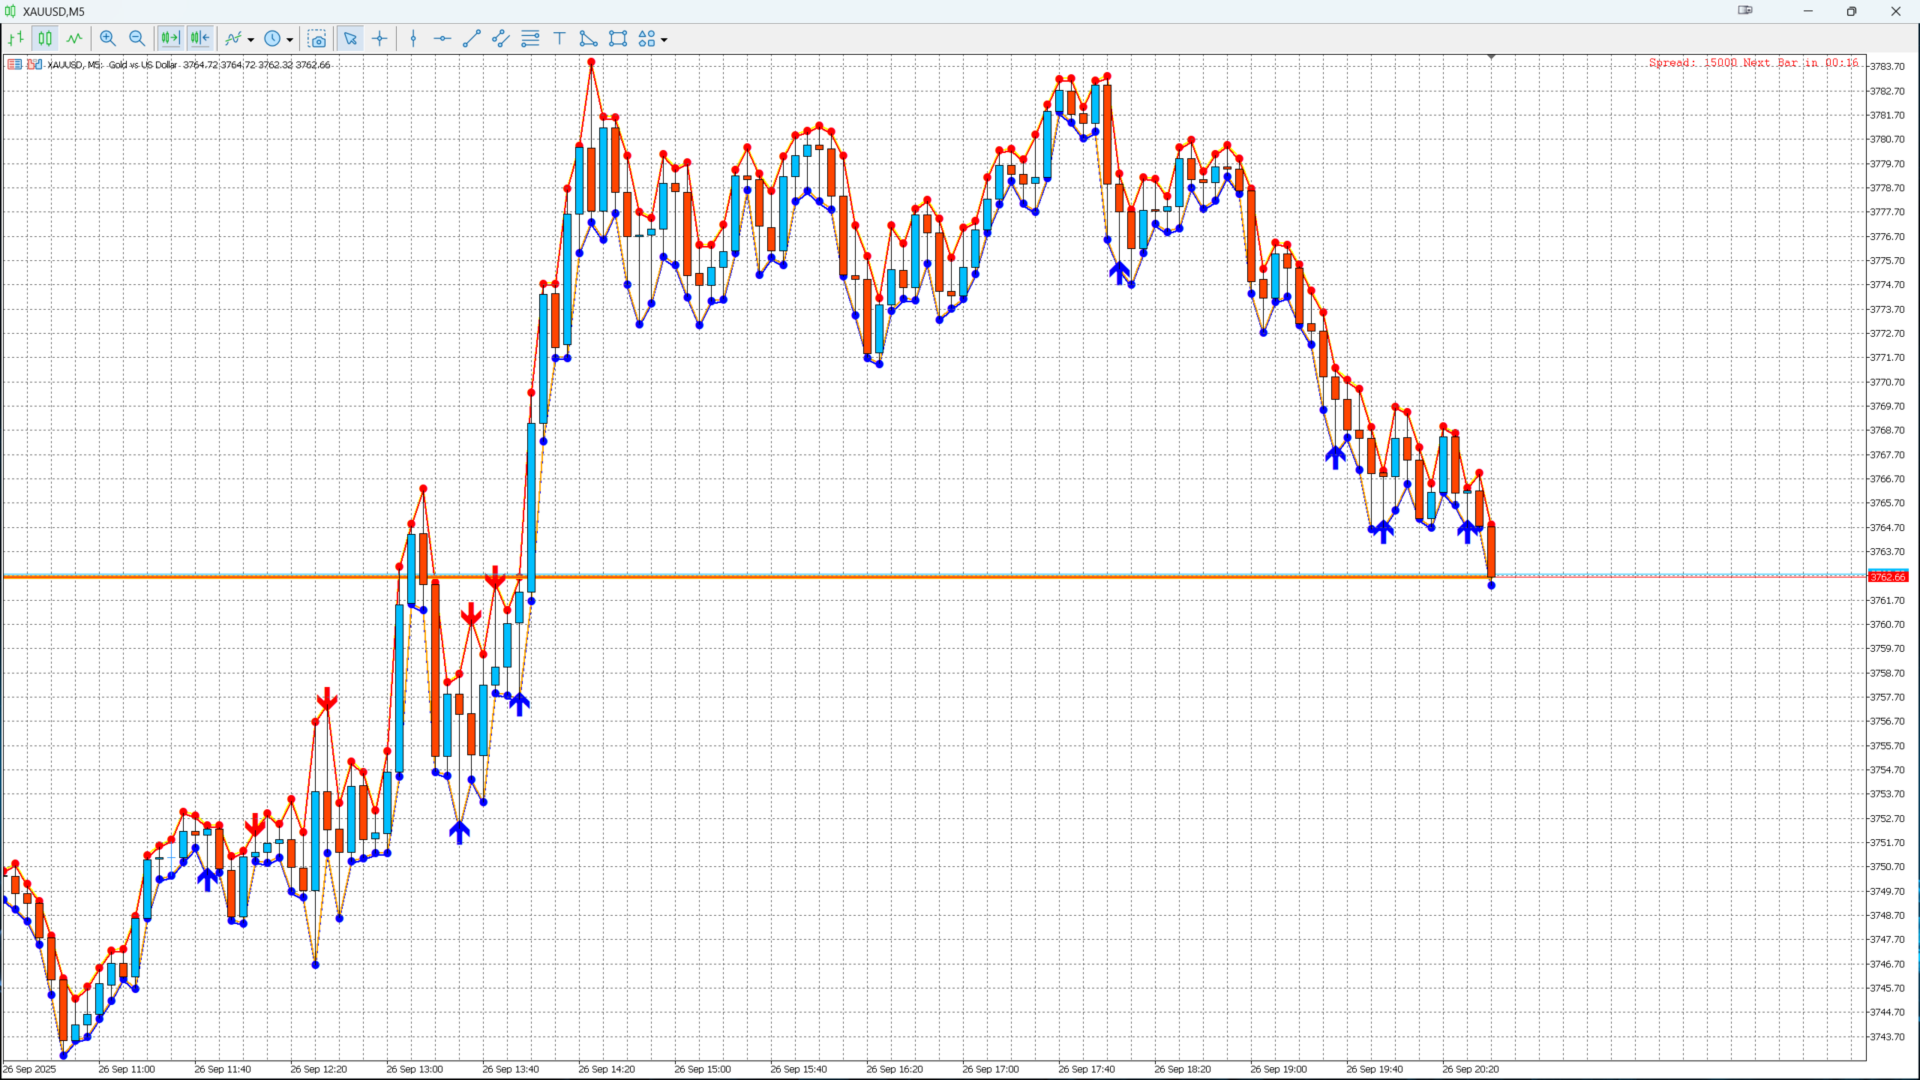
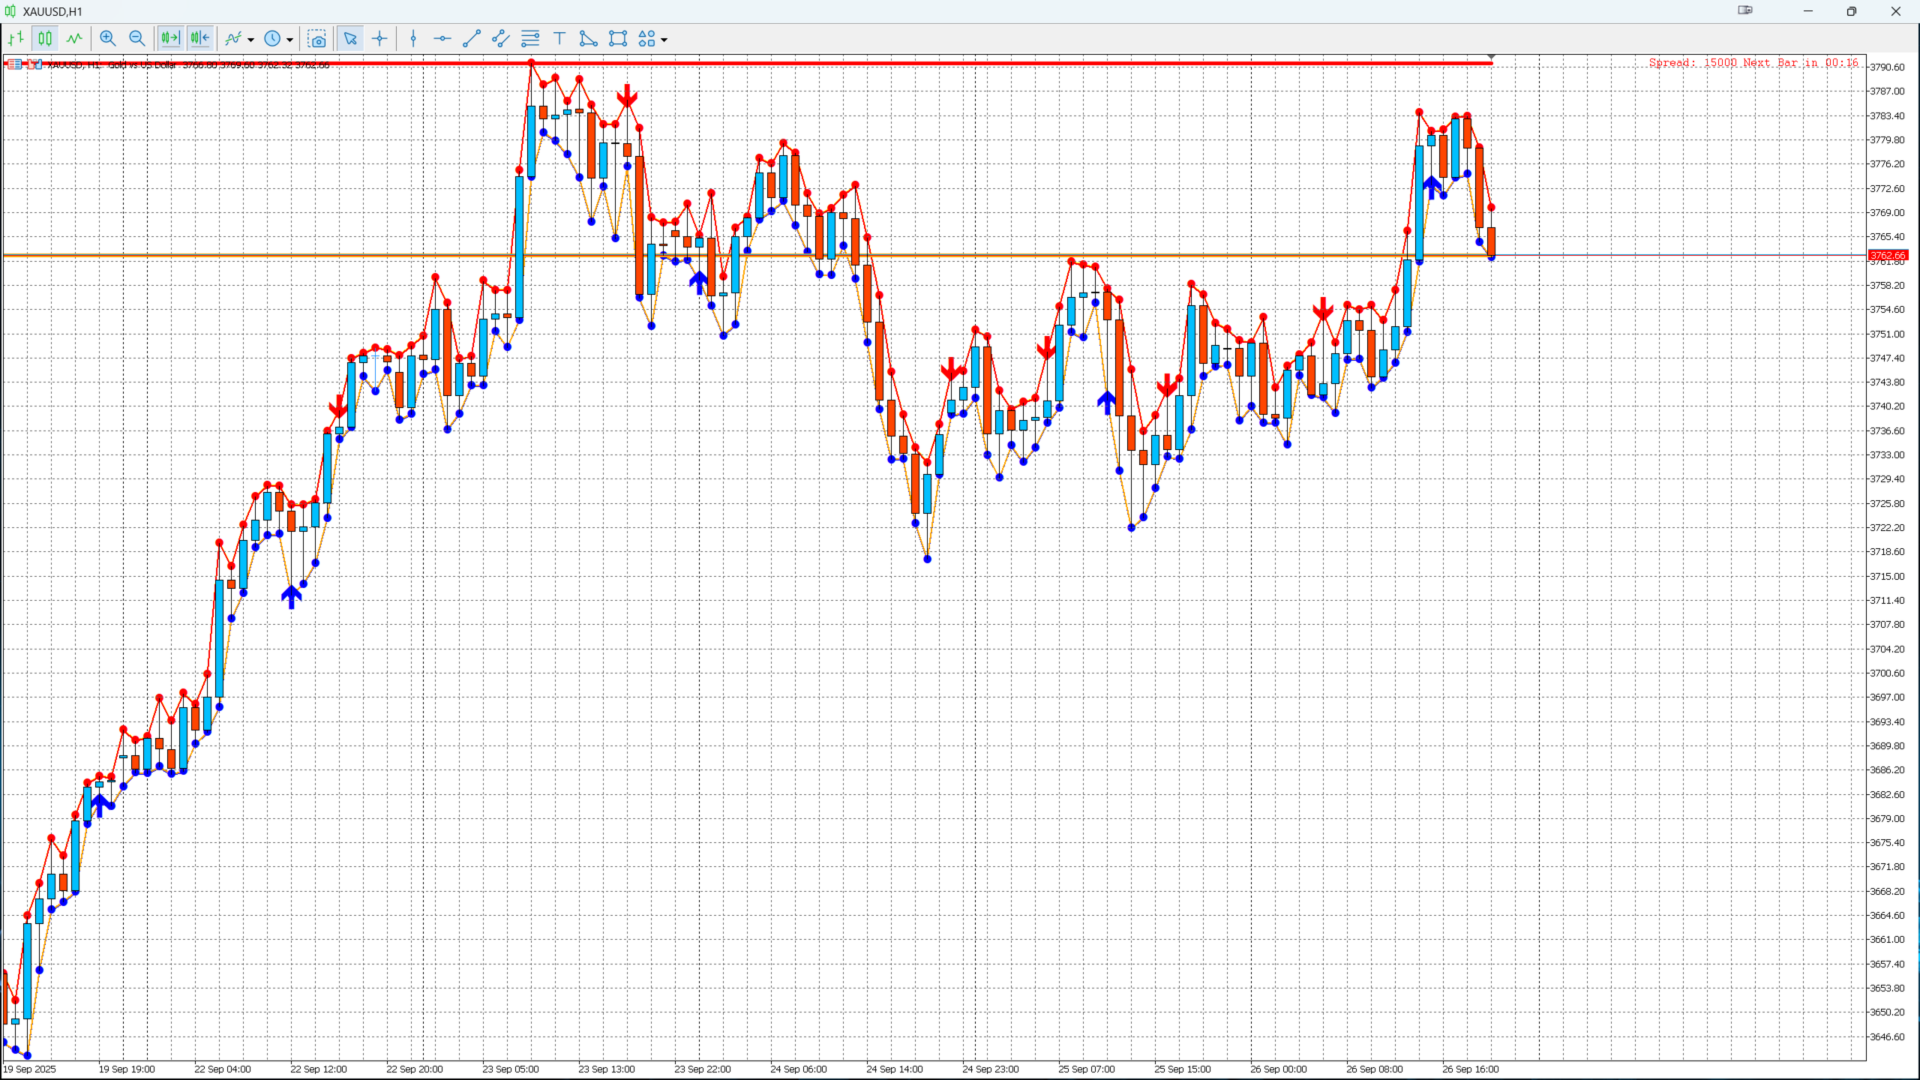
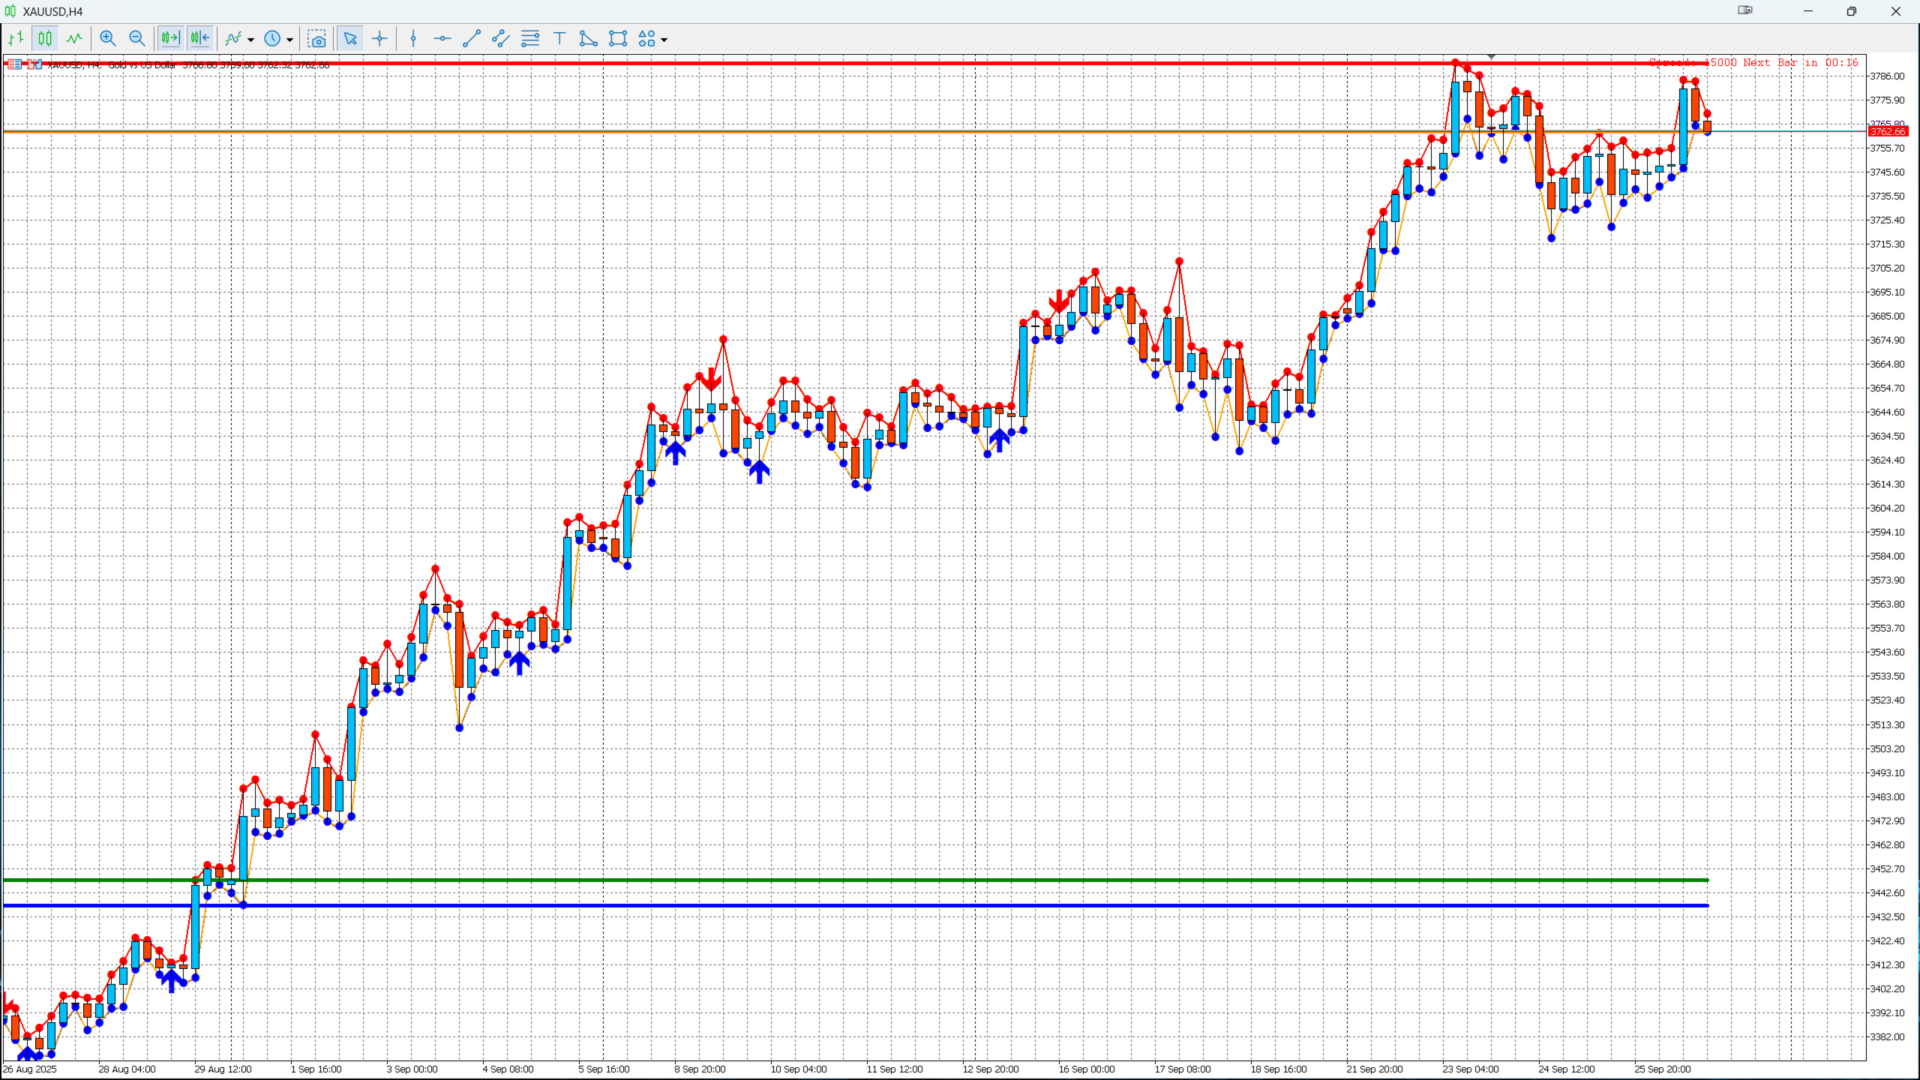
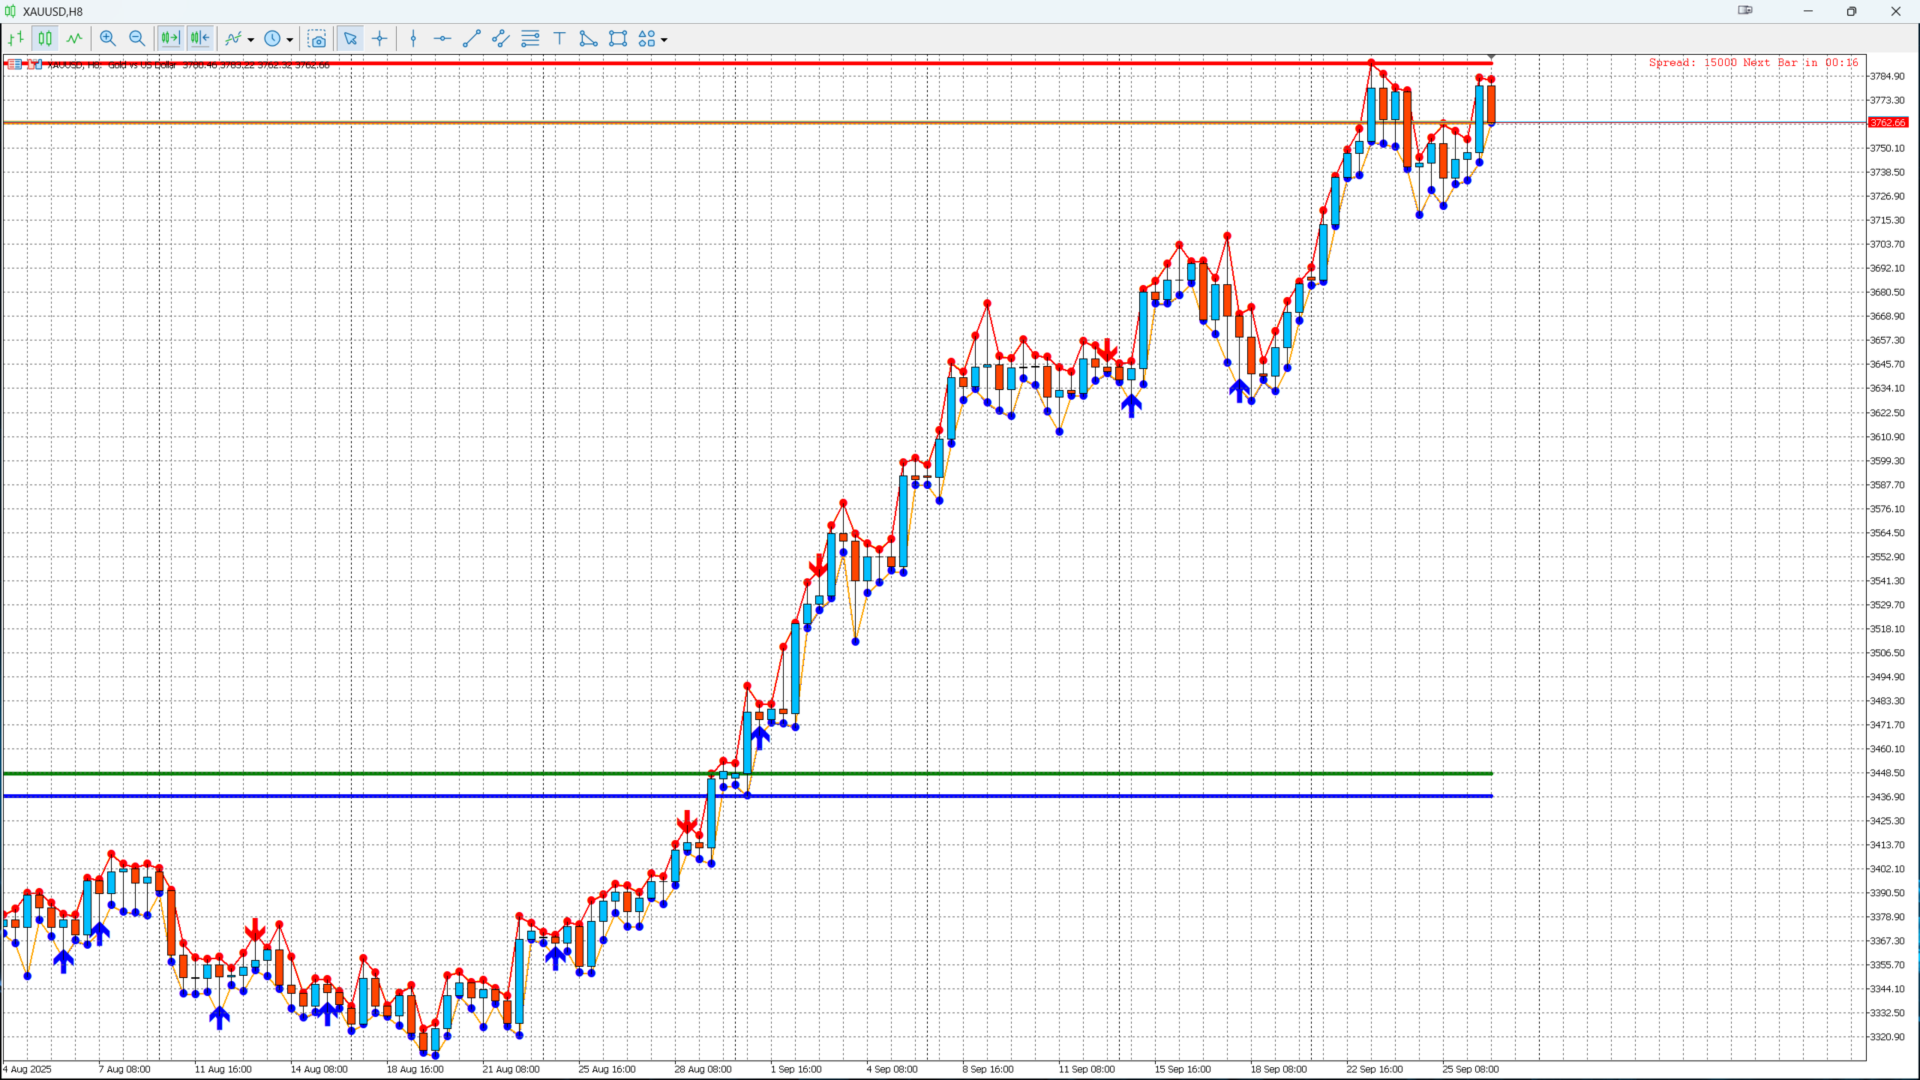
  1. ABCD Lemissa – Détecte automatiquement les structures ABCD avec points A, B, C et D, zones de support/résistance, et flèches d’achat/vente.

  2. Monthly Levels – Affiche les niveaux High, Low, Open, Close des bougies mensuelles pour repérer les zones clés.

  3. PinBar & Marubozu – Détecte les bougies PinBar (signaux d’inversion) et Marubozu (bougies puissantes) avec flèches et symboles personnalisables.

L’indicateur est entièrement visuel, combinant lignes, flèches et rectangles pour faciliter la lecture et la prise de décision.

🎯 Fonctionnalités principales

  • ABCD Lemissa

    • Points A, B, C, D détectés automatiquement

    • Signaux BUY et SELL avec flèches

    • Rectangles X1 / X2 pour visualiser les zones de support et résistance

  • Monthly Levels

    • Lignes pour High, Low, Open et Close de la bougie mensuelle

    • Mise à jour dynamique à chaque nouvelle bougie

  • PinBar & Marubozu

    • Détection automatique des bougies d’inversion et puissantes

    • Flèches personnalisables pour les entrées

    • Marubozu détecte les bougies avec très peu de mèches

  • Personnalisation

    • Couleurs des flèches et rectangles

    • Périodes ajustables pour Donchian et FZG

    • Timeframe et shift pour les niveaux mensuels

    • Codes et offsets des flèches PinBar / Marubozu

⚙️ Paramètres d’entrée

Paramètre Description Valeur par défaut
DonchianPeriod Période du canal Donchian pour ABCD 1000
FZGPeriod Période Future Zero Gravity pour ABCD 1000
BuyColor Couleur flèche BUY ABCD Bleu
SellColor Couleur flèche SELL ABCD Rouge
RectColorX1 Couleur rectangle X1 (zone d’achat) Bleu
RectColorX2 Couleur rectangle X2 (zone de vente) Rouge
ShvedTimeframe Timeframe pour zones Shved Supply/Demand H1
Ref_Timeframe Timeframe pour Monthly Levels MN1
Ref_Shift Décalage bougie mensuelle pour référence 0
PinBar_Arrow_Up_Code Code flèche PinBar HAUT 233
PinBar_Arrow_Down_Code Code flèche PinBar BAS 234
Arrow_Offset_Pts Décalage des flèches en points 10
WickMaxRatio Ratio maximal des mèches pour Marubozu 0.05

🖥️ Compatibilité

  • MT5

  • Toutes paires et timeframes

✅ Conseils d’utilisation

  • Idéal sur H1 ou supérieurs pour plus de fiabilité.

  • Utiliser en complément d’autres indicateurs pour confirmation.

  • Ajuster les périodes Donchian et FZG selon la volatilité de l’instrument.

  • Les flèches et rectangles sont visuels, à utiliser comme confirmation et non comme signal unique.


Produits recommandés
NOTE: Turn Pattern Scan ON This indicator identifies Swing Points, Break of Structure (BoS), Change of Character (CHoCH), Contraction and Expansion patterns which are plotted on the charts It also comes with Alerts & Mobile notifications so that you do not miss any trades. It can be used on all trading instruments and on all timeframes. The non-repaint feature makes it particularly useful in backtesting and developing profitable trading models. The depth can be adjusted to filter swing points.
FREE
Anti Butterfly Harmonic Pattern Indicator MT5 The Anti Butterfly Harmonic Pattern Indicator on the MetaTrader 5 platform automatically detects harmonic pattern points X, A, B, C, and D directly on the chart. It analyzes price data and calculates Fibonacci ratios with high accuracy, enabling precise identification of potential reversal zones. «Indicator Installation & User Guide» MT5 Indicator Installation  | Anti Butterfly Harmonic Pattern Indicator MT4  | ALL Products By  TradingFinderLab  | Be
FREE
RAD CRITICAL LEVES RAD indicator tracks “Relevant Volume” in real time, identifying accumulation and distribution processes, projecting them in the chart as SUPPORT or RESISTANCE zones. Natural   support   and resistance levels are generated by Volume Accumulation and Distribution processes. As these processes evolve, levels at which the relevant volume in the market place is positioned, become difficult areas to cross upwards or downwards. By using this information, traders can identify very s
Cumulative Delta Indicator for MetaTrader 5 The Cumulative Delta Indicator is a dedicated volume analysis tool on MetaTrader 5 that monitors market buying and selling pressure. By comparing order flow data, it displays cumulative volume changes to help traders identify divergence signals. This MT5 indicator supports the detection of strong market trends, enhances liquidity analysis, and confirms price action behavior. «Indicator Installation & User Guide» MT5 Indicator Installation  |  Cumulativ
FREE
Classic Shark Harmonic Pattern Indicator for MetaTrader 5 The Classic Shark Harmonic Pattern Indicator utilizes specific Fibonacci ratios—such as 88.6%, 113%, and 161.8%—to detect potential price reversal zones. By recognizing the geometric configuration of the pattern, the indicator automatically draws the Shark pattern on the chart and highlights the Potential Reversal Zone (PRZ) when conditions are met. «Indicator Installation & User Guide» MT5 Indicator Installation  |  Classic Shark Harmon
FREE
This indicator is, without a doubt, the best variation of the Gann Angles among others. It allows traders using Gann methods to automatically calculate the Gann angles for the traded instrument. The scale is automatically calculated when the indicator is attached to the chart. When switching timeframes, the indicator recalculates the scale for the current timeframe. Additionally, you can enter your own scales for the Gann angles. You can enter your own scales either for both vectors or for each
Free automatic Fibonacci is an indicator that automatically plots a Fibonacci retracement based on the number of bars you select on the BarsToScan setting in the indicator. The Fibonacci is automatically updated in real time as new highest and lowest values appears amongst the selected bars. You can select which level values to be displayed in the indicator settings. You can also select the color of the levels thus enabling the trader to be able to attach the indicator several times with differe
FREE
Value Chart Candlesticks
Flavio Javier Jarabeck
4.69 (13)
The idea of a Value Chart indicator was presented in the very good book I read back in 2020 , " Dynamic Trading Indicators: Winning with Value Charts and Price Action Profile ", from the authors Mark Helweg and David Stendahl. The idea is simple and the result is pure genius: Present candlestick Price analysis in a detrended way! HOW TO READ THIS INDICATOR Look for Overbought and Oversold levels. Of course, you will need to test the settings a lot to find the "correct" one for your approach. It
FREE
The key logic of SignalTech is generated by Artificial Intelligence. The machine learning module should continue optimizing the core logic on the server side to guarantee that SignalTech System can accurately track the market's movement.  SignalTech can generate AI based signals with Buy/Sell Arrows and Pop-Up/Sound Alerts. Each signal has clear Entry and stop Loss levels, which should be automatically flagged on the chart, as well as potential Targets 1, 2, and 3. SignalTech can work on EURU
Le Capteur de Tendance : La Stratégie du Capteur de Tendance avec Indicateur d'Alerte est un outil d'analyse technique polyvalent qui aide les traders à identifier les tendances du marché et les points d'entrée et de sortie potentiels. Elle présente une stratégie dynamique de Capteur de Tendance, s'adaptant aux conditions du marché pour une représentation visuelle claire de la direction de la tendance. Les traders peuvent personnaliser les paramètres selon leurs préférences et leur tolérance a
FREE
Visual Heatmap Book Analyzer
Alexandre Moraes De Souza Lima
Visual Heatmap Book Analyser This indicator monitors the market liquidity and generates colors based on order patterns, quantities, and renewal activities in the book. This allows you to visualize the order flow and identify areas of high and low liquidity and activity. The indicator uses machine learning techniques to analyze the order behavior in the book, enabling it to detect patterns and trends in orders, allowing you to make informed decisions about your trading operations. The color pale
Haven FVG Indicator
Maksim Tarutin
5 (6)
L'indicateur   Haven FVG   est un outil d'analyse des marchés qui permet d'identifier les zones d'inefficacité (Fair Value Gaps, FVG) sur le graphique, fournissant aux traders des niveaux clés pour l'analyse des prix et la prise de décisions commerciales. Autres produits ->  ICI Caractéristiques principales : Réglages de couleurs individuels : Couleur pour FVG haussier   (Bullish FVG Color). Couleur pour FVG baissier   (Bearish FVG Color). Visualisation flexible des FVG : Nombre maximum de boug
FREE
Spike Catch Pro
Amani Fungo
4.14 (7)
Spike Catch Pro 22:03 release updates Advanced engine for searching trade entries in all Boom and Crash pairs (300,500 and 1000) Programmed strategies improvements Mx_Spikes (to combine Mxd,Mxc and Mxe), Tx_Spikes,   RegularSpikes,   Litho_System,   Dx_System,   Md_System,   MaCross,   Omx_Entry(OP),  Atx1_Spikes(OP),   Oxc_Retracement (AT),M_PullBack(AT) we have added an arrow on strategy identification, this will help also in the visual manual backtesting of the included strategies and see ho
FREE
Description générale Cet indicateur est une version améliorée du Canal Donchian classique, enrichie de fonctionnalités pratiques pour le trading réel. En plus des trois lignes standard (supérieure, inférieure et ligne médiane), le système détecte les cassures et les affiche visuellement avec des flèches sur le graphique, en montrant uniquement la ligne opposée à la direction actuelle de la tendance pour une lecture plus claire. L’indicateur comprend : Signaux visuels : flèches colorées lors des
FREE
Adjustable Consecutive Fractals  looks for 2 or more fractals in one direction and sends out a on screen alert, sound alert and push notification, for strong reversal points . Adjustable Consecutive Fractals, shows the fractals on chart along with a color changing text for buy and sell signals when one or more fractals appear on one side of price. Adjustable Consecutive Fractals is based Bill Williams Fractals . The standard Bill Williams fractals are set at a non adjustable 5 bars, BUT withe th
ZP Day Trading Indicator in MT5 The ZP Day Trading Indicator is one of the tools developed based on Price Action trading style concepts in MetaTrader 5. This indicator uses color-coded boxes to identify Trading Ranges on the chart. A trading range forms when the price moves within a specific range between a resistance level (ceiling) and a support level (floor) over a period of time. In such scenarios, buyers and sellers reach equilibrium within the defined range. «Indicator Installation & User
FREE
PZ Penta O MT5
PZ TRADING SLU
3.5 (4)
The Penta-O is a 6-point retracement harmonacci pattern which usually precedes big market movements. Penta-O patterns can expand and repaint quite a bit. To make things easier this indicator implements a twist: it waits for a donchian breakout in the right direction before signaling the trade. The end result is an otherwise repainting indicator with a very reliable trading signal. The donchian breakout period is entered as an input. [ Installation Guide | Update Guide | Troubleshooting | FAQ | A
FREE
Delta Profile Volume
Teresinha Moraes Correia
Technical Description of the Indicator – Delta Profile for MetaTrader 5 The Delta Profile is an indicator developed for MetaTrader 5 focused on detailed analysis of volume flow within a defined range of candles. It organizes and displays information about the imbalance of positive volumes (associated with upward movements) and negative volumes (associated with downward movements) at different price levels. The result is a clear view of the chart points where the highest concentration of trades o
FlatBreakout MT5 (Free Version) Flat Range Detector and Breakout Panel for MT5 — GBPUSD Only FlatBreakout MT5   is the free version of the professional FlatBreakoutPro MT5 indicator, specially designed for flat (range) detection and breakout signals on the   GBPUSD   pair only. Perfect for traders who want to experience the unique fractal logic of FlatBreakout MT5 and test breakout signals on a live market without limitations. Who Is This Product For? For traders who prefer to trade breakout of
FREE
Are you tired of drawing trendlines every time you're analyzing charts? Or perhaps you would like more consistency in your technical analysis. Then this is for you. This indicator will draw trend lines automatically when dropped on a chart. How it works Works similar to standard deviation channel found on mt4 and mt5. It has 2 parameters: 1. Starting Bar 2. Number of bars for calculation The   starting bar   is the bar which drawing of the trend lines will begin, while the   number of bars for c
FREE
ADR ST Patterns Strategy
Vladimir Poltoratskiy
5 (1)
ADR ST Patterns Strategy  is a modification of the classical  ADR  indicator. This simple indicator corresponds to the parameters specified in the  ST Patterns Strategy ( https://stpatterns.com/ ) .  Structural Target Patterns represents the market consistently divided into components. No trend lines, geometric proportions of the model itself, trading volume, or open market interest are needed for the formation of  ST Patterns . They are easily recognized and built only on the basis of breaking
FREE
This z-score indicator shows the correct z-score of an asset, as it uses the normalized price data for calculation, which is the only correct way. Z-score is only applicable for normal distributed data, therefore not the actual price is considered, but the normalised returns, which were assumed to follow a normal distribution. Returns are mean reverting and assumed to follow a normal distribution, therefore z-score calculation of returns is more reliable than z-score on price, as price is NOT m
MarketMagnet
Kelly Adediran Raymond
Are you ready to take your trading journey to new heights? Look no further than MarketMagnet, this groundbreaking indicator designed to propel your trading success with excitement and accuracy. Powered by the convergence of Momentum and CCI (Commodity Channel Index), MarketMagnet equips traders with the ultimate tool to determine direction and entry prices for a wide range of recommended currency pairs and instruments. It is designed for traders seeking to scalp for a few pips on lower timeframe
QuantumAlert RSI Navigator is a free indicator available for MT4/MT5 platforms, its work is to provide "alerts" when the market is inside "overbought and oversold" regions in the form of "buy or sell" signals. This indicator comes with many customization options mentioned in the parameter section below, user can customise these parameters as needful. Join our MQL5 group , where we share important news and updates. You are also welcome to join our private channel as well, contact me for the priva
FREE
Overview The Market Perspective Structure Indicator is a comprehensive MetaTrader indicator designed to provide traders with a detailed analysis of market structure across multiple timeframes. It identifies and visualizes key price action elements, including swing highs and lows, Break of Structure (BOS), Change of Character (CHOCH), internal structures, equal highs/lows, premium/discount levels, previous levels from higher timeframes, and trading session zones. With extensive customization opt
Ultimate Retest
Nguyen Thanh Cong
5 (6)
Introduction The "Ultimate Retest" Indicator stands as the pinnacle of technical analysis made specially for support/resistance or supply/demand traders. By utilizing advanced mathematical computations, this indicator can swiftly and accurately identify the most powerful support and resistance levels where the big players are putting their huge orders and give traders a chance to enter the on the level retest with impeccable timing, thereby enhancing their decision-making and trading outcomes.
FREE
Pivot Point Fibo RSJ est un indicateur qui trace les lignes de support et de résistance de la journée en utilisant les taux de Fibonacci. Cet indicateur spectaculaire crée jusqu'à 7 niveaux de support et de résistance via Pivot Point en utilisant les taux de Fibonacci. C'est fantastique de voir comment les prix respectent chaque niveau de ce support et de cette résistance, où il est possible de percevoir les points d'entrée/sortie possibles d'une opération. Caractéristiques Jusqu'à 7 niveaux
FREE
QuantumAlert Stoch Navigator is a free indicator available for MT4/MT5 platforms, its work is to provide "alerts" when the market is inside "overbought and oversold" regions in the form of "buy or sell" signals. This indicator comes with many customization options mentioned in the parameter section below, user can customise these parameters as needful. Join our   MQL5 group , where we share important news and updates. You are also welcome to join our private channel as well, contact me for the p
FREE
WAPV Box Effort x Result
Eduardo Da Costa Custodio Santos
WA_PV_BOX_EFFORT X RÉSULTAT pour MT5 L'indicateur WAPV Box Effort x Result fait partie du groupe Package Indicators (Wyckoff Academy Wave Market). L'indicateur WAPV Box Effort x Result pour MT5 vous aide à lire le prix et le volume. Sa lecture consiste à aider à l'identification effort x résultat dans les vagues créées par le graphique. L'indicateur WAPV Box Effort x Result pour MT5 lorsque la case est verte signifie que le volume est en faveur de la demande et lorsque la case est rouge le volum
Nem Nem
Taha Saber Ashour Kamel
Nem Nem is super accurate mt5 indicator it is working with any pair any time frame it will show and provide you with high Winrate signal you can use for forex pairs , gold and any other pairs it is easy to use also you can see the white lines for starting and end of signals it will help you to read the chart and enter and make correct decisions in trades. also it  will be clear for you when to enter and exit from any trades
FREE
Les acheteurs de ce produit ont également acheté
AriX
Temirlan Kdyrkhan
1 (2)
AriX Indicator for MT5 A powerful trend-following and signal-evaluation tool AriX is a custom MT5 indicator that combines Moving Averages and ATR-based risk/reward logic to generate clear buy/sell signals. It visualizes dynamic SL/TP levels, evaluates past trade outcomes, and displays win/loss statistics in a clean on-chart panel. Key features include: Buy/Sell signals based on MA crossovers ATR-based SL/TP1/TP2/TP3 levels with visual lines and labels Signal outcome tracking with real-time stat
ARICoins
Temirlan Kdyrkhan
ARICoin is a powerful trading companion designed to generate high-probability entry signals with dynamic TP/SL/DP levels based on volatility. Built-in performance tracking shows win/loss stats, PP1/PP2 hits, and success rates all updated live. Key Features: Buy/Sell signals with adaptive volatility bands Real-time TP/SL/DP levels based on ATR Built-in MA Filter with optional ATR/StdDev volatility Performance stats panel (Success, Profit/Loss, PP1/PP2) Alerts via popup, sound, push, or email Cust
ARIPoint
Temirlan Kdyrkhan
ARIPoint is a powerful trading companion designed to generate high-probability entry signals with dynamic TP/SL/DP levels based on volatility. Built-in performance tracking shows win/loss stats, PP1/PP2 hits, and success rates all updated live. Key Features: Buy/Sell signals with adaptive volatility bands Real-time TP/SL/DP levels based on ATR Built-in MA Filter with optional ATR/StdDev volatility Performance stats panel (Success, Profit/Loss, PP1/PP2) Alerts via popup, sound, push, or email Cu
ARIScalping
Temirlan Kdyrkhan
ARIScalp is a powerful trading companion designed to generate high-probability entry signals with dynamic TP/SL/DP levels based on volatility. Built-in performance tracking shows win/loss stats, PP1/PP2 hits, and success rates all updated live. Key Features: Buy/Sell signals with adaptive volatility bands Real-time TP/SL/DP levels based on ATR Built-in MA Filter with optional ATR/StdDev volatility Performance stats panel (Success, Profit/Loss, PP1/PP2) Alerts via popup, sound, push, or email Cus
Pantera Indicator
Temirlan Kdyrkhan
5 (1)
A tool for on-chart strategy backtesting and performance analysis. A utility for developing, debugging, and testing custom trading ideas and indicator functions. An indicator designed to quickly test trading concepts and visualize the effectiveness of different input parameters. An all-in-one sandbox for testing everything from simple crossovers to complex, multi-condition trading systems.
VTrende Pro
Andrii Diachenko
5 (1)
VTrende Pro - MTF indicator for trend trading with a display panel for MT5 *** Videos can be translated into any language using subtitles (video language - Russian) Although the signals of the VTrende Pro indicator can be used as signals of a full-fledged trading system, it is recommended to use them in conjunction with the Bill Williams TS. VTrende Pro is an extended version of the VTrende indicator. Difference between Pro version and VTrende: - Time zones - Signal V - signal 1-2 waves -    S
This indicator is based on the mathematics of the great trader W.D. Ganna. With its help, you can easily find strong levels by analyzing swings to find the optimal entry point. The indicator works on all instruments and all timeframes. The indicator is fully manual and has control buttons. All you need to do is press the NEW button, a segment will appear, which you can place on any movement, swing or even 1 candle that you want to analyze. By placing the segment, press the OK button. A grid (th
Jeslyn MT5
Justine Kelechi Ekweh
Il s'agit d'un système polyvalent qui convient à la fois aux traders manuels du Forex, soit comme système de scalper, soit comme stratégie pour entrer dans une très forte dynamique, les traders d'options binaires ou pour être utilisé par les EA universels dans le trading automatisé. Il s'agit d'un système polyvalent qui convient à la fois aux traders manuels du Forex, soit comme système de scalper, soit comme stratégie pour entrer dans une très forte dynamique, les traders d'options binaires ou
MatadorGate
Metin Erkamoglu
MATADOR Signal Suite — Quant Pro v3.57 (Indicator) Signal-only   •   Chart Overlay + Alerts   (Popup/Push/JSON) •   SMC+   (OB/FVG/BOS) +   PA   +   HTF EMA   •   M1 - M5 XAUUSD, EURUSD ...   focused, multi-symbol ready MATADOR_v3_57_User_Manual_Multilingual & Strategy Tester  https://drive.google.com/drive/folders/1fnR-uAx6GnoDai5YnYMwF5WIvsHlE39j?usp=sharing What is it? MATADOR is a   multi-layer signal indicator   with institutional-grade filtering. It does   not   open trades; instead it dr
Core Concept: Naveen Saroha's Advanced time and price angles are drawn from significant highs or lows at specific geometric ratios that represent the relationship between price movement and time. The Main Gann Angles and Percentage together Most Important: 1x1 Angle : One units of price for one unit of time  1x2 Angle : One unit of price for two units of time  1x3 Angle 1x4 Angle 1x5 Angle 1x6 Angle 1x7 Angle 1x8 Angle: (45) : Eight unit of price for one unit of time - considered the most i
Indicateur Bandes de Bollinger Multi-Timeframe Améliorez votre analyse de trading avec notre indicateur Bandes de Bollinger Multi-Timeframe pour MQL5 ! Cet outil puissant vous permet de visualiser les Bandes de Bollinger sur cinq échelles de temps différentes simultanément, le tout en utilisant le même paramètre de période . Obtenez une compréhension plus claire de la volatilité du marché et des retournements de tendance potentiels en un coup d'œil. Simplifiez votre analyse multi-timeframe et pr
The indicator is designed to close positions on the market in time. For example: to take profits ahead of schedule if the price has not reached TakeProfit, and the market is turning around. The indicator analyzes the momentum, not the trend. He does not give any information about the trend. The indicator is well suited for finding divergence. The Ershov 38 Parrots indicator dynamically adjusts to the market and detects price movement impulses of medium and high amplitude. It almost does not rea
The Second-Level Tick Candlestick Generator is a professional-grade MT5 indicator tool specifically designed for high-frequency trading and short-term scalping. It can convert raw tick data into highly customizable second-level candlestick charts in real-time, helping traders accurately capture micro-market fluctuations and optimize entry and exit timing. This tool provides clear chart displays, allowing you to more intuitively identify price action patterns and improve trading decision efficien
Trend Compass MT5
Paul Edunyu Carissimo
Trend Compass: All-in-One Trend Tracking The Trend Compass indicator is a sophisticated yet user-friendly trading tool designed for both novice and experienced traders. By combining multiple technical analysis approaches into one comprehensive package, it eliminates the need for multiple indicators cluttering your charts. Key Features: Multiple analysis modes including VSA for effort/result evaluation Dynamic trailing stops using fractal levels Seven color visualization options for clear market
Smooth price for Monarch
Konstantin Gruzdev
5 (1)
The Smooth Price technical indicator is used for plotting a smoothed line as close to the price of the financial instrument as possible, and serves to eliminate its noise components. The indicator is part of the Monarch trading system, but here it is presented as an independent technical analysis tool. The indicator is based on the cluster digital filter , which, unlike the ClusterSMA , is applied directly to the price time series. Smooth Price does not redraw (except the very last, zero bar) an
The Expert Advisor and the video are attached in the Discussion tab . The robot applies only one order and strictly follows the signals to evaluate the indicator efficiency. Pan PrizMA CD Phase is an option based on the Pan PrizMA indicator. Details (in Russian). Averaging by a quadric-quartic polynomial increases the smoothness of lines, adds momentum and rhythm. Extrapolation by the sinusoid function near a constant allows adjusting the delay or lead of signals. The value of the phase - wave s
Классификатор силы тренда. Показания на истории не меняет. Изменяется классификация только незакрытого бара. По идее подобен полной системе ASCTrend, сигнальный модуль которой, точнее его аппроксимация в несколько "урезанном" виде, есть в свободном доступе, а также в терминале как сигнальный индикатор SilverTrend . Точной копией системы ASCTrend не является. Работает на всех инструментах и всех временных диапазонах. Индикатор использует несколько некоррелируемых между собой алгоритмов для класси
FFx Universal Strength Meter PRO is more than a basic strength meter. Instead of limiting the calculation to price, it can be based on any of the 19 integrated strength modes + 9 timeframes. With the FFx USM, you are able to define any period for any combination of timeframes. For example, you can set the dashboard for the last 10 candles for M15-H1-H4… Full flexibility! Very easy to interpret... It gives a great idea about which currency is weak and which is strong, so you can find the best pai
The FFx Universal MTF alerter shows on a single chart all the timeframes (M1 to Monthly) with their own status for the chosen indicator. 9 indicators mode (MACD-RSI-Stochastic-MA-ADX-Ichimoku-Candles-CCI-PSAR). Each can be applied multiple times on the same chart with different settings. Very easy to interpret. Confirm your BUY entries when most of the timeframes are showing green color. And confirm your SELL entries when most of the timeframes are showing red color. 2 Alert Options : input to s
The FFx Watcher PRO is a dashboard displaying on a single chart the current direction of up to 15 standard indicators and up to 21 timeframes. It has 2 different modes: Watcher mode: Multi Indicators User is able to select up to 15 indicators to be displayed User is able to select up to 21 timeframes to be displayed Watcher mode: Multi Pairs User is able to select any number of pairs/symbols User is able to select up to 21 timeframes to be displayed This mode uses one of the standard indicators
FFx Patterns Alerter gives trade suggestions with Entry, Target 1, Target 2 and StopLoss .... for any of the selected patterns (PinBar, Engulfing, InsideBar, OutsideBar) Below are the different options available: Multiple instances can be applied on the same chart to monitor different patterns Entry suggestion - pips to be added over the break for the entry 3 different options to calculate the SL - by pips, by ATR multiplier or at the pattern High/Low 3 different options to calculate the 2 TPs -
MetaTrader 4 version available here : https://www.mql5.com/en/market/product/24881 FFx Basket Scanner is a global tool scanning all pairs and all timeframes over up to five indicators among the 16 available. You will clearly see which currencies to avoid trading and which ones to focus on. Once a currency goes into an extreme zone (e.g. 20/80%), you can trade the whole basket with great confidence. Another way to use it is to look at two currencies (weak vs strong) to find the best single pairs
MetaTrader 4 version available here: https://www.mql5.com/en/market/product/25793 FFx Pivot SR Suite PRO is a complete suite for support and resistance levels. Support and Resistance are the most used levels in all kinds of trading. Can be used to find reversal trend, to set targets and stop, etc. The indicator is fully flexible directly from the chart 4 periods to choose for the calculation: 4Hours, Daily, Weekly and Monthly 4 formulas to choose for the calculation: Classic, Camarilla, Fibonac
Pendiente de Precio
Cesar Juan Flores Navarro
Indicador en base a la pendiente de la linea de precio, dibuja una línea de color cuando sube a base de los precios que previamente has sido procesados o linealizados, y cuando baja la pendiente la linea linealizada toma otro color. En este caso se a considerado 6 lineas de diferentes procesos desde pendientes largas hacia las cortas, observándose que cuando coincidan las pendientes se produce un máximo o mínimo, lo que a simple vista nos permitirá hacer una COMPRA O VENTA.
WanaScalper
Isaac Wanasolo
1 (1)
A scalping indicator based on mathematical patterns, which on average gives signals with relatively small SL, and also occasionally helps to catch big moves in the markets (more information in the video) This indicator has three main types of notifications: The first type warns of a possible/upcoming signal on the next bar The second type indicates the presence of a ready signal to enter the market/open a position The third type is for SL and TP levels - you will be notified every time price re
Индикатор Coefficient Of Determination (COD) представляет собой значение коэффициента детерминации или квадрат коэффициента корреляции между зависимой переменной — ценой и объясняющей переменной — тиковым объемом. Что это дает нам на практике? COD отлично распознает кульминацию трендовых движений, что позволяет подбирать оптимальные точки и ловить развороты рынка. Как использовать индикатор: Наиболее популярная торговая стратегия строится совместно с трендовым индикатором Moving Average (MA), пе
Fibonacci Multiple 12
Cesar Juan Flores Navarro
Fibonacci Múltiple 12, utiliza la serie fibonacci plasmado en el indicador fibonacci, aumentadolo 12 veces según su secuencia. El indicador fibonacci normalmente muestra una vez, el presente indicador se mostrara 12 veces empezando el numero que le indique siguiendo la secuencia. Se puede utilizar para ver la tendencia en periodos cortos y largos, de minutos a meses, solo aumentado el numero MULTIPLICA.
Recommended TimeFrame >= H1. 100% Non Repainted at any moment.  Use it carefully, only with Trend Direction. Trading Usage: 2 Variants: as Range System or as BreakOut System (Both Only With Trend Direction)::: (Always use StopLoss for minimise Risk); [1] as Range System: (Recommended) in UP TREND:  - BUY in Blue Line , then if price goes down by 50 points (on H1) open Second BUY.   Close in any Profit you wish: TrailingStop(45 points) or Close when Price touches upper Gold Line. in DOWN TREND
En base a cálculos matemáticos de determino una linea Horizontal que cruza a todas las señales de trading, mostrando los máximos y mínimos. La linea horizontal parte en dos las subidas y bajadas de las señales de trading, de tan manera que es fácil identificar los máximos y mínimos, y es inteligente por que es sensible a las subidas y bajadas, afín de no quedarse en un solo lado por siempre, trabaja excelentemente con otros indicadores suavizadores ya que les garantiza que en un intervalo de tie
Spike Detector
Tete Adate Adjete
this indicator is a Spike detector indicator, it is specially designed to trade Boom 1000, Boom 500, Crash 1000 and Crash 500 We recommend using it on Deriv Boom and Crash indices only Its setting is intuitive, familiar, easy to use it has notification functions; audible notifications and push notifications. this tool is simple to use, easy to handle This update is based on different strategies for spikes
Plus de l'auteur
Canal H Pro
N'da Lemissa Kouame
Français – Canal H Pro Nom : Canal H Pro – Support, Résistance & Breakout Description courte : Indicateur premium affichant trois lignes dynamiques (haute, basse, médiane) . Idéal pour Breakout, Range et suivi de tendance. Description complète : Rouge (Haute) → résistance dynamique Bleue (Basse) → support dynamique Jaune (Médiane) → équilibre et filtre de tendance Période et couleurs personnalisables Compatible toutes stratégies et unités de temps Canal H Pro – repérez les zones clés et prenez
NuageTrend Pro
N'da Lemissa Kouame
Nuage Trend Pro – Suivi de Tendance & Signaux Kijun Nuage Trend Pro est un indicateur avancé pour MetaTrader 5 , conçu pour détecter les tendances fortes et les points d’entrée optimaux grâce au croisement de la Kijun . Il transforme vos graphiques en cartes visuelles instantanées pour trader avec précision et confiance. Fonctionnalités principales Croisement de Kijun automatique : repère immédiatement les moments clés où le prix franchit la ligne de base. Nuage de tendance dynamique : col
Weekly Levels Pro
N'da Lemissa Kouame
Description – Weekly Levels Pro Weekly Levels Pro – Niveaux Clés Hebdomadaires est un indicateur simple et efficace pour MetaTrader 5, conçu pour afficher automatiquement les quatre niveaux les plus importants de chaque semaine de trading : Plus haut de la semaine (Weekly High) → zone de résistance naturelle Plus bas de la semaine (Weekly Low) → zone de support naturel Prix d’ouverture de la semaine (Weekly Open) → point de référence de tendance Prix de clôture de la semaine (Weekly Close) →
Pin Bar Pro v1
N'da Lemissa Kouame
Pin Bar Pro v1.0 – Indicateur MQL5 Description générale Pin Bar Pro est un indicateur professionnel pour MetaTrader 5 qui détecte automatiquement les Pin Bars , une formation de bougie japonaise cruciale pour anticiper les retournements du marché. Grâce à cet indicateur, les traders peuvent identifier rapidement les points d’entrée potentiels en achat ou en vente sans avoir à analyser manuellement chaque bougie. Les signaux sont affichés directement sur le graphique sous forme de flèches clair
Monthly Levels Pro
N'da Lemissa Kouame
Monthly Levels Pro v1.0 – L’indicateur ultime des niveaux mensuels du marché Maîtrisez les niveaux clés du marché en un coup d’œil Monthly Levels Pro est l’outil indispensable pour tous les traders souhaitant analyser les tendances à long terme et repérer rapidement les zones clés de support et de résistance . Cet indicateur affiche les niveaux High (Haut), Low (Bas), Open (Ouverture) et Close (Fermeture) d’une bougie mensuelle, révélant instantanément les zones où le prix est susceptible de ré
Indicateur Monthly Levels + Pin Bar Pro Description L’indicateur Monthly Levels + Pin Bar Pro combine la puissance des niveaux clés mensuels (High, Low, Open, Close) avec la détection automatique des figures de retournement Price Action (Pin Bars) . Conçu pour les traders techniques et institutionnels, il permet d’anticiper les zones de réaction du marché et de générer des signaux visuels clairs directement sur le graphique. Fonctionnalités principales Niveaux mensuels automatiques :
Yearly Levels Pro
N'da Lemissa Kouame
Yearly Levels Pro v1.0 – Indicateur annuel de support et résistance Version : 1.0 Développeur : KOUAME N'DA LEMISSA Plateforme : MetaTrader 5 (MT5) Type : Indicateur technique / Zones de prix annuelles Description générale Yearly Levels Pro v1.0 , développé par KOUAME N'DA LEMISSA , est un indicateur puissant qui permet aux traders d’identifier rapidement les niveaux clés annuels du marché. Il calcule automatiquement les prix Open, High, Low et Close d’une année spécifique et les affiche directe
Quarterly Levels Pro v1.0 – Notice Commerciale Nom du produit : Quarterly Levels Pro v1.0 Développeur : KOUAME N'DA LEMISSA Version : 1.0 Description : Quarterly Levels Pro , développé par KOUAME N'DA LEMISSA , est un indicateur professionnel pour MetaTrader 5 qui affiche automatiquement les niveaux High, Low, Open et Close d’une période trimestrielle. Il permet aux traders de visualiser clairement les zones clés de support et résistance sur le graphique, facilitant la prise de décision pour les
Notice Commerciale – MQL5 Market Multi-Timeframe Levels Pro v1.0 Développeur : KOUAME N’DA LEMISSA Description Multi-Timeframe Levels Pro v1.0 est un indicateur puissant qui trace automatiquement les niveaux clés Daily, Monthly, Quarterly et Yearly (High, Low, Open, Close) directement sur votre graphique. Ces niveaux historiques sont utilisés par les traders professionnels pour identifier : Les zones de support et résistance majeures Les points de retournement probables Les zones de breakout
Marubozu Pro MT5
N'da Lemissa Kouame
Notice Commerciale – Marubozu Pro (MT5) Description Marubozu Pro est un indicateur professionnel pour MetaTrader 5 qui détecte automatiquement les bougies Marubozu (haussières et baissières) directement sur votre graphique. Il vous aide à identifier les zones de force du marché, là où les acheteurs ou les vendeurs prennent totalement le contrôle, en affichant des flèches visuelles d’achat et de vente. Cet outil est conçu pour être simple, efficace et rapide , idéal pour le trading manuel ou c
ETE Detector – Head & Shoulders Indicator Transformez vos graphiques en opportunités de trading claires et visuelles ! À propos de l’indicateur L’indicateur ETE Detector détecte automatiquement les figures Épaule-Tête-Épaule (ETE) et ETE inversées (ETEi) , les configurations classiques de retournement de tendance. Fini les heures passées à chercher manuellement les figures : votre analyse devient rapide, précise et visuelle . Ce que vous obtenez Détection automatique des figures de retourn
Fusion Monthly Levels + PinBar + Marubozu Description Cet indicateur unique combine trois outils puissants de l’analyse technique en un seul : Niveaux mensuels (High, Low, Open, Close) – pour repérer les zones clés de support et de résistance. Détection des PinBars – figure de retournement fiable signalant des rejets de prix. Détection des Marubozu – bougies de tendance fortes indiquant un momentum directionnel. Grâce à cette fusion, vous obtenez un outil visuel, complet et réactif pour an
Order Block Pro (MQL5) – Version 1.0 Auteur : KOUAME N'DA LEMISSA Plateforme : MetaTrader 5 Description : Order Block Pro est un indicateur avancé conçu pour détecter automatiquement les Order Blocks haussiers et baissiers sur votre graphique. Grâce à une analyse précise des bougies de consolidation et des bougies suivantes de forte impulsion, cet indicateur vous permet d’identifier les zones clés où les mouvements de prix sont susceptibles de s’accélérer. Cet outil est parfait pour les traders
Filtrer:
Aucun avis
Répondre à l'avis