Channel Ultima

Channel Ultima – Indicateur Multi-Canal Dynamique

  Description courte

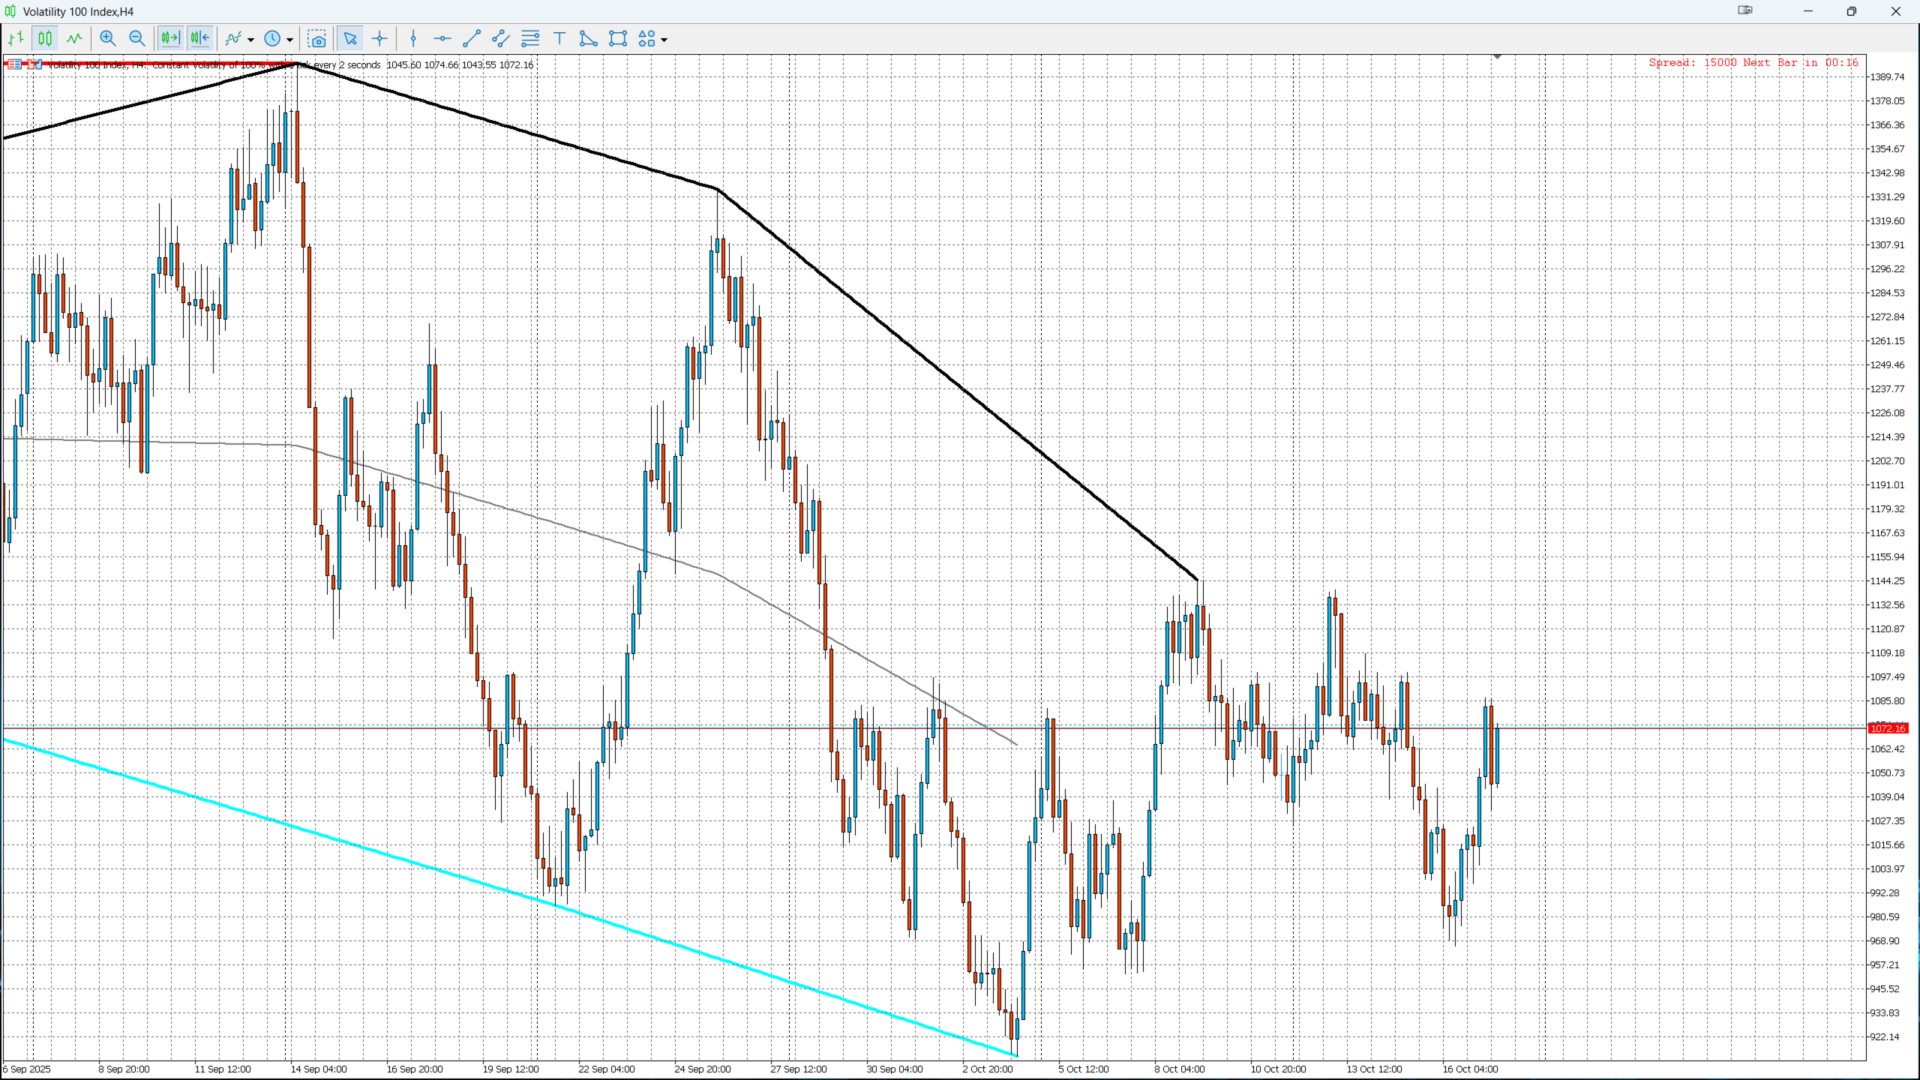
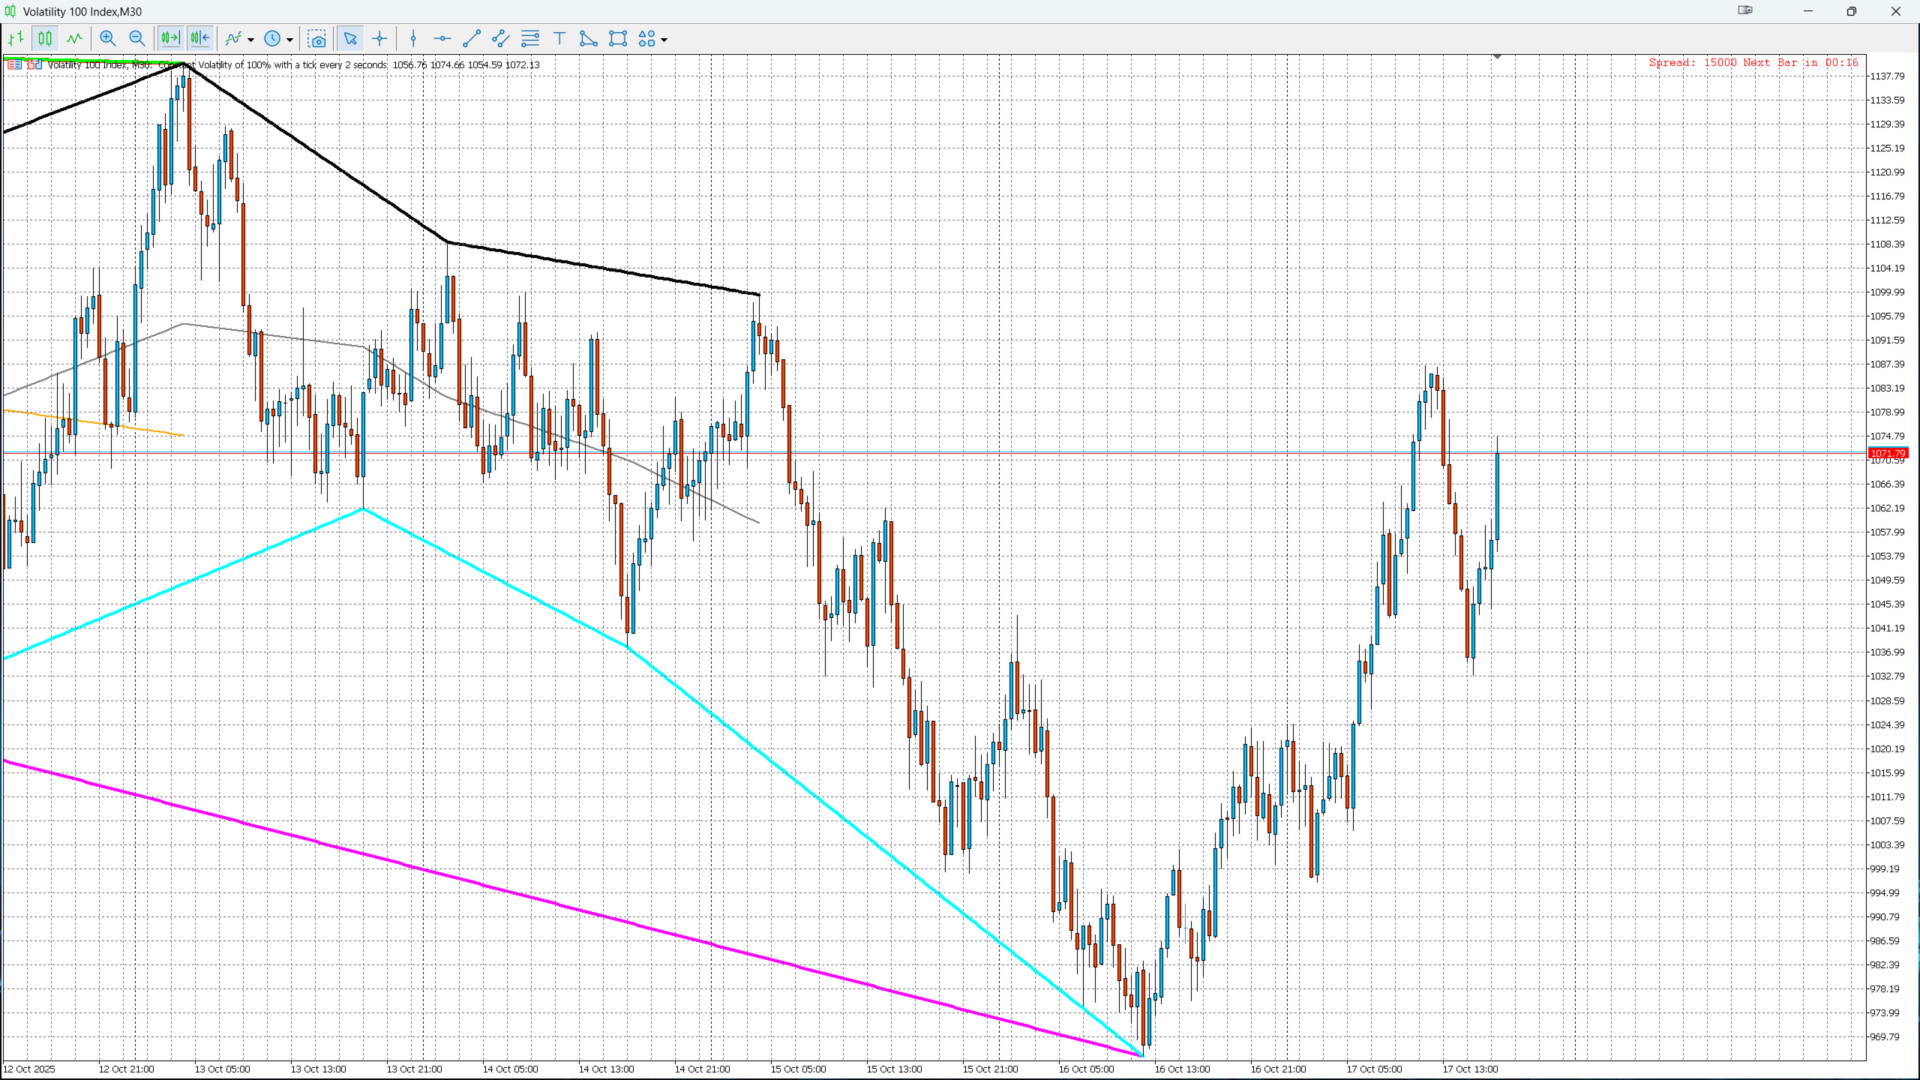
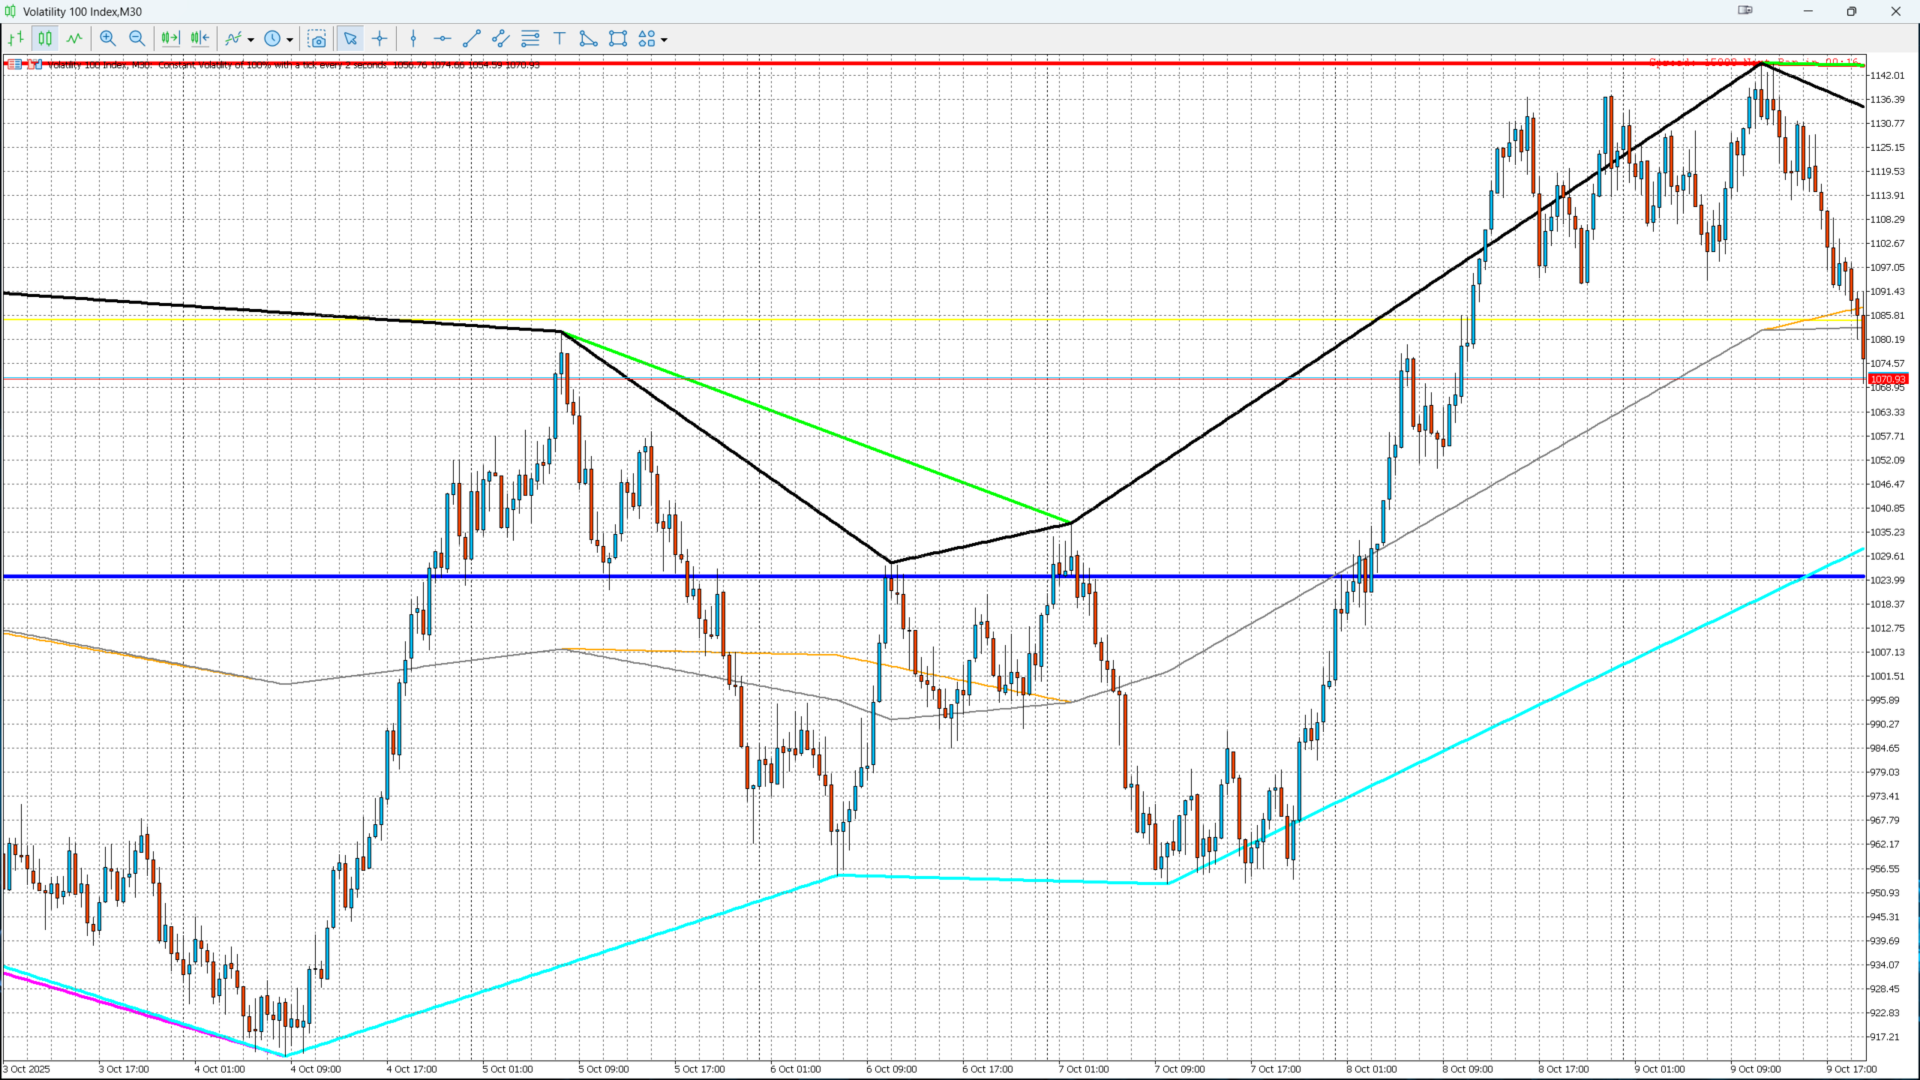
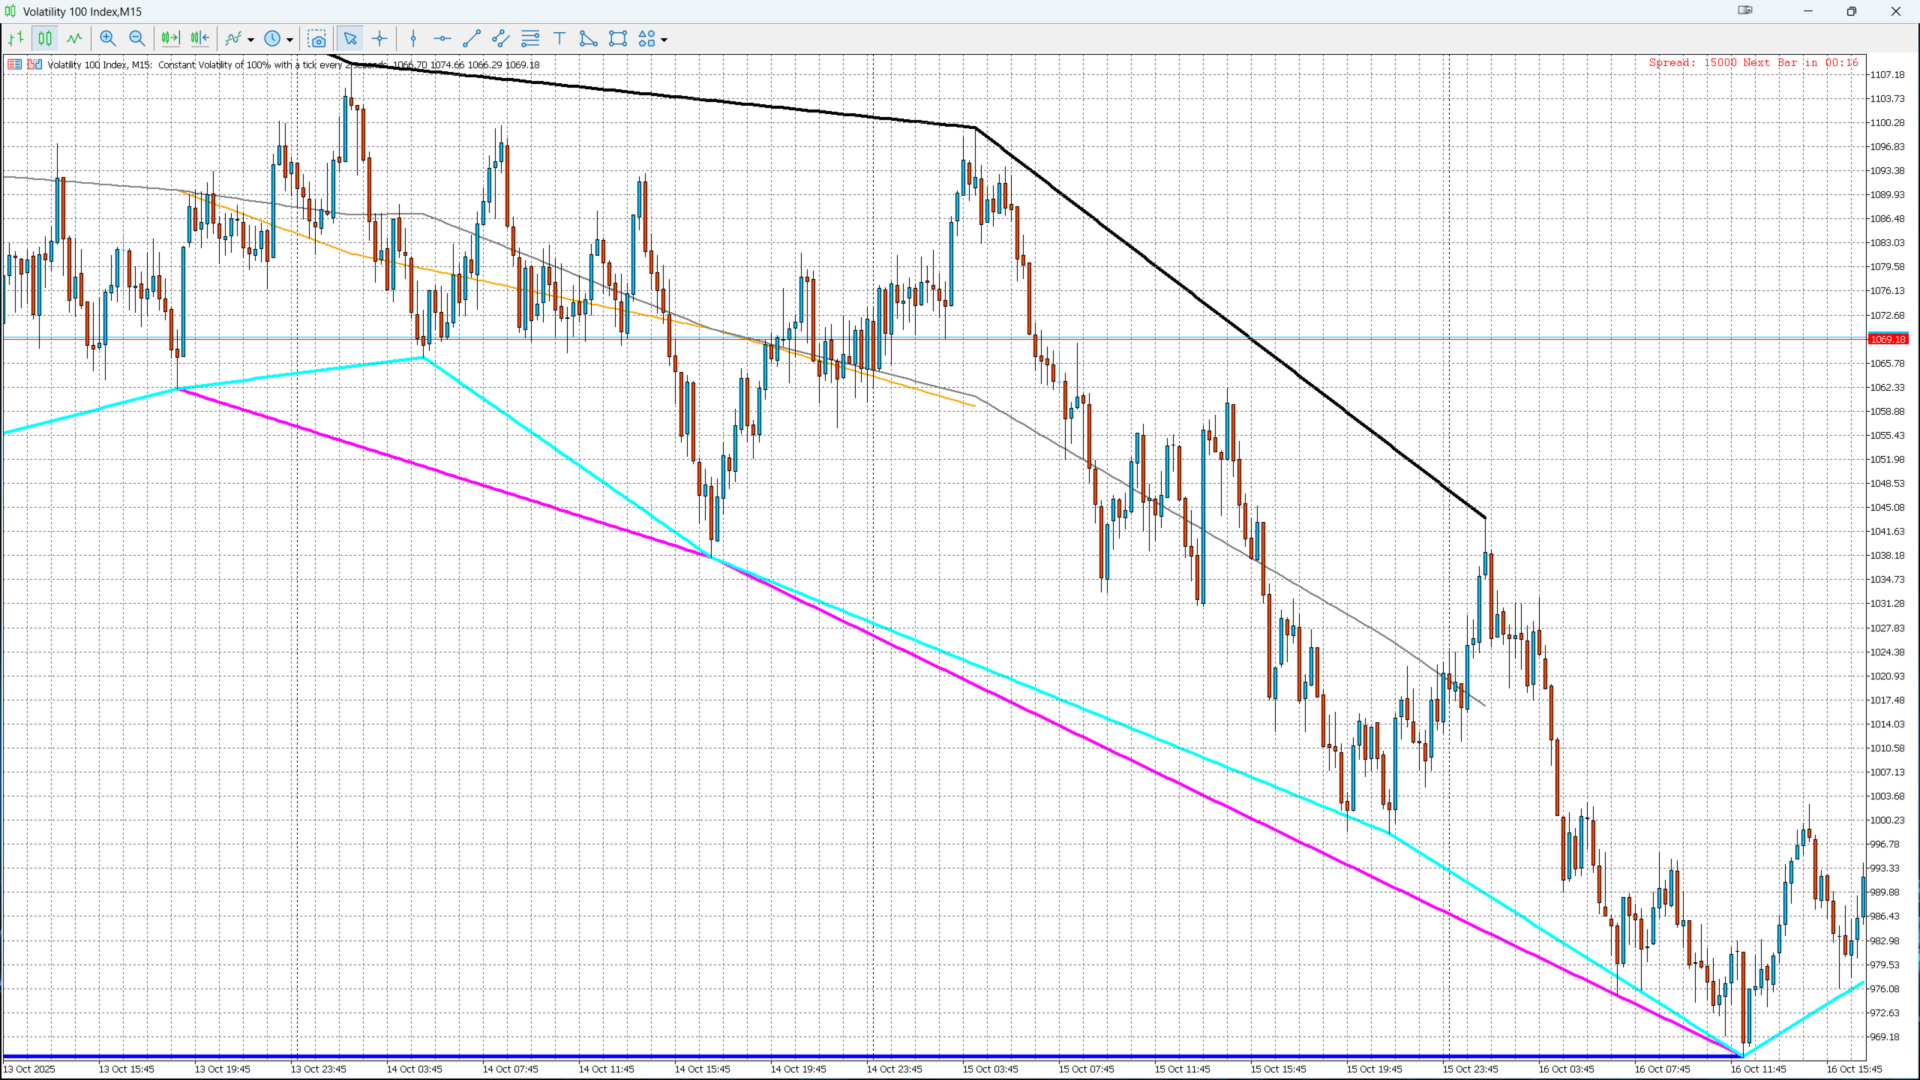
Channel Ultima   est un indicateur avancé qui trace automatiquement   trois canaux dynamiques   du marché.
Il offre une   lecture claire des zones de support, de résistance et d'équilibre   , idéale pour les traders techniques et structurels.

📘   Présentation détaillée

Channel Ultima   détecte et affiche   trois canaux indépendants   associés sur les pivots majeurs et mineurs du marché.
Chaque canal représente une   zone de pression sur le prix   :

  • Canal court terme   pour les mouvements rapides

  • Canal moyen terme   pour les tendances intermédiaires

  • Canal à long terme   pour la structure globale

L'algorithme identifie automatiquement les   points hauts et bas significatifs   , calcule les   lignes hautes, médianes et basses   , et les   étend dynamiquement   pour suivre le flux du marché.

🎯   Objectif et utilité

✅ Visualiser la   structure multi-niveaux du marché
✅ Identifier les   zones de liquidité et de retournement
✅ Guider vos   entrées et sorties sur cassure ou rebond
✅ Confirmer les signaux avec d'autres indicateurs (Kijun, Donchian, FZG)

Channel Ultima   vous donne une   boussole visuelle du prix   , essentielle pour une stratégie structurée.

🧩   Caractéristiques principales

  • 3 canaux indépendants (court, moyen, long terme)

  • Détection automatique des   pivots hauts et bas

  • Lignes Haut / Milieu / Bas   dynamiques

  • Extension automatique jusqu'à la dernière bougie

  • Couleurs distinctes pour une   lecture immédiate

  • Optimisé pour   tous les actifs et délais

  • Léger et rapide, calcul en temps réel

⚙️   Paramètres personnalisables

Paramètre Description
LookbackBars Nombre de barres analysées pour détecter les pivots
Swing Sensibilité de la détection (plus haut = moins de signaux)
ExtendToEdge Active l'extension automatique jusqu'à la dernière bougie
ColorSet Jeu de couleurs pour chaque canal (optionnel)

Chaque canal peut être   ajusté   , offrant une flexibilité totale pour l'analyse du marché.

📈   Utilisation stratégique

  1. Ajoutez   Channel Ultima   sur le graphique de votre actif préféré.

  2. Observez les interactions du prix avec les lignes hautes et basses du canal.

  3. Entrez sur rebond ou cassure selon votre style de trading.

  4. Confirmer les signaux avec d'autres outils ou indicateurs structurels.

💡 Astuce : lorsque les trois canaux pointent dans la même direction, un changement de structure important est souvent imminent.      

🔍 Applications pratiques  

  • Trading de structure / SMC / ICT  

  • Swing trading   et intraday  

  • Analyser plusieurs périodes  

  • Identification des zones de liquidité (Equal High/Low)  

  • Filtrage des fausses cassures

💬 Avantages

✨ Lecture claire et intuitive
🧠 Compréhension immédiate de la structure du marché
⚙️ Paramétrage simple, sans complexité
🚀 Compatible avec tous les styles de trading
📊 Léger et performant sur MT5

🔰 Spécifications techniques

  • Plateforme : MetaTrader 5 (MT5)

  • Actifs : Forex, indices, matières premières, crypto

  • Timeframes : M1 à MN1

  • Dépendances : aucune

  • Auteur : KOUAME N'DA LEMISSA


Produits recommandés
MarketMagnet
Kelly Adediran Raymond
Are you ready to take your trading journey to new heights? Look no further than MarketMagnet, this groundbreaking indicator designed to propel your trading success with excitement and accuracy. Powered by the convergence of Momentum and CCI (Commodity Channel Index), MarketMagnet equips traders with the ultimate tool to determine direction and entry prices for a wide range of recommended currency pairs and instruments. It is designed for traders seeking to scalp for a few pips on lower timeframe
Based on the trading model/strategy/system of gold double-position hedging and arbitrage launched by Goodtrade Brokers, problems encountered in daily operations: 1. Account B immediately places an order immediately following account A. 2: After account A places an order, account B will automatically copy the stop loss and take profit. 3: Account A closes the position of Account B and closes the position at the same time. 4: When account B closes the position, account A also closes the position.
L'indicateur SMC Venom Model BPR est un outil professionnel pour les traders travaillant dans le concept Smart Money (SMC). Il identifie automatiquement deux modèles clés sur le graphique des prix: FVG   (Fair Value Gap) est une combinaison de trois bougies, dans laquelle il y a un écart entre la première et la troisième bougie. Forme une zone entre les niveaux où il n'y a pas de support de volume, ce qui conduit souvent à une correction des prix. BPR   (Balanced Price Range) est une combinaiso
Rule Plotter Expert
Francisco Gomes Da Silva
5 (8)
Cet Expert Advisor a été conçu pour tester et exécuter vos stratégies créées à l'intérieur de l'indicateur Rule Plotter . Comment utiliser : Téléchargez gratuitement l'indicateur Rule Plotter - outil de création de tradesystem sans connaissance en programmation . Ensuite, développez vos stratégies à l'intérieur de l'indicateur Rule Plotter. Enfin, exécutez vos stratégies créées en utilisant cet Expert Advisor. Paramètres : Strategy Votre tradesystem créé à l'intérieur de l'indicateur Rule Plotte
FREE
Manus Pro
Itumeleng Mohlouwa Kgotso Tladi
MANUS PRO EA The Trading Revolution You've Been Waiting For Are you TIRED of watching other traders make consistent profits while your account bleeds red?   The financial markets don't wait for anyone – and neither should you. MANUS PRO isn't just another Expert Advisor... it's your   TICKET TO FINANCIAL FREEDOM . Why MANUS PRO is Different (And Why Everyone's Talking About It) FOR BEGINNERS: Your Trading Mentor That Never Sleeps Zero Learning Curve   – Install, activate, and watch it wo
Manyal trading system, CovEchoTrend Robot, focuses on reliability and flexibility. By employing statistical analysis methods to study the relationships between the base indicator and market patterns, the system enables a deeper understanding of market processes. Intelligent pattern analysis: The application of statistical data processing helps identify key trend reversal points more accurately, signaling significant market shifts. Informed decision-making is based on the intersection of indicato
My PVSR
Ashok Kumar Singha
My PVSR   is based on All Type of Pivot Points. Use this Indicator to get proper Support / Resistance Zone and Trade accordingly.. Recommendation: Use this Indicator along with my another Indicator --->>> Dr. Trend   <<<--- Click Here ; To get the best output result feel free to contact me ; Best of Luck It can be used for: All Pairs: Forex, Cryptocurrencies, Metals, Stocks, Indices etc. All Timeframe All Brokers All type of Trading Style like Scalping, Swing, Intraday, Short-Term, Long-
Introduction to Fractal Pattern Scanner Fractal Indicator refers to the technical indicator that makes use of the fractal geometry found in the financial market. Fractal Pattern Scanner is the advanced Fractal Indicator that brings the latest trading technology after the extensive research and development work in the fractal geometry in the financial market. The most important feature in Fractal Pattern Scanner is the ability to measure the turning point probability as well as the trend probabil
MiniFullIndexTrader
Francisco Eugenio Martoni M De Andrada
FA MiniFullIndexTrader: Scalper versátil para índices mini e completos Este Expert Advisor (EA) é uma estratégia de scalping automatizada para MetaTrader 5, otimizada para contratos de índice como WIN@, WINQ25, WINFUT e WIN$. Ele utiliza rompimentos diários para entradas rápidas, com gerenciamento de risco avançado para proteger o capital. Principais vantagens: Rentável e consistente: Em backtests, gera lucro líquido de até 14.310 pontos com fator de lucro de 1,44 e Sharpe 16,77 (alto retorno p
High Probability Reversal Arrow Indicator The indicator looks for trend exhaustion areas, and plots Buy/Sell arrow after on confirmation of trend exhaustion. Signals can also   be shown as popup alerts, or be sent as e-mail or mobile phone notification. Trades can be taken on breakout of the signal candle. Inputs Signal Type: Aggressive/Normal History Bars : Can be set to 0 (zero) to show all historical signals, or can be set to a limited number of bars for faster execution. Show Alert : True/Fa
Pendiente de Precio
Cesar Juan Flores Navarro
Indicador en base a la pendiente de la linea de precio, dibuja una línea de color cuando sube a base de los precios que previamente has sido procesados o linealizados, y cuando baja la pendiente la linea linealizada toma otro color. En este caso se a considerado 6 lineas de diferentes procesos desde pendientes largas hacia las cortas, observándose que cuando coincidan las pendientes se produce un máximo o mínimo, lo que a simple vista nos permitirá hacer una COMPRA O VENTA.
GorMaster Pro
Manuel Damian Ortiz Fernandez
GorMaster_Pro — Sesgo confiable, noticias y técnica en una sola pantalla Visión GorMaster_Pro es una herramienta indispensable para cualquier tipo de trader (scalper, intradía o swing) porque combina información fundamental y técnica para darte una lectura fiel y accionable del mercado. En una sola vista verás: sesgo direccional BUY/SELL/RANGO , ventanas de noticias en tiempo real que congelan la operativa, métricas técnicas clave (ATR_Z, RangeRatio, ADX, SpreadZ), sesiones y alertas . Todo org
Insight Investor: Advanced Multi-Currency Forex Trading Bot Introduction In the fast-paced world of Forex trading, having the right tools can significantly enhance your trading experience. Insight Investor is an advanced multi-currency trading bot designed to automate and optimize your trading operations. This expert advisor employs modern algorithms to analyze market conditions and execute trades, aiming to deliver consistent results while maintaining controlled risk levels. Key Features of Ins
Description générale Cet indicateur est une version améliorée du Canal Donchian classique, enrichie de fonctionnalités pratiques pour le trading réel. En plus des trois lignes standard (supérieure, inférieure et ligne médiane), le système détecte les cassures et les affiche visuellement avec des flèches sur le graphique, en montrant uniquement la ligne opposée à la direction actuelle de la tendance pour une lecture plus claire. L’indicateur comprend : Signaux visuels : flèches colorées lors des
FREE
Free automatic Fibonacci is an indicator that automatically plots a Fibonacci retracement based on the number of bars you select on the BarsToScan setting in the indicator. The Fibonacci is automatically updated in real time as new highest and lowest values appears amongst the selected bars. You can select which level values to be displayed in the indicator settings. You can also select the color of the levels thus enabling the trader to be able to attach the indicator several times with differe
FREE
Expert. Automatic and manual trading. Ready-made trading system based on Elliott waves and Fibonacci retracement levels . It is simple and affordable. Display of the marking of Elliott waves (main or alternative option) on the chart. Construction of horizontal levels, support and resistance lines, a channel. Superposition of Fibonacci levels on waves 1, 3, 5, A Alert system (on-screen, E-Mail, Push notifications).    visual panel for opening orders in manual trading. visual panel for setting up
The CandleStick Scanner is a tool that allow you to perform a   market scan   and search any candlestick pattern that you already created in the current chart, You can perform a quick search in the current chart (500 bars will be scanned),  This is a lite version of  CandleStick Factory for MT5 . The   full version   video can be found here :  https://www.youtube.com/watch?v=fq7pLXqVO94 The  full version  can be purchased here:   https://www.mql5.com/en/market/product/75434 How it works You can
FREE
BOS Recovey Zone EA
Mohamad Saad Samsudin
The   BOS Recovery Zone EA   is a sophisticated automated trading system that combines Break of Structure (BOS) strategy with robust dual-mode recovery management. Designed for serious traders who demand reliability and advanced risk management, this EA offers unparalleled flexibility with both Netting and Hedging modes to adapt to any broker environment.
FREE
Awesome Oscillator by Bill Williams with the ability to fine-tune and replace the averaging algorithms of the indicator, which significantly expands the possibilities of using this oscillator in algorithmic trading and brings it closer in its properties to such an indicator as the MACD. To reduce price noise, the final indicator is processed with an additional Smooth averaging. The indicator has the ability to give alerts, send mail messages and push signals when the direction of movement of th
"Blow It Up!" – The Trading Indicator That Questions Your Life Choices Tired of boring indicators? Meet your new market companion that delivers:   "YOLO BUY!" arrows   when you should probably panic   Explosive rectangle confetti   (because why not?)   200+ soul-crushing quotes   like   "Your stop loss is imaginary"   and   "This isn’t trading, it’s donating to whales"   Random alerts that roast your strategy This Indicator is like Therapy   – Because daytrading shouldn’t feel
Enigma 112
issam rahhal sabour
دليل استخدام مؤشر Enigma 112 مؤشر Enigma 112 دليل الاستخدام الكامل - الحل الأمثل للتداول المقدمة مؤشر Enigma 112 هو أداة تحليل فني شاملة تجمع بين مفاهيم متقدمة تشمل بوابات Tesla 3-6-9، نظرية Huddleston، نطاقات PO3، وأنظمة متطورة لإدارة المخاطر. بوابات Tesla 3-6-9 تعتمد على رياضيات دوامة نيكولا تسلا لتحديد مستويات الدعم والمقاومة بدقة نظرية Huddleston تحليل هيكل السوق بناءً على الحجم لتحديد المستويات المؤسسية نطاقات PO3 كشف التذبذب السعري والمستويات المؤسسية لدخول دقيق دليل
Limitless MT5
Dmitriy Kashevich
Limitless MT5 is a universal indicator suitable for every beginner and experienced trader. works on all currency pairs, cryptocurrencies, raw stocks Limitless MT5 - already configured and does not require additional configuration And now the main thing Why Limitless MT5? 1 complete lack of redrawing 2 two years of testing by the best specialists in trading 3 the accuracy of correct signals exceeds 80% 4 performed well in trading during news releases Trading rules 1 buy signal - the ap
Liquidity Map
Alex Amuyunzu Raymond
Liquidity Map  Overview The Liquidity Map indicator is an advanced visualization tool based on ICT Smart Money Concepts . It automatically identifies daily Buy Zones , Sell Zones , and Liquidity Levels , showing where price is likely to reverse or continue based on institutional order flow. It calculates key levels from the daily session — such as the previous day’s high, low, and midpoint — then derives a premium (sell bias) and discount (buy bias) structure. When price trades into these mapped
La stratégie Breakout génère des signaux d'entrée sur le marché lorsque le prix franchit la limite d'une certaine fourchette de prix. Pour créer la stratégie, nous avons utilisé les données historiques avec une qualité de 99,9% pour les 15 dernières années. Les meilleurs signaux ont été sélectionnés et les faux signaux ont été filtrés. L'Expert Advisor effectue une analyse technique et ne prend en compte que les cassures qui donnent les meilleurs résultats.  Il utilise un système de filtrage
IndiceXperience
Mateus Silva Marques Dos Santos
Indicador para mercado de Índice Futuro Brasileiro (WIN) __________________________________________________________________________________________________ O indicador trabalha com rompimento de canal indicando o sentido do movimento e os 3 possíveis TP e o SL baseado no ATR. Indicação de utilização em TimeFrame de 5M, mas pode ser utilizado em qualquer tempo gráfico de sua preferencia. __________________________________________________________________________________________________
BREAK RETEST NON-REPAINT. WORKS BEST AT M15 AND ABOVE.  Benefits Fewer false breakouts . Combining close confirmation + retest + previous-close filter greatly reduces noise vs. raw high/low breaks. Tighter execution plans . The drawn level line gives an objective spot for entries, stop placement (just beyond the level), and partial-take-profit structure. Non-repainting confidence . Signals are placed on current bar. Flexible across markets . Works on FX, indices, metals, crypto; scalping on M15
Индикатор "Benefit Predictor" Это высокоточный инструмент для прогнозирования разворота цены на любом финансовом инструменте и любом таймфрейме. Этот продукт появился благодаря годам опыта и исследований в области анализа цен и других временных рядов, используя продвинутые методы машинного обучения и математического анализа. Особенности продукта : Готовая торговая система, подходит как для ручной торговли, так и для использования в торговых роботах. Не перерисовывается после появления сигнала
My Trendline
Ashok Kumar Singha
My Trendline is an Indicator based on Upper and Lower Trendline which will Plot Automatically into the Chart. This Indicator will perfectly indicate you the Trend of the Market. It can be use in any Time Frame. The Indicator will automatically adjust according to the Current Time Frame. Steps to Setup the Indicator: Install the Custom Indicator; Set all the Inputs, Line Color, Width and Styles etc. (Can use the Default Setting also); Set visualization to All Timeframe; and DONE It can
Fvg Edge
Ahmad Meftah Abdulsalam Alawwami
5 (1)
FVG Smart Zones – Édition Gratuite Indicateur de Détection des Gaps de Valeur Juste pour MetaTrader 5 (MT5) Vous recherchez un véritable outil de trading – pas juste un autre indicateur au hasard ? FVG Smart Zones – Édition Gratuite offre une vision professionnelle du marché en détectant automatiquement les Gaps de Valeur Juste (FVG) et en mettant en évidence des zones de trading à haute probabilité directement sur votre graphique. Conçu pour les traders suivant : Smart Money Concepts (
FREE
Gold Crazy EA MT5
Nguyen Nghiem Duy
Gold Crazy EA   is an Expert Advisor designed specifically for trading Gold H1/ EU M15. It use some indicators to find the good Entry. And you can set SL or you can DCA if you want. It can be an Scalping or an Grid/ Martingale depend yours setting. This EA can Auto lot by Balance, set risk per trade. You also can set TP/ SL for earch trade or for basket of trade. - RSI_PERIOD - if = -1, then the default strategy works, if >0, then the RSI strategy works - MAX_ORDERS - to trade with only 1 order,
Les acheteurs de ce produit ont également acheté
AriX
Temirlan Kdyrkhan
1 (4)
AriX Indicator for MT5 A powerful trend-following and signal-evaluation tool AriX is a custom MT5 indicator that combines Moving Averages and ATR-based risk/reward logic to generate clear buy/sell signals. It visualizes dynamic SL/TP levels, evaluates past trade outcomes, and displays win/loss statistics in a clean on-chart panel. Key features include: Buy/Sell signals based on MA crossovers ATR-based SL/TP1/TP2/TP3 levels with visual lines and labels Signal outcome tracking with real-time stat
ARICoins
Temirlan Kdyrkhan
ARICoin is a powerful trading companion designed to generate high-probability entry signals with dynamic TP/SL/DP levels based on volatility. Built-in performance tracking shows win/loss stats, PP1/PP2 hits, and success rates all updated live. Key Features: Buy/Sell signals with adaptive volatility bands Real-time TP/SL/DP levels based on ATR Built-in MA Filter with optional ATR/StdDev volatility Performance stats panel (Success, Profit/Loss, PP1/PP2) Alerts via popup, sound, push, or email Cust
TrendMaestro5
Stefano Frisetti
note: this indicator is for METATRADER4, if you want the version for METATRADER5 this is the link:  https://www.mql5.com/it/market/product/108106 TRENDMAESTRO ver 2.5 TRENDMAESTRO recognizes a new TREND from the start, he never makes mistakes. The certainty of identifying a new TREND is priceless. DESCRIPTION TRENDMAESTRO identifies a new TREND in the bud, this indicator examines the volatility, volumes and momentum to identify the moment in which there is an explosion of one or more of these da
##   ONLY GOLD ##   Тiльки Золото ## **Mercaria Professional Trading Zones - Complete Guide** ## **Mercaria Professional Trading Zones - Повний посібник** ### **How Mercaria Zones Work / Як працюють зони Mercaria** **English:** Mercaria Zones is an advanced trading indicator that identifies high-probability support and resistance areas using ZigZag extremes combined with mathematical zone calculations. The indicator works on multiple timeframes simultaneously, providing a comprehensive view
Obtenez l’indicateur AUX GRATUIT et le support EA   Téléchargement direct — Cliquez ici [ D.I.C.E ] The DICE Indicator  Divergence in Chaos Environment est un outil MT5 spécialisé conçu pour les traders appliquant la théorie des vagues d’Elliott dans le cadre des techniques de Trading Chaos. Il identifie les divergences cachées et régulières du prix, synchronisées avec l’environnement de marché chaotique décrit par Bill Williams. Caractéristiques clés Divergence alignée sur les vagues d’Elliott
Pantera Indicator
Temirlan Kdyrkhan
5 (1)
A tool for on-chart strategy backtesting and performance analysis. A utility for developing, debugging, and testing custom trading ideas and indicator functions. An indicator designed to quickly test trading concepts and visualize the effectiveness of different input parameters. An all-in-one sandbox for testing everything from simple crossovers to complex, multi-condition trading systems.
Hello I Want to introduce The Forex Buy Sell Arrow Premium MT5 i recently release this premium indicator! its 1000% Non Repaint Indicator, It Work Perfectly Well,, i tested it day by day, Just mind blowing Result,  Including Powerful trend Algorithm! How It Work? well, it work market trend formula, when trend Bullish Or when trend Bearish,  Recommend Timeframe M30, H1 it work all timeframe, and all currency pair, 100% non repaint, How to take signal From Forex Buy Sell Arrow Premium Ind
VTrende Pro
Andrii Diachenko
5 (1)
VTrende Pro - MTF indicator for trend trading with a display panel for MT5 *** Videos can be translated into any language using subtitles (video language - Russian) Although the signals of the VTrende Pro indicator can be used as signals of a full-fledged trading system, it is recommended to use them in conjunction with the Bill Williams TS. VTrende Pro is an extended version of the VTrende indicator. Difference between Pro version and VTrende: - Time zones - Signal V - signal 1-2 waves -    S
The Second-Level Tick Candlestick Generator is a professional-grade MT5 indicator tool specifically designed for high-frequency trading and short-term scalping. It can convert raw tick data into highly customizable second-level candlestick charts in real-time, helping traders accurately capture micro-market fluctuations and optimize entry and exit timing. This tool provides clear chart displays, allowing you to more intuitively identify price action patterns and improve trading decision efficien
The Expert Advisor and the video are attached in the Discussion tab . The robot applies only one order and strictly follows the signals to evaluate the indicator efficiency. Pan PrizMA CD Phase is an option based on the Pan PrizMA indicator. Details (in Russian). Averaging by a quadric-quartic polynomial increases the smoothness of lines, adds momentum and rhythm. Extrapolation by the sinusoid function near a constant allows adjusting the delay or lead of signals. The value of the phase - wave s
Классификатор силы тренда. Показания на истории не меняет. Изменяется классификация только незакрытого бара. По идее подобен полной системе ASCTrend, сигнальный модуль которой, точнее его аппроксимация в несколько "урезанном" виде, есть в свободном доступе, а также в терминале как сигнальный индикатор SilverTrend . Точной копией системы ASCTrend не является. Работает на всех инструментах и всех временных диапазонах. Индикатор использует несколько некоррелируемых между собой алгоритмов для класси
FFx Universal Strength Meter PRO is more than a basic strength meter. Instead of limiting the calculation to price, it can be based on any of the 19 integrated strength modes + 9 timeframes. With the FFx USM, you are able to define any period for any combination of timeframes. For example, you can set the dashboard for the last 10 candles for M15-H1-H4… Full flexibility! Very easy to interpret... It gives a great idea about which currency is weak and which is strong, so you can find the best pai
The FFx Universal MTF alerter shows on a single chart all the timeframes (M1 to Monthly) with their own status for the chosen indicator. 9 indicators mode (MACD-RSI-Stochastic-MA-ADX-Ichimoku-Candles-CCI-PSAR). Each can be applied multiple times on the same chart with different settings. Very easy to interpret. Confirm your BUY entries when most of the timeframes are showing green color. And confirm your SELL entries when most of the timeframes are showing red color. 2 Alert Options : input to s
The FFx Watcher PRO is a dashboard displaying on a single chart the current direction of up to 15 standard indicators and up to 21 timeframes. It has 2 different modes: Watcher mode: Multi Indicators User is able to select up to 15 indicators to be displayed User is able to select up to 21 timeframes to be displayed Watcher mode: Multi Pairs User is able to select any number of pairs/symbols User is able to select up to 21 timeframes to be displayed This mode uses one of the standard indicators
FFx Patterns Alerter gives trade suggestions with Entry, Target 1, Target 2 and StopLoss .... for any of the selected patterns (PinBar, Engulfing, InsideBar, OutsideBar) Below are the different options available: Multiple instances can be applied on the same chart to monitor different patterns Entry suggestion - pips to be added over the break for the entry 3 different options to calculate the SL - by pips, by ATR multiplier or at the pattern High/Low 3 different options to calculate the 2 TPs -
MetaTrader 4 version available here : https://www.mql5.com/en/market/product/24881 FFx Basket Scanner is a global tool scanning all pairs and all timeframes over up to five indicators among the 16 available. You will clearly see which currencies to avoid trading and which ones to focus on. Once a currency goes into an extreme zone (e.g. 20/80%), you can trade the whole basket with great confidence. Another way to use it is to look at two currencies (weak vs strong) to find the best single pairs
MetaTrader 4 version available here: https://www.mql5.com/en/market/product/25793 FFx Pivot SR Suite PRO is a complete suite for support and resistance levels. Support and Resistance are the most used levels in all kinds of trading. Can be used to find reversal trend, to set targets and stop, etc. The indicator is fully flexible directly from the chart 4 periods to choose for the calculation: 4Hours, Daily, Weekly and Monthly 4 formulas to choose for the calculation: Classic, Camarilla, Fibonac
WanaScalper
Isaac Wanasolo
1 (1)
A scalping indicator based on mathematical patterns, which on average gives signals with relatively small SL, and also occasionally helps to catch big moves in the markets (more information in the video) This indicator has three main types of notifications: The first type warns of a possible/upcoming signal on the next bar The second type indicates the presence of a ready signal to enter the market/open a position The third type is for SL and TP levels - you will be notified every time price re
Индикатор Coefficient Of Determination (COD) представляет собой значение коэффициента детерминации или квадрат коэффициента корреляции между зависимой переменной — ценой и объясняющей переменной — тиковым объемом. Что это дает нам на практике? COD отлично распознает кульминацию трендовых движений, что позволяет подбирать оптимальные точки и ловить развороты рынка. Как использовать индикатор: Наиболее популярная торговая стратегия строится совместно с трендовым индикатором Moving Average (MA), пе
Fibonacci Multiple 12
Cesar Juan Flores Navarro
Fibonacci Múltiple 12, utiliza la serie fibonacci plasmado en el indicador fibonacci, aumentadolo 12 veces según su secuencia. El indicador fibonacci normalmente muestra una vez, el presente indicador se mostrara 12 veces empezando el numero que le indique siguiendo la secuencia. Se puede utilizar para ver la tendencia en periodos cortos y largos, de minutos a meses, solo aumentado el numero MULTIPLICA.
Recommended TimeFrame >= H1. 100% Non Repainted at any moment.  Use it carefully, only with Trend Direction. Trading Usage: 2 Variants: as Range System or as BreakOut System (Both Only With Trend Direction)::: (Always use StopLoss for minimise Risk); [1] as Range System: (Recommended) in UP TREND:  - BUY in Blue Line , then if price goes down by 50 points (on H1) open Second BUY.   Close in any Profit you wish: TrailingStop(45 points) or Close when Price touches upper Gold Line. in DOWN TREND
En base a cálculos matemáticos de determino una linea Horizontal que cruza a todas las señales de trading, mostrando los máximos y mínimos. La linea horizontal parte en dos las subidas y bajadas de las señales de trading, de tan manera que es fácil identificar los máximos y mínimos, y es inteligente por que es sensible a las subidas y bajadas, afín de no quedarse en un solo lado por siempre, trabaja excelentemente con otros indicadores suavizadores ya que les garantiza que en un intervalo de tie
Spike Detector
Tete Adate Adjete
this indicator is a Spike detector indicator, it is specially designed to trade Boom 1000, Boom 500, Crash 1000 and Crash 500 We recommend using it on Deriv Boom and Crash indices only Its setting is intuitive, familiar, easy to use it has notification functions; audible notifications and push notifications. this tool is simple to use, easy to handle This update is based on different strategies for spikes
The indicator tracks the trend in 5 different chart times for the same asset, based on 6 signals for each chart time. The main objective of the indicator is to show us the majority trend of the financial asset in which it was placed. The system transmits the information of the trends in several graphical times, in this way the user is able to have a wide view of the movement of the asset, this type of tool makes the user have a higher hit rate by helping the operator to execute orders in favo
Panel Visao axetrend
Danilo Maia Siqueira
trend view panel; AutoSignals Trend The indicator tracks the trend in 5 different chart times for the same asset, based on 6 signals for each chart time. The main objective of the indicator is to show us the majority trend of the financial asset in which it was placed. The system transmits the information of the trends in different graphic times, in this way the user is able to have a wide view of the movement of the asset, this type of tool makes the user have a higher hit rate by helping
Escalera Inteligente
Cesar Juan Flores Navarro
Indicador en MQL5, recibe la información del precio SUAVIZADO, lo procesa anulando los picos inteligentemente, y el resultado lo envía al desarrollo de la escalera que iniciara y subirá o bajara según el peldaño o INTERVALO ingresado Ingreso PERIODO = 50 (variar segun uso) Ingreso MULTIPLICA AL PERIODO = 1 (variar segun uso) Segun la configuración la escalera puede pegarse o separarse de los precios,, Se aplica toda la linea de tiempo, y a todas las divisas, etc.  
Fibonacci Suavizado
Cesar Juan Flores Navarro
Indicador en MQL5, que obtiene el promedio de 10 EMAS, que son alineadas según Fibonacci, obteniendo un promedio, que sera suavizado.  Se puede ingresar un numero desde 2 a N, que multiplica a los EMA-Fibonacci. Funciona en cualquier criptomoneda, etc. etc... pudiendo calcular el futuro segun la tendencia de las EMAS. Funciona excelentemente en tramos largos, determinando exactamente el mejor inicio/salida. El precio inicial por apertura sera por un periodo de tiempo, luego aumentará.
QuantXSTocks Trading Range Indicator for MT5: INSTRUCTIONS TO USE OUR INDICATOR:- User needs to take trade on Arrow or after an Arrow CandleStick, You can achieve up-to 35-125 pips target by this Indicator. Best Timeframes for Stocks and Indices are M30 and H1: AMAZON M30 (50 pips) TESLA M30 (50 pips) APPLE M30 (50 pips) ADOBE M30 (50 pips) NASDAQ100 H1 (125 pips) The above are the approximate amount of pips you can achieve by this Indicator, Green arrow appears to be buy arrow while the Red ar
Super Suavizador
Cesar Juan Flores Navarro
Indicador en MQL5 que obtiene el promedio de 10 EMAS que son alineadas y procesadas según Fibonacci luego el promedio es suavizado"  Se ingresa un número de 2 a N que multiplica los EMA-Fibonacci y por consiguiente aumenta los fibonacci, resultando un promedio.   Se ingresa un número que suaviza los EMA-Fibonacci. Considerando los números 1/1 seria la suavización minima. Considerando los números 3/5 seria la suavización media. Considerando los números 10/30 seria la suavización alta.....etc
Trend and Signals MT5  indicator scans  30 trading Instruments (Forex, Metals and Indices).     It uses special algorithm on the  current market   based on   Pure Price Action   and display the overall trend and signal on the dashboard. When signals are produced the indicator sends alert and notification. Strategy for Signals This indicator uses the daily timeframe to determine the direction of the trend. The hourly timeframe is used to identify possible entries. Main trend and is determined by
Plus de l'auteur
Canal H Pro
N'da Lemissa Kouame
Français – Canal H Pro Nom : Canal H Pro – Support, Résistance & Breakout Description courte : Indicateur premium affichant trois lignes dynamiques (haute, basse, médiane) . Idéal pour Breakout, Range et suivi de tendance. Description complète : Rouge (Haute) → résistance dynamique Bleue (Basse) → support dynamique Jaune (Médiane) → équilibre et filtre de tendance Période et couleurs personnalisables Compatible toutes stratégies et unités de temps Canal H Pro – repérez les zones clés et prenez
NuageTrend Pro
N'da Lemissa Kouame
Nuage Trend Pro – Suivi de Tendance & Signaux Kijun Nuage Trend Pro est un indicateur avancé pour MetaTrader 5 , conçu pour détecter les tendances fortes et les points d’entrée optimaux grâce au croisement de la Kijun . Il transforme vos graphiques en cartes visuelles instantanées pour trader avec précision et confiance. Fonctionnalités principales Croisement de Kijun automatique : repère immédiatement les moments clés où le prix franchit la ligne de base. Nuage de tendance dynamique : col
Weekly Levels Pro
N'da Lemissa Kouame
Description – Weekly Levels Pro Weekly Levels Pro – Niveaux Clés Hebdomadaires est un indicateur simple et efficace pour MetaTrader 5, conçu pour afficher automatiquement les quatre niveaux les plus importants de chaque semaine de trading : Plus haut de la semaine (Weekly High) → zone de résistance naturelle Plus bas de la semaine (Weekly Low) → zone de support naturel Prix d’ouverture de la semaine (Weekly Open) → point de référence de tendance Prix de clôture de la semaine (Weekly Close) →
Pin Bar Pro v1
N'da Lemissa Kouame
Pin Bar Pro v1.0 – Indicateur MQL5 Description générale Pin Bar Pro est un indicateur professionnel pour MetaTrader 5 qui détecte automatiquement les Pin Bars , une formation de bougie japonaise cruciale pour anticiper les retournements du marché. Grâce à cet indicateur, les traders peuvent identifier rapidement les points d’entrée potentiels en achat ou en vente sans avoir à analyser manuellement chaque bougie. Les signaux sont affichés directement sur le graphique sous forme de flèches clair
Monthly Levels Pro
N'da Lemissa Kouame
Monthly Levels Pro v1.0 – L’indicateur ultime des niveaux mensuels du marché Maîtrisez les niveaux clés du marché en un coup d’œil Monthly Levels Pro est l’outil indispensable pour tous les traders souhaitant analyser les tendances à long terme et repérer rapidement les zones clés de support et de résistance . Cet indicateur affiche les niveaux High (Haut), Low (Bas), Open (Ouverture) et Close (Fermeture) d’une bougie mensuelle, révélant instantanément les zones où le prix est susceptible de ré
Indicateur Monthly Levels + Pin Bar Pro Description L’indicateur Monthly Levels + Pin Bar Pro combine la puissance des niveaux clés mensuels (High, Low, Open, Close) avec la détection automatique des figures de retournement Price Action (Pin Bars) . Conçu pour les traders techniques et institutionnels, il permet d’anticiper les zones de réaction du marché et de générer des signaux visuels clairs directement sur le graphique. Fonctionnalités principales Niveaux mensuels automatiques :
Yearly Levels Pro
N'da Lemissa Kouame
Yearly Levels Pro v1.0 – Indicateur annuel de support et résistance Version : 1.0 Développeur : KOUAME N'DA LEMISSA Plateforme : MetaTrader 5 (MT5) Type : Indicateur technique / Zones de prix annuelles Description générale Yearly Levels Pro v1.0 , développé par KOUAME N'DA LEMISSA , est un indicateur puissant qui permet aux traders d’identifier rapidement les niveaux clés annuels du marché. Il calcule automatiquement les prix Open, High, Low et Close d’une année spécifique et les affiche directe
Quarterly Levels Pro v1.0 – Notice Commerciale Nom du produit : Quarterly Levels Pro v1.0 Développeur : KOUAME N'DA LEMISSA Version : 1.0 Description : Quarterly Levels Pro , développé par KOUAME N'DA LEMISSA , est un indicateur professionnel pour MetaTrader 5 qui affiche automatiquement les niveaux High, Low, Open et Close d’une période trimestrielle. Il permet aux traders de visualiser clairement les zones clés de support et résistance sur le graphique, facilitant la prise de décision pour les
Notice Commerciale – MQL5 Market Multi-Timeframe Levels Pro v1.0 Développeur : KOUAME N’DA LEMISSA Description Multi-Timeframe Levels Pro v1.0 est un indicateur puissant qui trace automatiquement les niveaux clés Daily, Monthly, Quarterly et Yearly (High, Low, Open, Close) directement sur votre graphique. Ces niveaux historiques sont utilisés par les traders professionnels pour identifier : Les zones de support et résistance majeures Les points de retournement probables Les zones de breakout
Marubozu Pro MT5
N'da Lemissa Kouame
Notice Commerciale – Marubozu Pro (MT5) Description Marubozu Pro est un indicateur professionnel pour MetaTrader 5 qui détecte automatiquement les bougies Marubozu (haussières et baissières) directement sur votre graphique. Il vous aide à identifier les zones de force du marché, là où les acheteurs ou les vendeurs prennent totalement le contrôle, en affichant des flèches visuelles d’achat et de vente. Cet outil est conçu pour être simple, efficace et rapide , idéal pour le trading manuel ou c
ETE Detector – Head & Shoulders Indicator Transformez vos graphiques en opportunités de trading claires et visuelles ! À propos de l’indicateur L’indicateur ETE Detector détecte automatiquement les figures Épaule-Tête-Épaule (ETE) et ETE inversées (ETEi) , les configurations classiques de retournement de tendance. Fini les heures passées à chercher manuellement les figures : votre analyse devient rapide, précise et visuelle . Ce que vous obtenez Détection automatique des figures de retourn
Fusion Monthly Levels + PinBar + Marubozu Description Cet indicateur unique combine trois outils puissants de l’analyse technique en un seul : Niveaux mensuels (High, Low, Open, Close) – pour repérer les zones clés de support et de résistance. Détection des PinBars – figure de retournement fiable signalant des rejets de prix. Détection des Marubozu – bougies de tendance fortes indiquant un momentum directionnel. Grâce à cette fusion, vous obtenez un outil visuel, complet et réactif pour an
ABCD Lemissa + Monthly Levels + PinBar + Marubozu Indicator Description Cet indicateur fusionne plusieurs outils puissants pour fournir une vision complète du marché : ABCD Lemissa – Détecte automatiquement les structures ABCD avec points A, B, C et D , zones de support/résistance, et flèches d’achat/vente. Monthly Levels – Affiche les niveaux High, Low, Open, Close des bougies mensuelles pour repérer les zones clés. PinBar & Marubozu – Détecte les bougies PinBar (signaux d’inversion) et Maru
Order Block Pro (MQL5) – Version 1.0 Auteur : KOUAME N'DA LEMISSA Plateforme : MetaTrader 5 Description : Order Block Pro est un indicateur avancé conçu pour détecter automatiquement les Order Blocks haussiers et baissiers sur votre graphique. Grâce à une analyse précise des bougies de consolidation et des bougies suivantes de forte impulsion, cet indicateur vous permet d’identifier les zones clés où les mouvements de prix sont susceptibles de s’accélérer. Cet outil est parfait pour les traders
ETE Detector v4.0 (Head & Shoulders) Auteur : KOUAME N’DA LEMISSA Version : 4.0 Plateforme : MetaTrader 5 Type d’indicateur : Graphique / Signaux de trading visuels Description générale L’ ETE Detector v4.0 est un indicateur technique conçu pour identifier automatiquement les figures chartistes “Épaule-Tête-Épaule” (ETE) classiques et inversées sur les graphiques MT5. Ces motifs sont largement utilisés pour anticiper les retournements de tendance. Grâce à cet outil, les traders peuvent : Détecte
DÉTECTEUR DE PUISSANCE ETE v5.0 (Head & Shoulders Pro) Détection Automatique des Figures "Tête et Épaules" L'indicateur ETE DETECTOR POWER v5.0 est un outil professionnel conçu pour les traders qui souhaitent anticiper les retours majeurs du marché grâce à l'une des figures chartistes les plus puissantes : la Tête et Épaules (ETE) et sa variante inversée. Grâce à son système optimisé et intelligent de gestion d'objets (MaxObjects) , l'indicateur reste fluide et lisible, même sur des graphiqu
Dynamique mensuelle des plages hautes et basses v1.0 Auteur : KOUAME N'DA LEMISSA Description : L'indicateur Monthly High & Low Range Dynamique affiche les niveaux clés d'un mois sur votre graphique, avec des fonctionnalités avancées de suivi dynamique. Il permet de visualiser facilement les zones de support et de résistance mensuelles, ainsi que les zones où le prix tend à dépasser ou à tester ces niveaux, offrant ainsi des opportunités de trading précis. Fonctions principales : Mensu
Monthly High & Low Range Dynamique + Liquidity Zones v1.2 Auteur : KOUAME N'DA LEMISSA Description : Transformez votre analyse du marché avec cet indicateur puissant qui combine : Niveaux Mensuels Clés : High, Low, Open et Close pour identifier les zones de support et résistance les plus importantes. High/Low Range Dynamique : Suivi automatique des variations extrêmes pour détecter les mouvements de prix significatifs. Zones de Liquidité : Rectangles visuels indiquant les zones où les liquidités
Booster Trading Pro Auteur : KOUAME N'DA LEMISSA Plateforme : MetaTrader 5 Type : Indicateur technique multifonction Description Transformez votre analyse de marché avec Booster Trading Pro , l'indicateur tout-en-un qui combine plusieurs outils essentiels pour les traders : Niveaux mensuels clés : haut, bas, ouverture et clôture pour identifier rapidement les zones de support et de résistance. Plage dynamique haute et basse : suivez les mouvements extrêmes des prix au-dessus ou en dessous des
StructureBlocksAuto + MensuelOU Puissance structurelle + précision mensuelle Description Fusion StructureBlocksAuto + MonthlyOR est un indicateur avancé tout-en-un combinant la lecture structurelle du marché (Swing High/Low + blocs automatiques) et la plage d'ouverture mensuelle (Monthly Open Range) . Il permet d'analyser les zones de support/résistance dynamiques , les structures de tendance , et les niveaux clés mensuels , pour une lecture claire du marché et des points d'entrée précis. C
Carte de liquidité institutionnelle Pro Découvrez où les grandes institutions déclenchent leurs mouvements majeurs Présentation Institutional Liquidity Map Pro est un indicateur professionnel conçu pour cartographier les zones de liquidité institutionnelle à partir des hauts et bas mensuels . Il identifie automatiquement les zones de chasse aux stop-loss , les points de retour probables et les zones d'accumulation/distribution utilisées par les grandes institutions. Grâce à un système de dé
Filtrer:
Aucun avis
Répondre à l'avis