Quarterly Levels Pro
- インディケータ
- N'da Lemissa Kouame
- バージョン: 1.0
- アクティベーション: 5
. Japanese Version (日本語)
Quarterly Levels Pro v1.0 – 商業通知
製品名:
Quarterly Levels Pro v1.0
開発者:
KOUAME N'DA LEMISSA
バージョン:
1.0
説明:
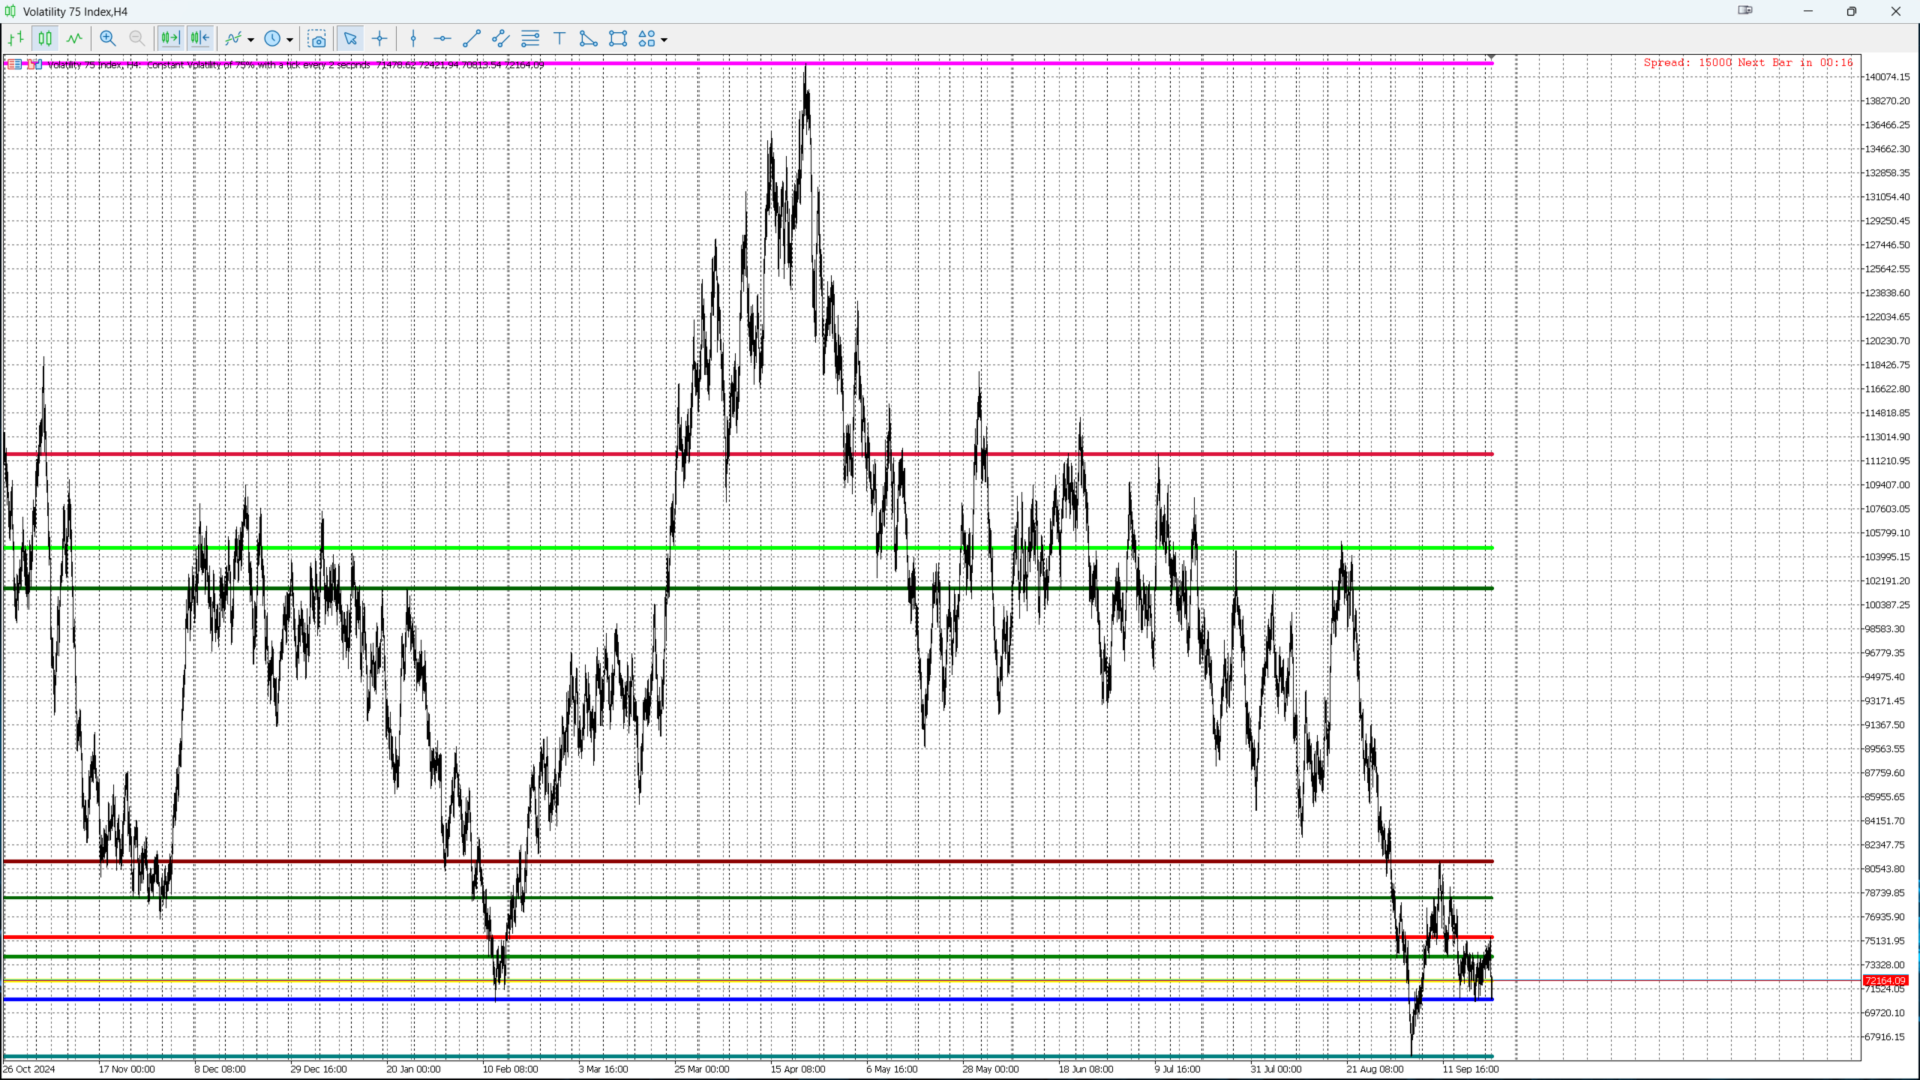
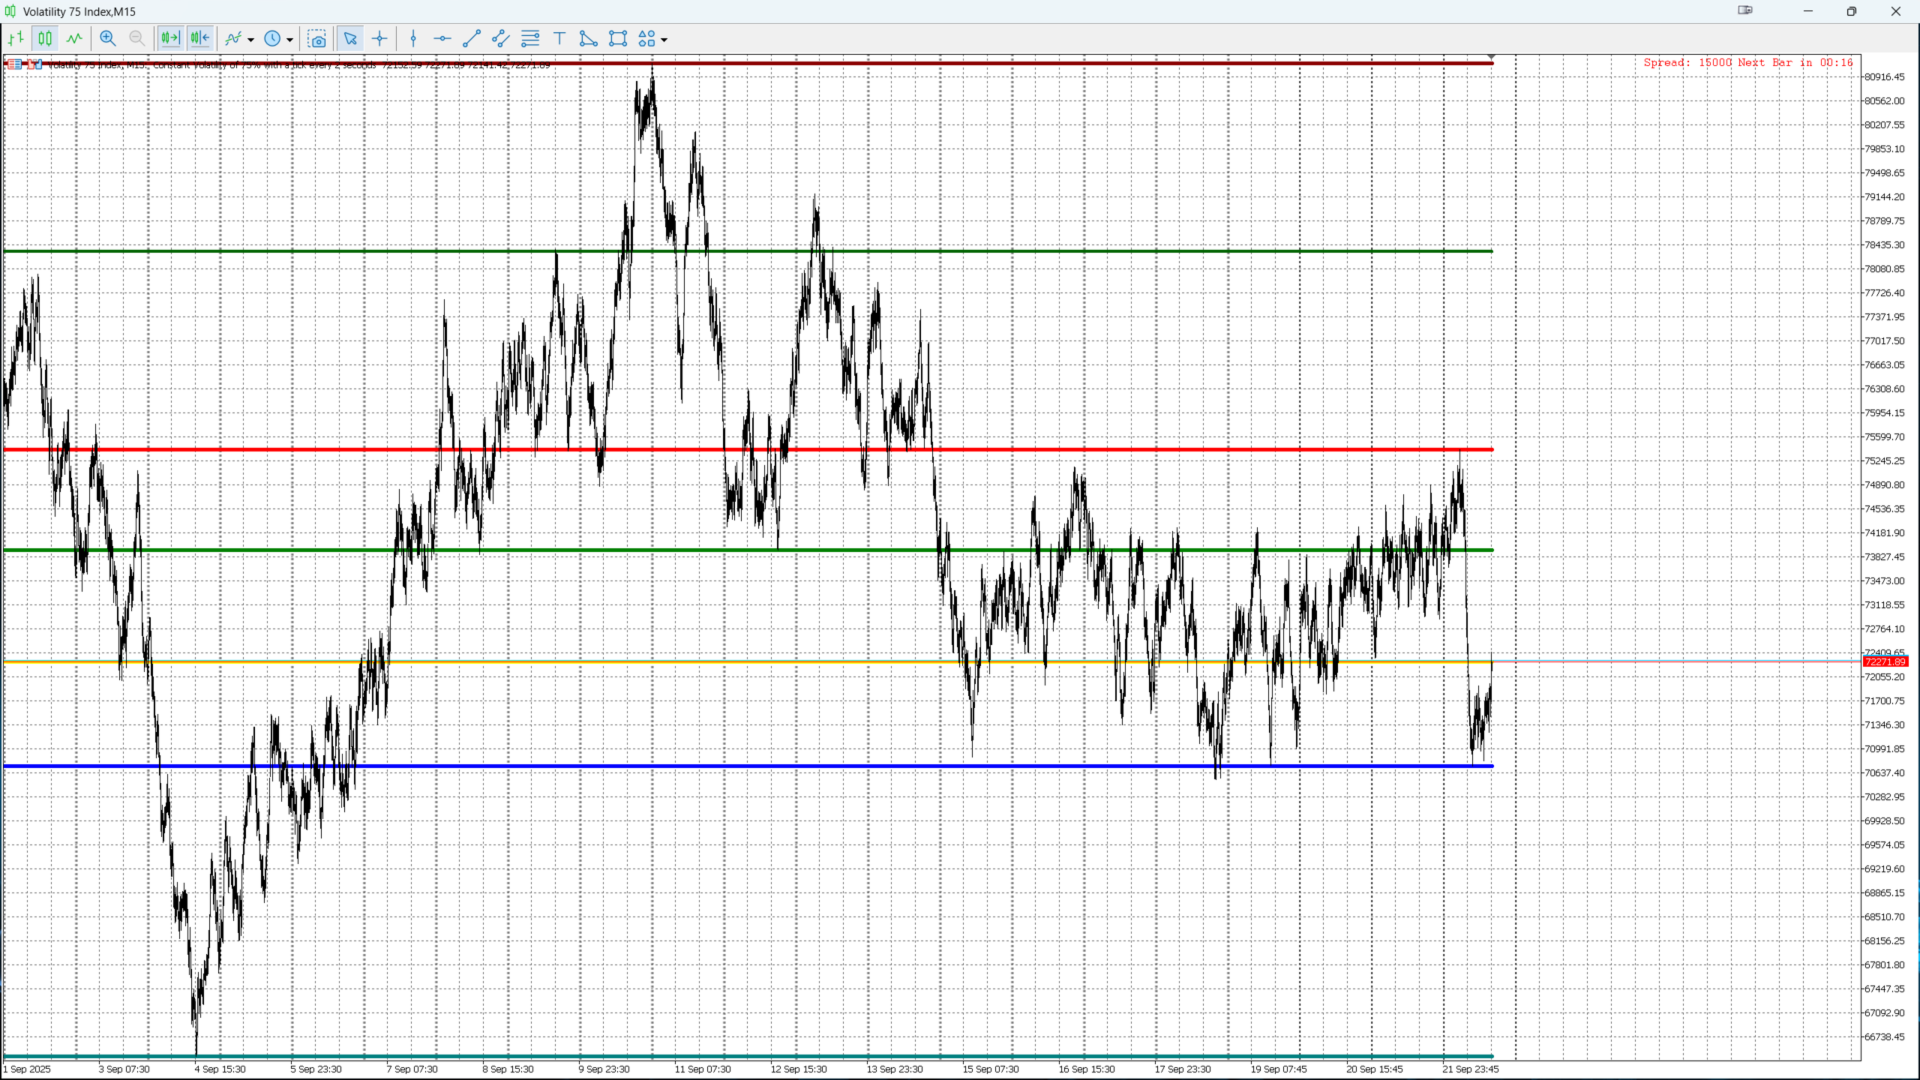
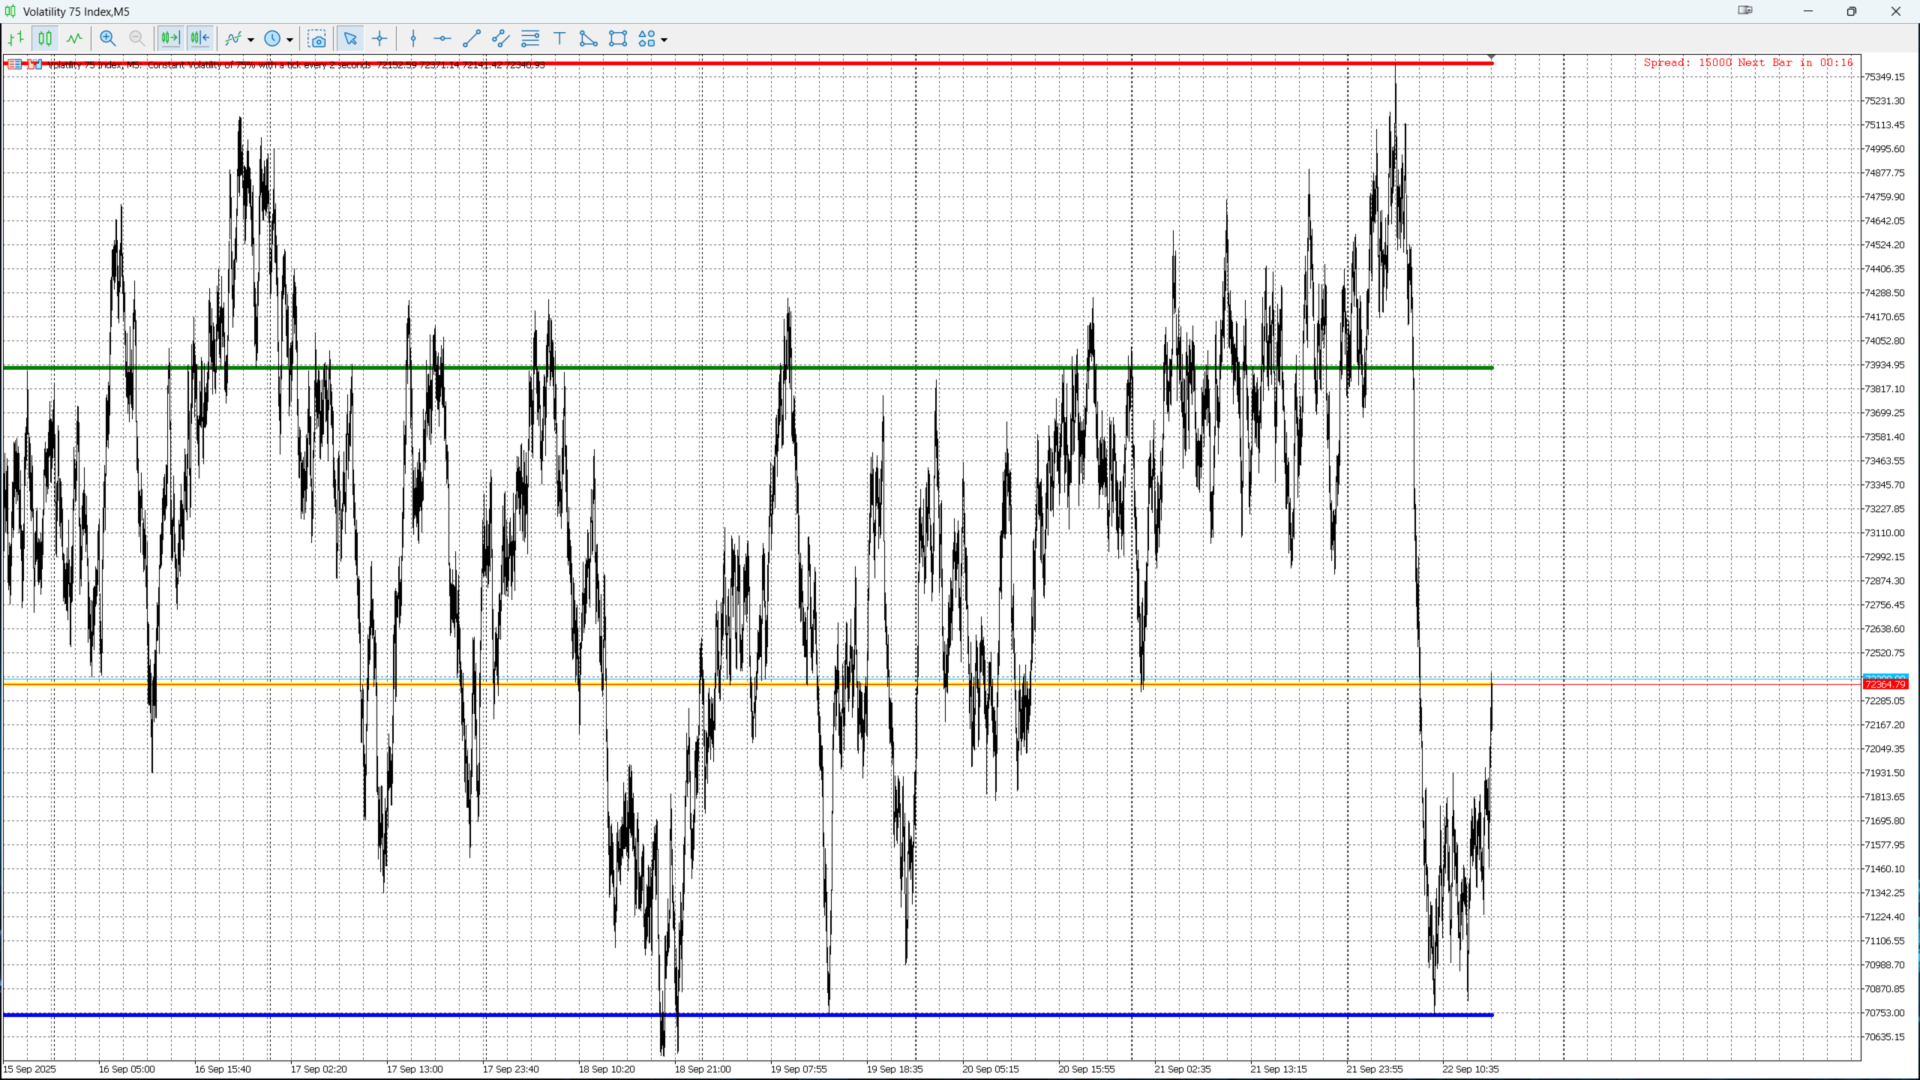
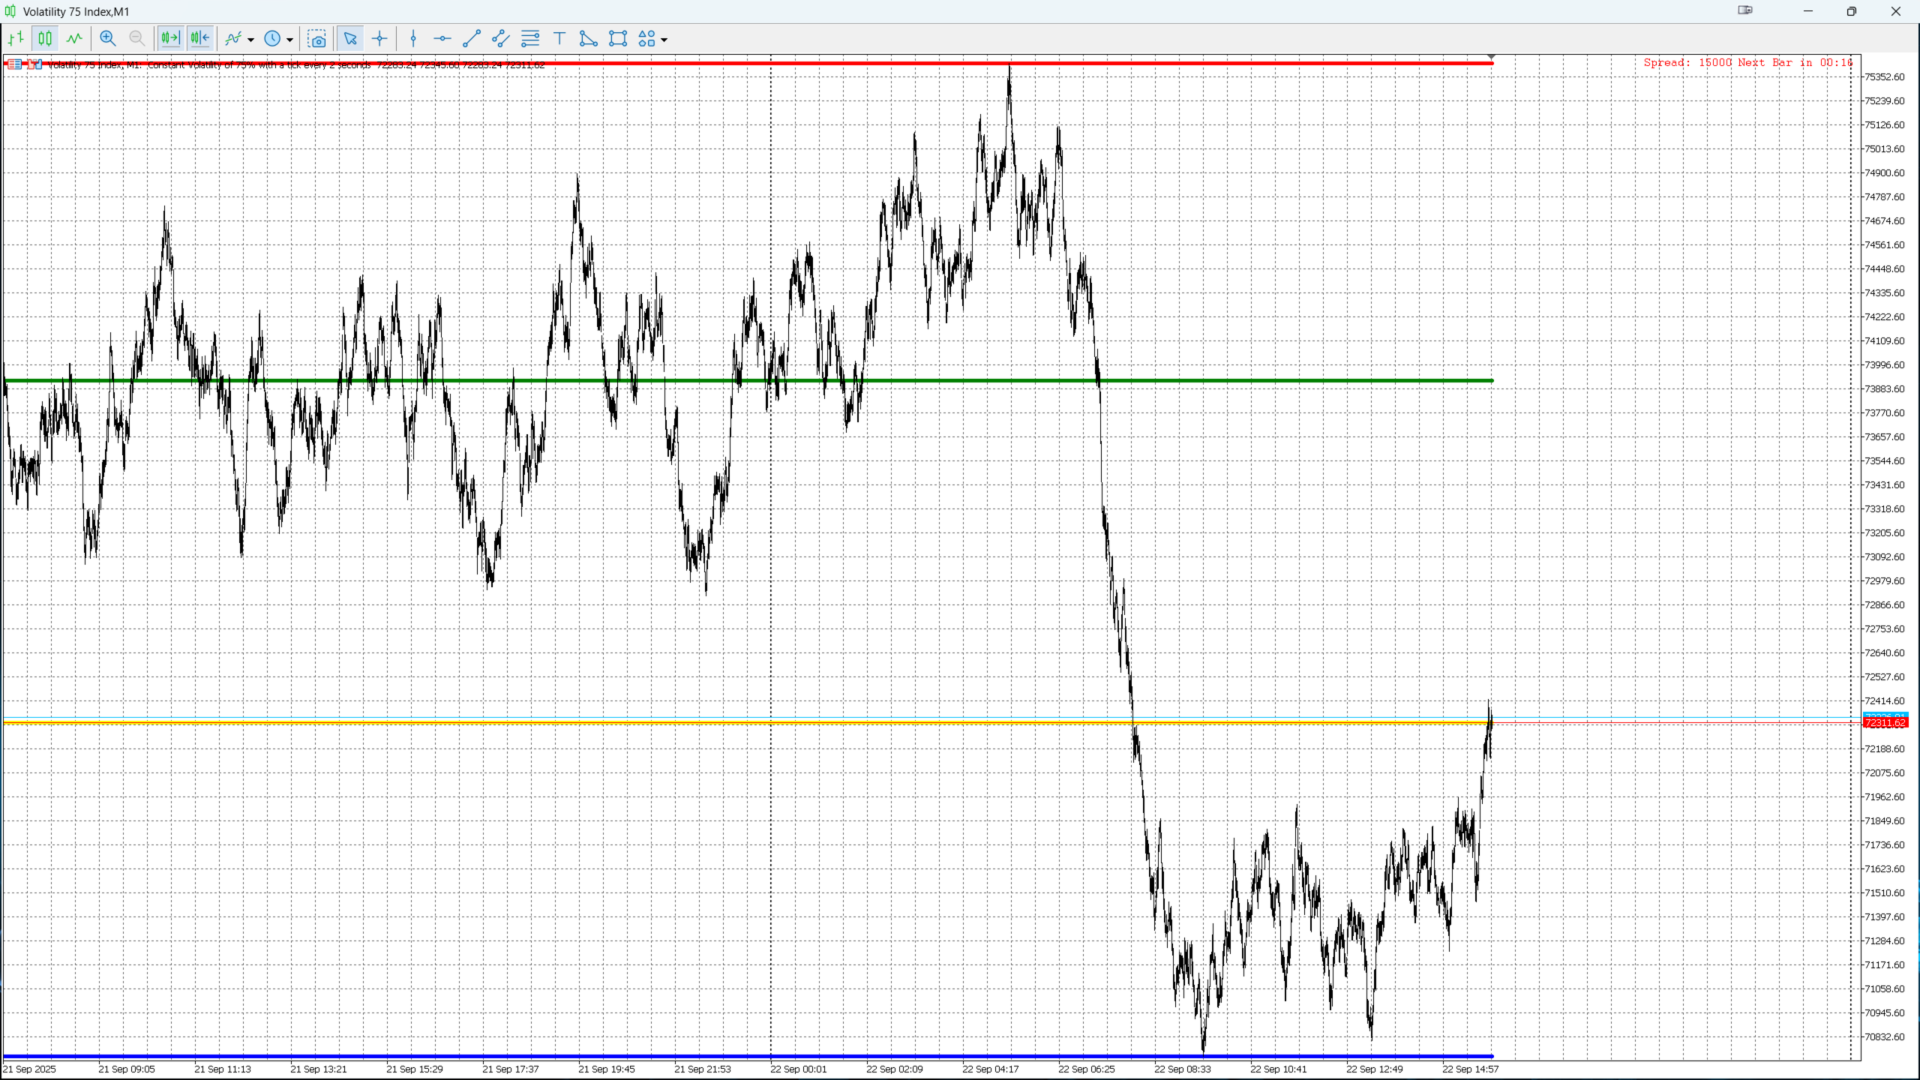
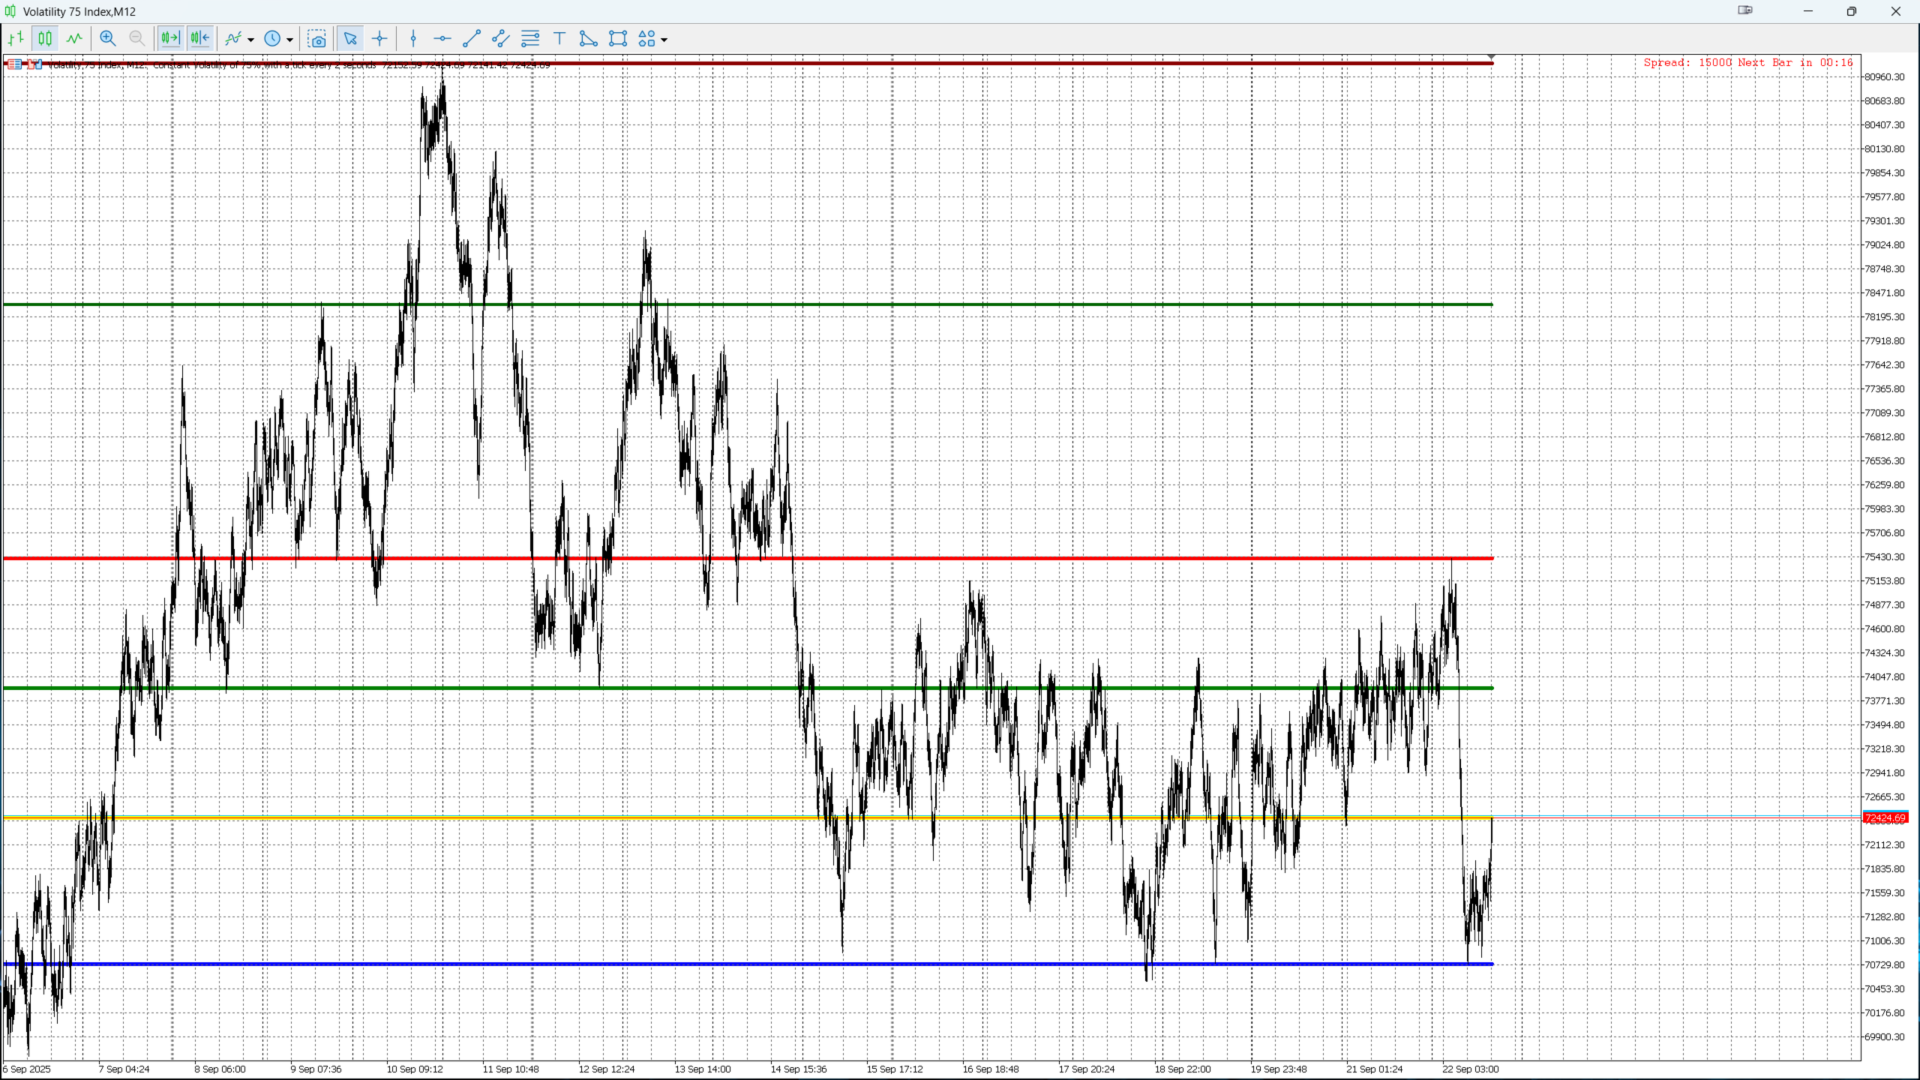
Quarterly Levels Pro は KOUAME N'DA LEMISSA によって開発された MetaTrader 5 用のプロフェッショナルインジケーターで、四半期ごとの High, Low, Open, Close レベルを自動表示します。トレーダーはチャート上で重要なサポートおよびレジスタンスゾーンを明確に視覚化でき、中期取引の意思決定を容易にします。
主な機能:
-
四半期ごとの High, Low, Open, Close レベルを自動表示。
-
各レベルの色をカスタマイズ可能:
-
High: 赤
-
Low: 青
-
Open: 緑
-
Close: オレンジ
-
-
線の幅を調整して視覚的に区別可能。
-
Quarter_Shift パラメータを使用して、現在、前四半期、またはそれ以前の四半期 のレベルを表示可能。
-
MT5 のすべての通貨ペアおよび金融商品に対応。
パラメータ:
| パラメータ | 説明 | デフォルト値 |
|---|---|---|
| Quarter_Shift | 表示を前の四半期にシフト:0 = 現在, 1 = 前, など | 0 |
トレーダーの利点:
-
重要な四半期レベルを迅速に特定可能。
-
重要な価格レベル に基づいた意思決定を簡単に視覚化。
-
サポート/レジスタンス またはレンジ戦略と互換性あり。
インストール手順:
-
Quarterly Levels Pro.mq5 ファイルを次にコピー:
MetaTrader 5\MQL5\Indicators -
MetaTrader 5 を開き、エディタでインジケーターを再コンパイル。
-
ナビゲータ → インジケーター から目的のチャートにインジケーターを添付。
-
前の四半期のレベルを表示したい場合は Quarter_Shift を調整。
サポートと更新:
質問や将来の更新については、MQL5 または購入時に提供されたメールで KOUAME N'DA LEMISSA に連絡してください。
ライセンス:
個人利用のみの商用製品。KOUAME N'DA LEMISSA の許可なしに再配布禁止。