Institutional Liquidity Map Pro

Carte de liquidité institutionnelle Pro

Découvrez où les grandes institutions déclenchent leurs mouvements majeurs

💡 Présentation

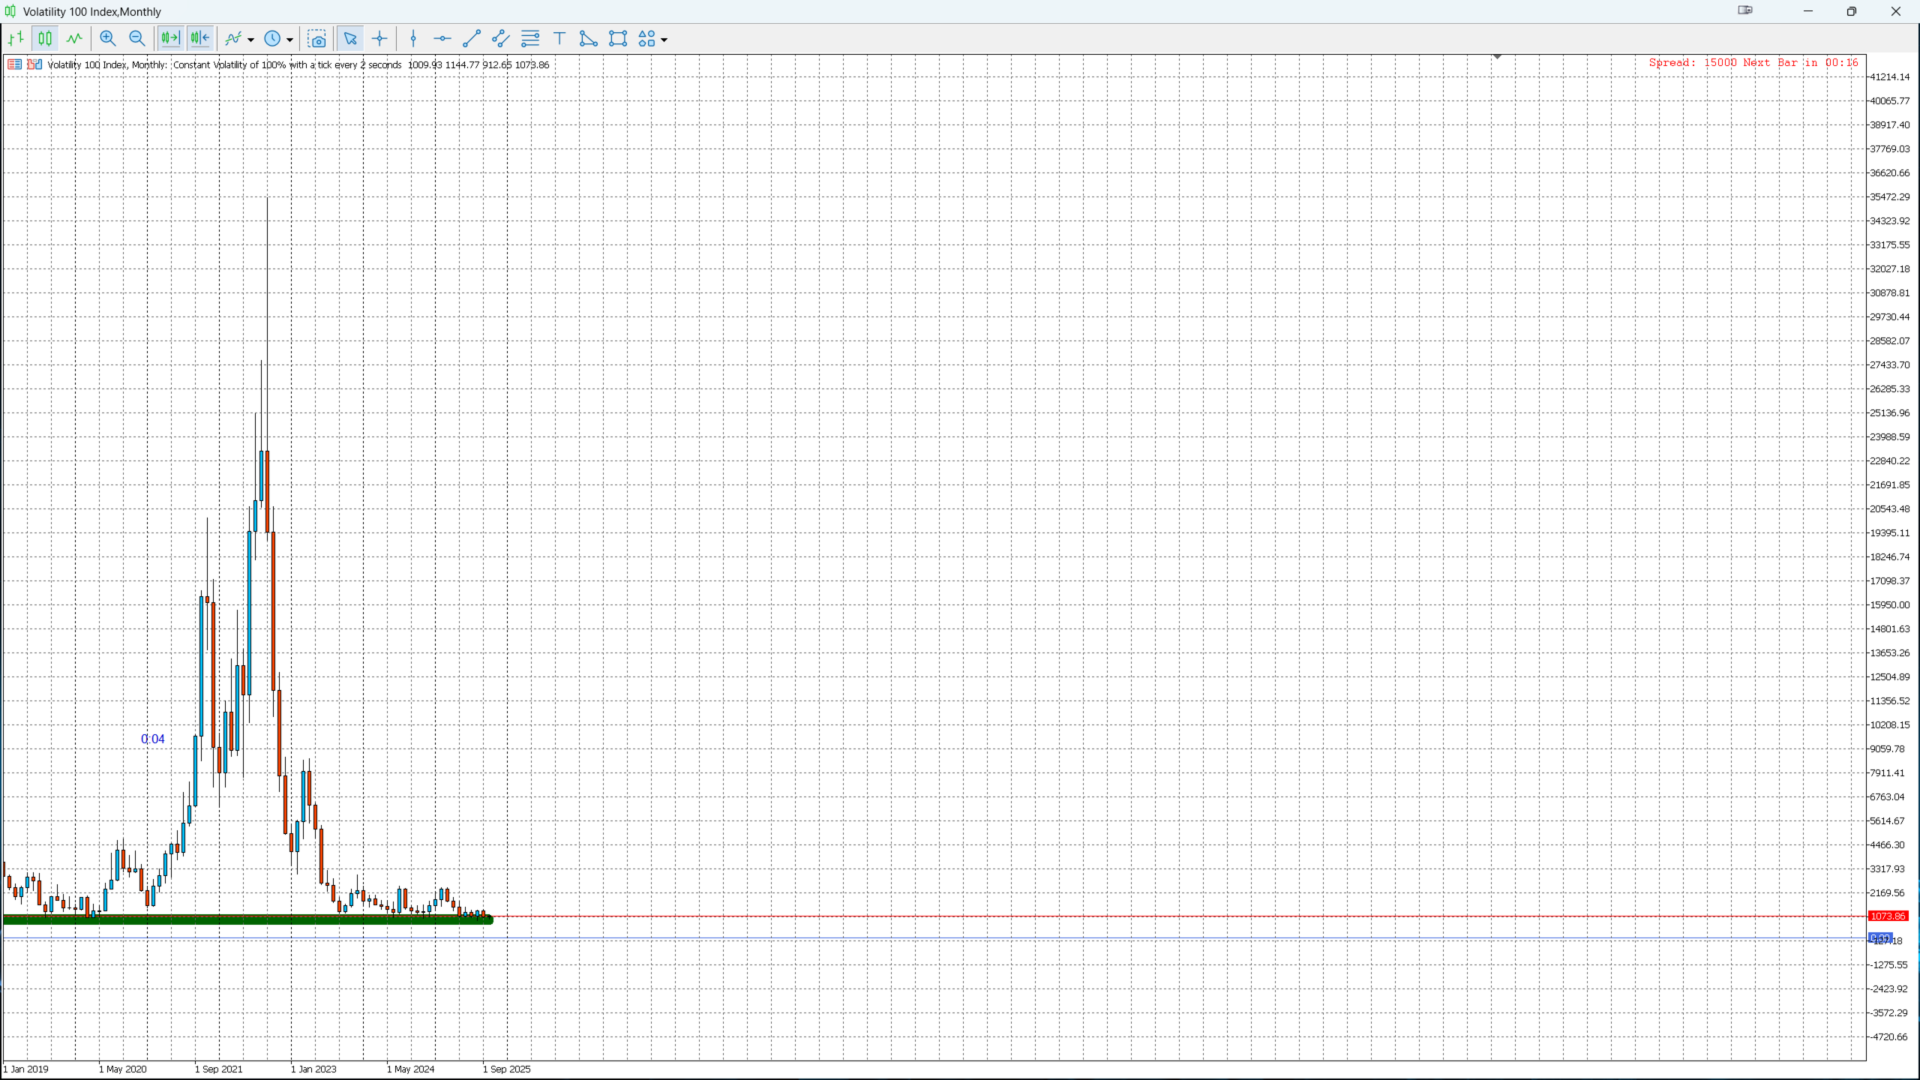
Institutional Liquidity Map Pro est un indicateur professionnel conçu pour cartographier les zones de liquidité institutionnelle à partir des hauts et bas mensuels .
Il identifie automatiquement les zones de chasse aux stop-loss , les points de retour probables et les zones d'accumulation/distribution utilisées par les grandes institutions.

Grâce à un système de détection dynamique, l'indicateur enregistre jusqu'à trois niveaux successifs de liquidité BUY et SELL , mis à jour en temps réel.
C'est un outil idéal pour tout trader souhaitant comprendre le comportement du Smart Money et trader dans la même direction que les opérateurs majeurs.

⚙️ Fonctionnalités principales

✅ Détection automatique des hauts et bas mensuels (Monthly High/Low)
✅ Identification des zones de liquidité institutionnelle (Liquidity Zones)
✅ Suivi des 3 derniers niveaux de capture de liquidité (Buy & Sell)
✅ Affichage graphique clair par rectangles colorés dynamiques
✅ Couleurs distinctes pour les zones actuelles et historiques
✅ Fonctionne sur toutes les paires Forex, indices, métaux et crypto
✅ Compatible avec tout autre indicateur technique ou EA

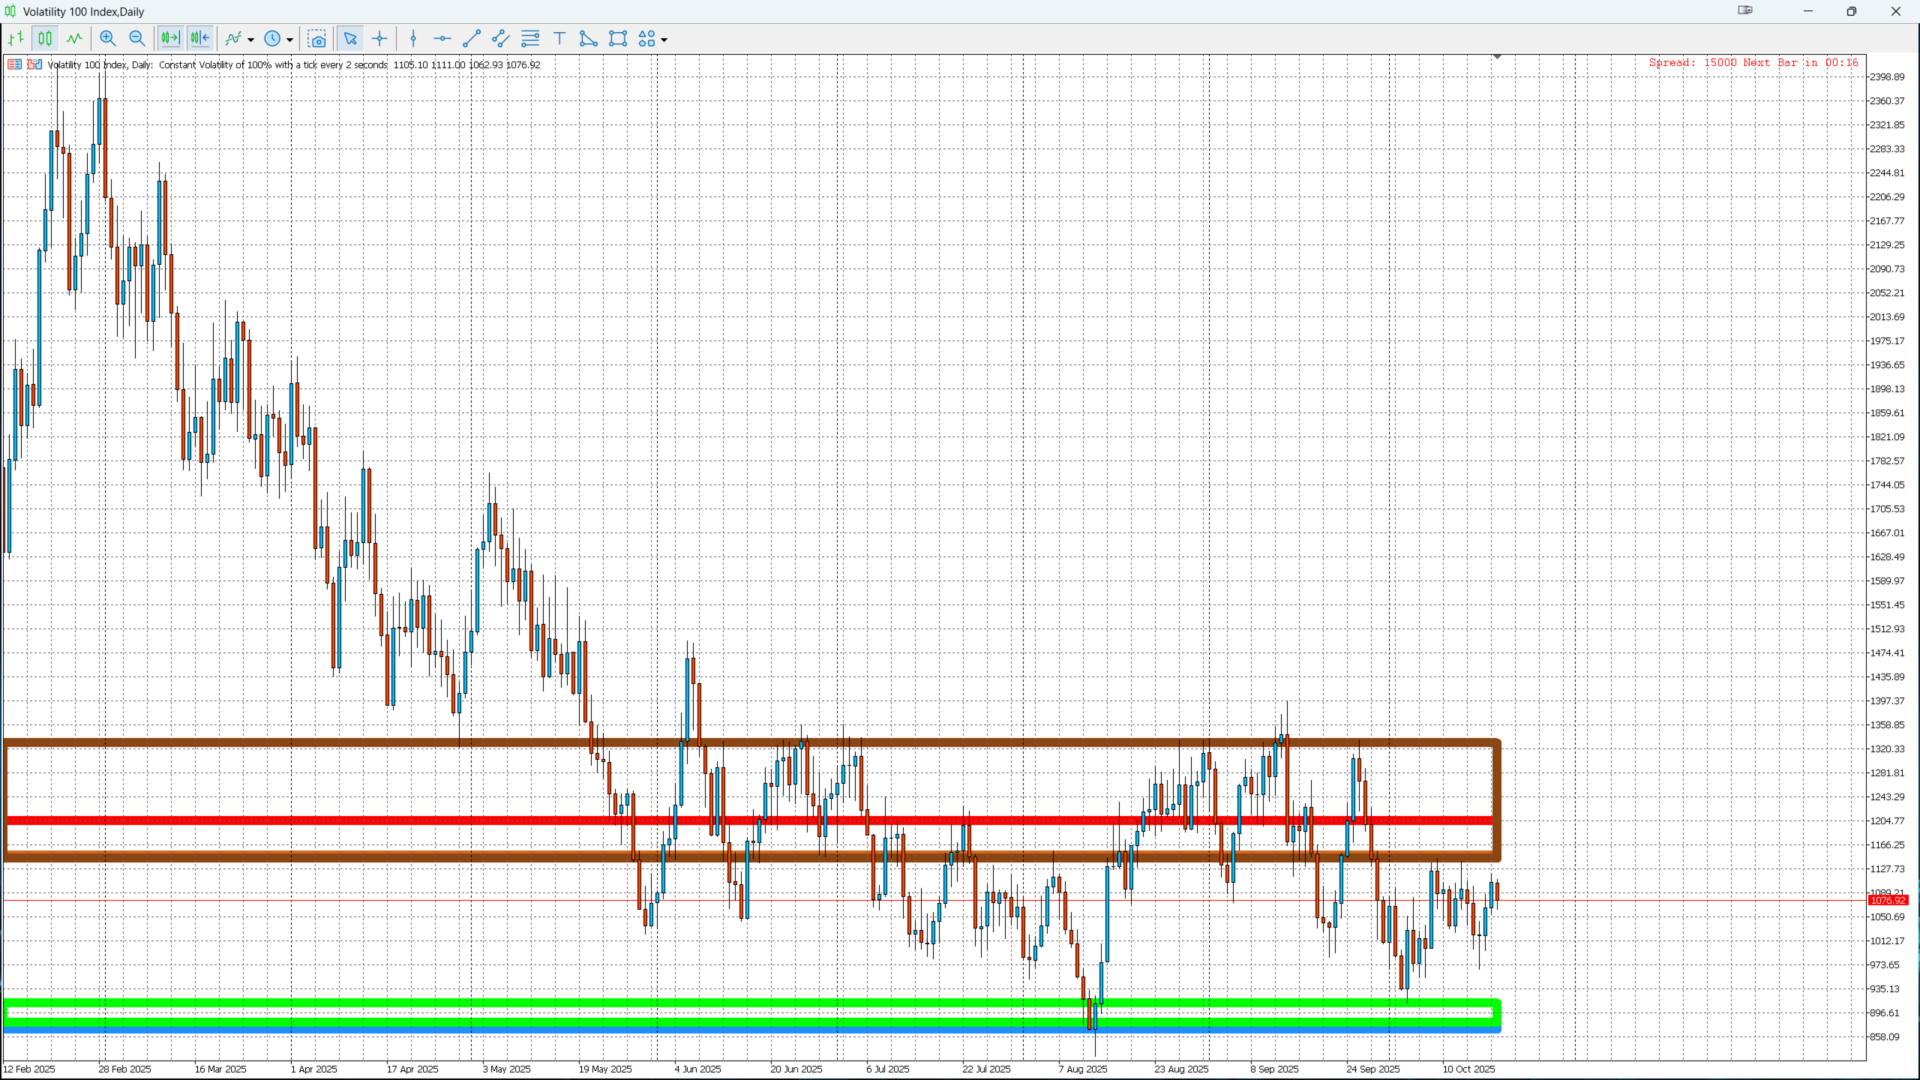
🎯 Utilisation et interprétation

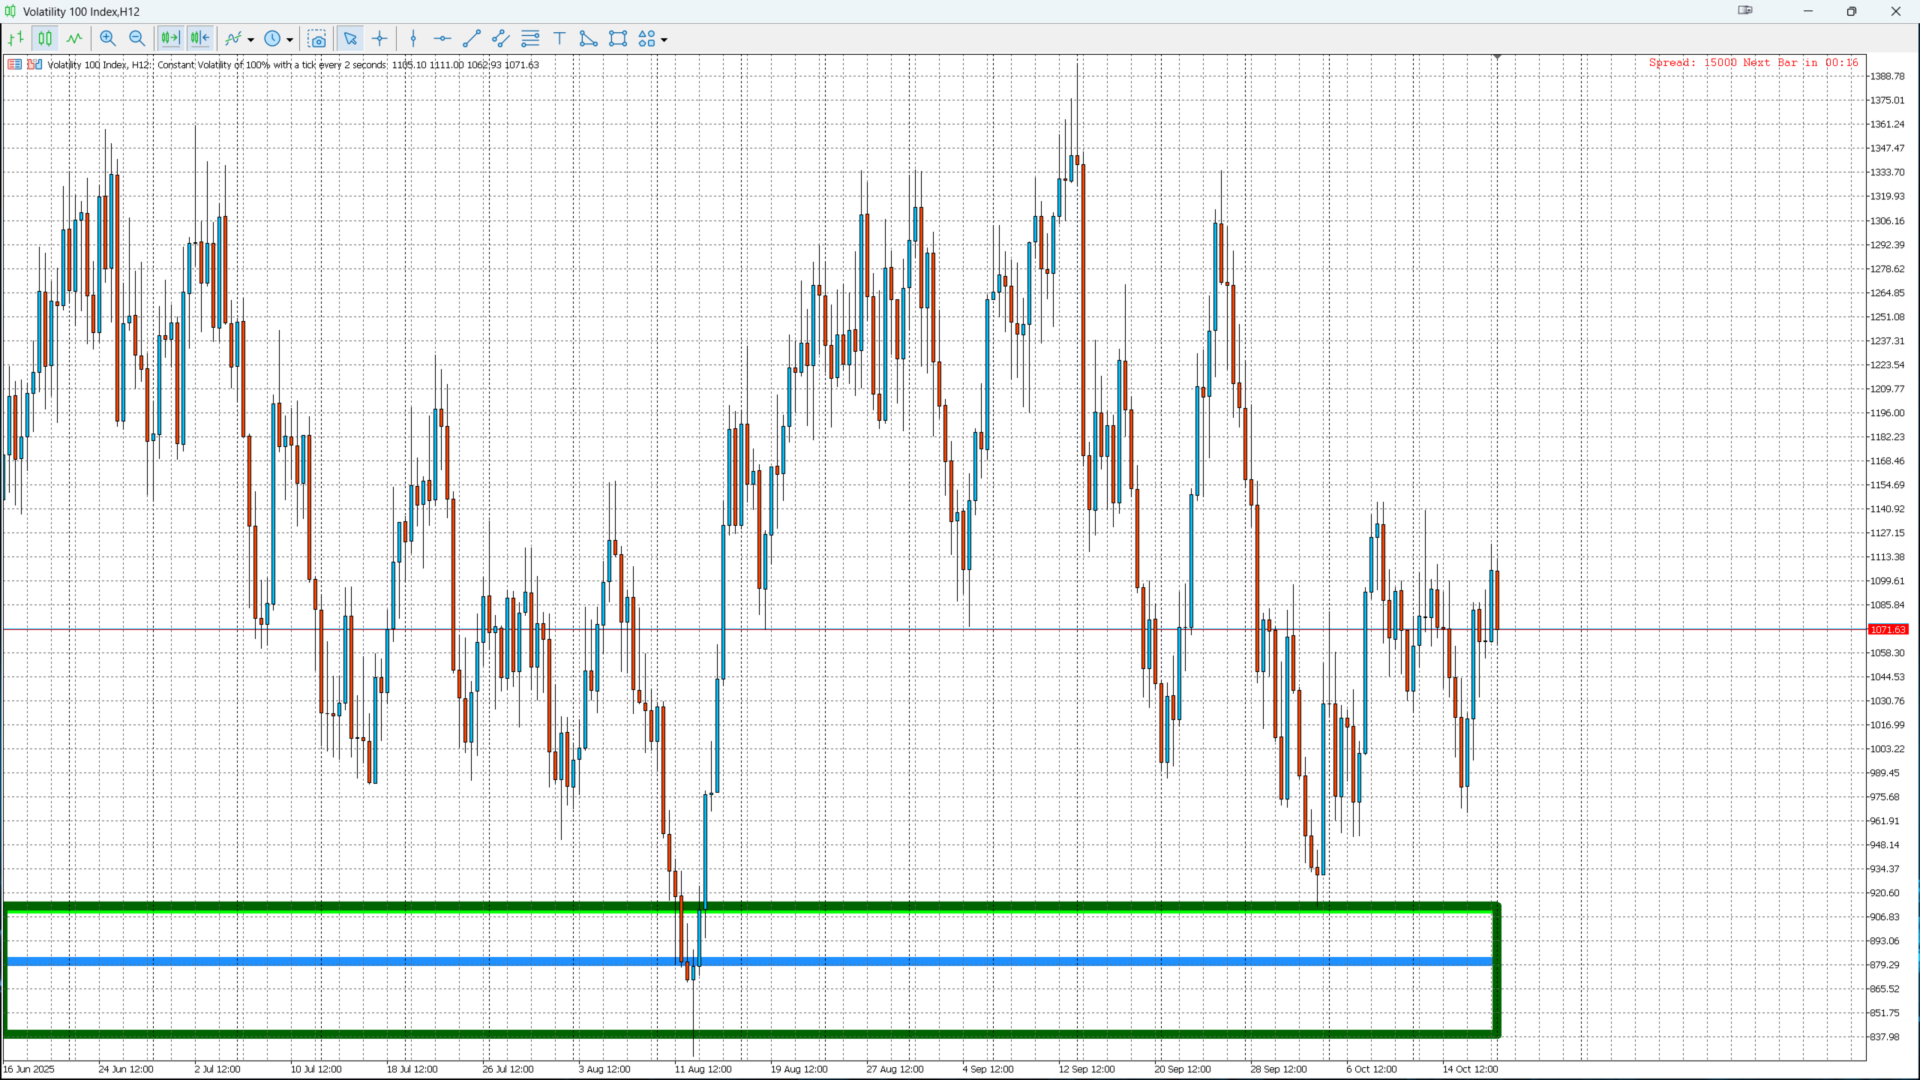
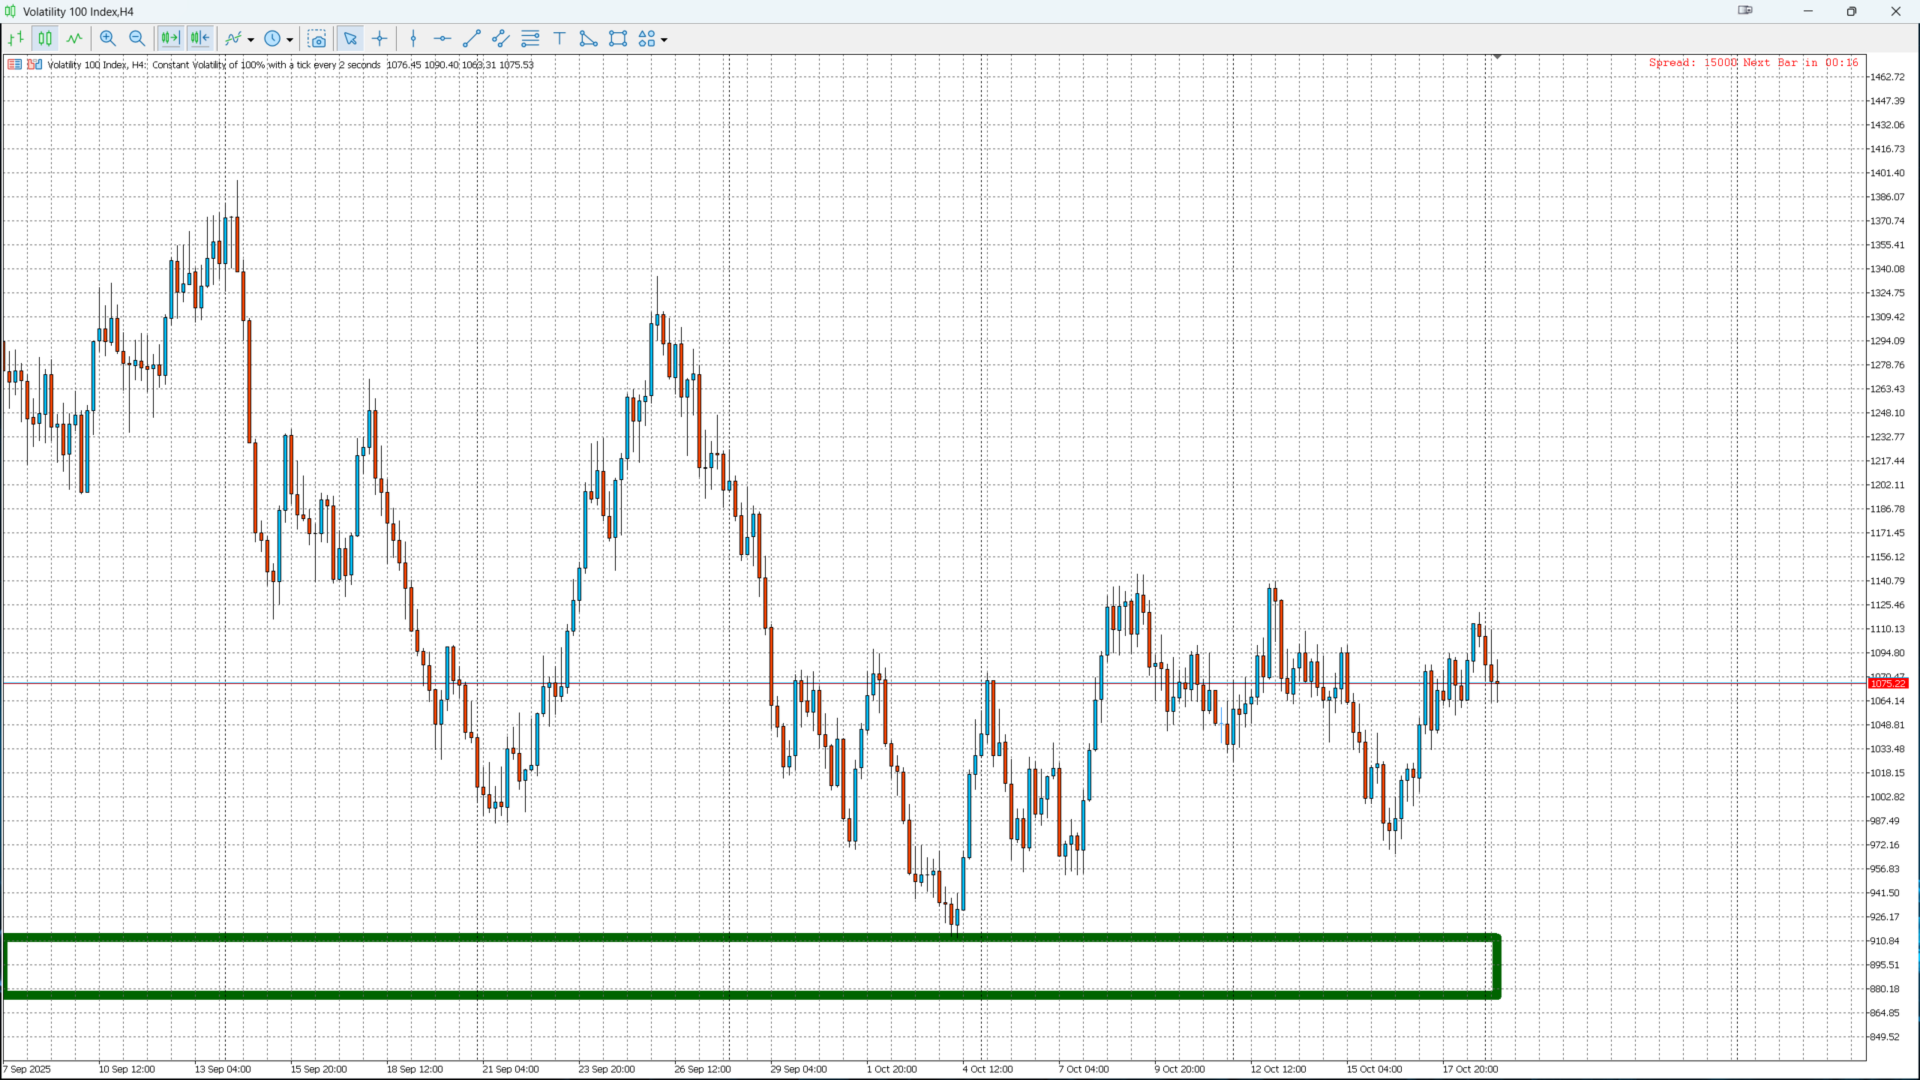
🔹 Zones BLEUES / VERTES → Liquidité achetée (Buy Liquidity)
→ Souvent des points bas balayés , potentiels supports institutionnels.

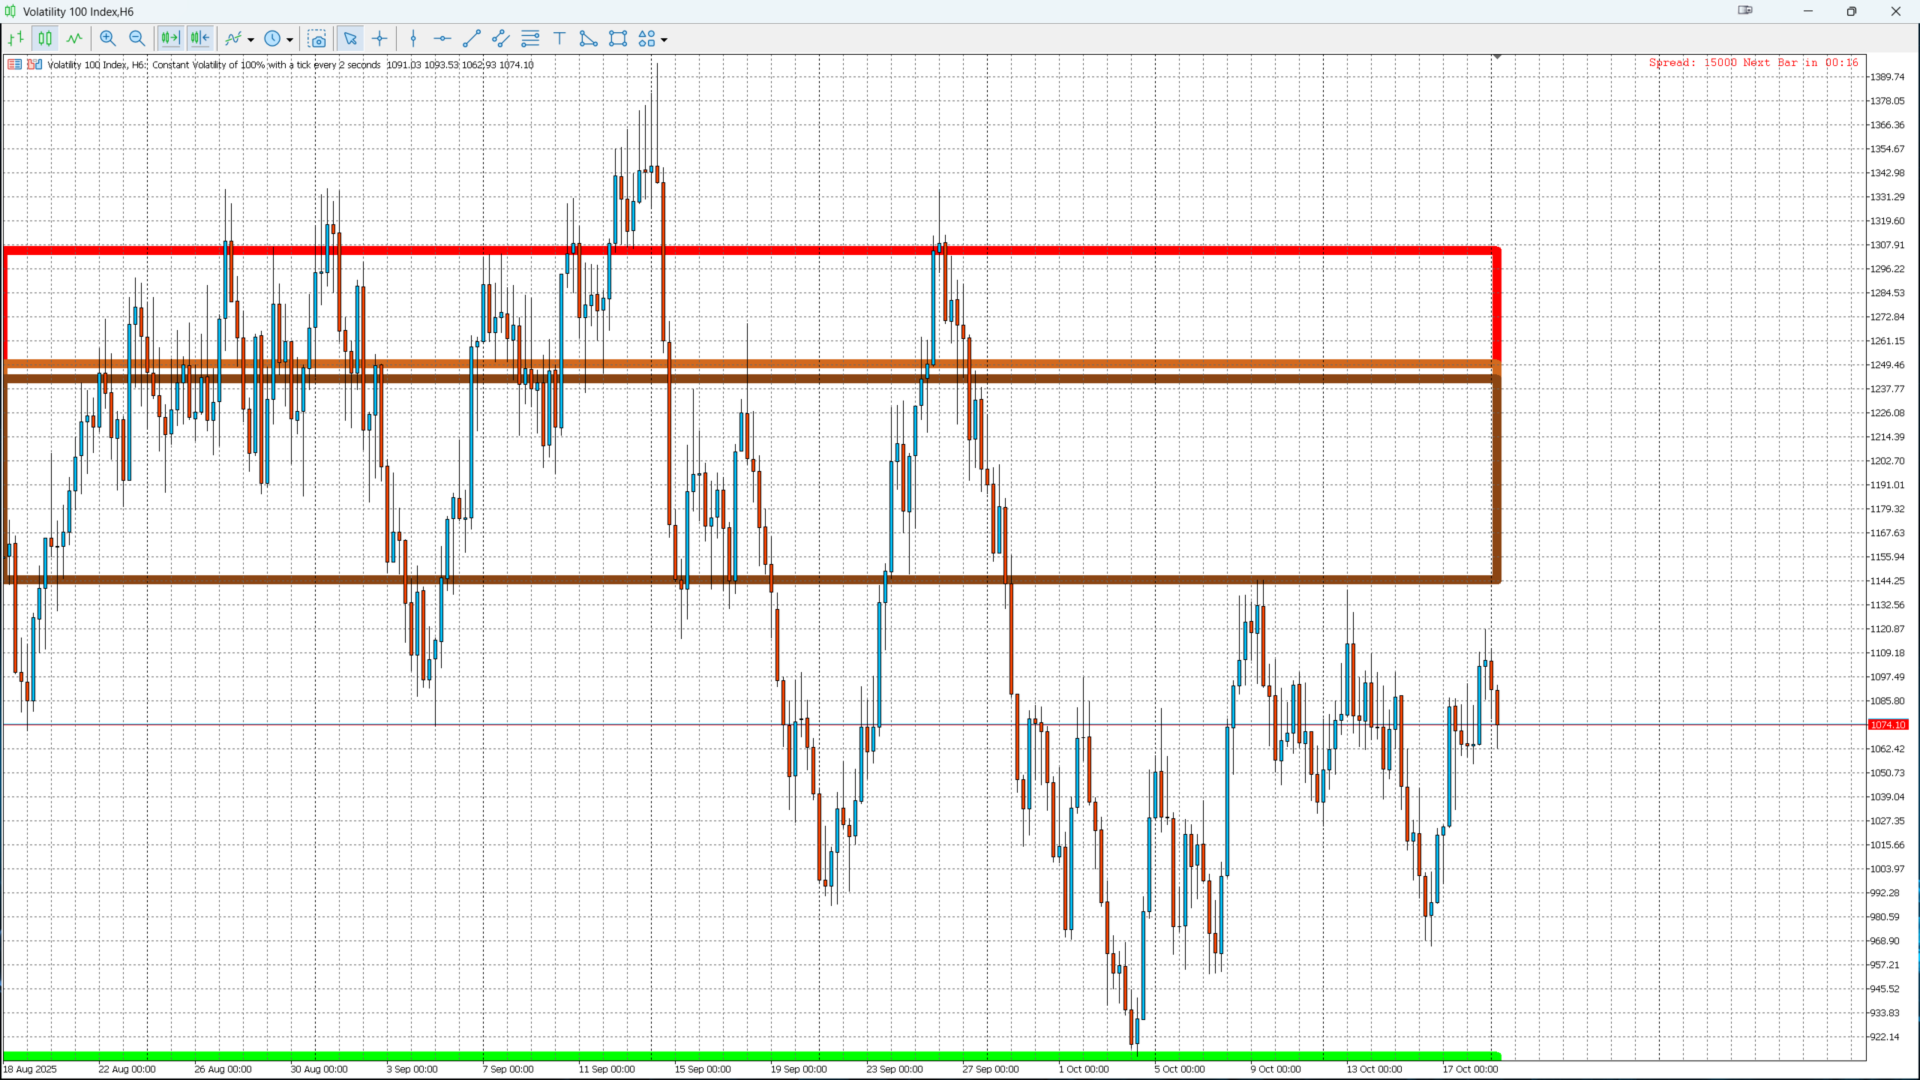
🔹 Zones ROUGES / MARRON → Liquidité vendeuse
→ Souvent des points hauts balayés , potentielles résistances institutionnelles.

👉 Lorsque le prix atteint une zone de liquidité, il est fréquent d'observer :

  • Un rejet brutal (retournement)

  • Ou une accumulation avant un mouvement impulsif.

Combinez cet indicateur avec :

  • Kijun-Sen , Future Zero Gravity ou Donchian Channel ,
    pour confirmer vos signaux et filtrer les fausses cassures.

🧩 Paramètres personnalisables

Paramètre Description Par défaut
Ref_Timeframe Délai de référence (MN1 recommandé) PERIODE_MN1
Ref_Shift Décalage dans l'historique 0
LiquiditéAchatCouleur_Actuel Couleur du niveau d'achat actuel Bleu vif
LiquiditéVenteCouleur_Actuel Couleur du niveau de vente actuel Rouge
LiquiditéAchatCouleur_Past1 Niveau d'achat précédent 1 Vert clair
LiquiditéAchatCouleur_Past2 Niveau d'achat précédent 2 Vert foncé
LiquiditySellColor_Past1 Niveau de vente précédent 1 Chocolat
LiquiditySellColor_Past2 Niveau de vente précédent 2 Brun foncé
LiquidityZoneWidth Épaisseur des rectangles 6

📊 Conseils d’utilisation

1️⃣ Appliquez l’indicateur sur votre graphique principal (H4 ou D1 recommandé).
2️⃣ Laissez le timeframe de référence sur MN1 pour capter les zones majeures.
3️⃣ Observez la réaction du prix à l’approche des rectangles.
4️⃣ Combinez avec des patterns de Price Action (Pin Bar, Englobante, etc.).
5️⃣ Recherchez une confluence entre la liquidité et d’autres structures (FZG, Donchian, etc.).

🏆 Avantages clés

  • Vision institutionnelle du marché en un seul coup d’œil

  • Zéro repaint : les zones restent fixes une fois validées

  • Compatible avec tous les courtiers et actifs MT5

  • Indispensable pour les traders S.M.C (Smart Money Concept)

  • Peut être intégré dans une stratégie manuelle ou automatique

🚀 Prochaines mises à jour (v2.7)

  • Ajout d’alertes visuelles et sonores

  • Détection automatique des Order Blocks liés aux zones de liquidité

  • Option d’affichage pour Weekly / Daily Liquidity Zones

  • Intégration des signaux fléchés BUY/SELL

💬 Slogan commercial :

“Voyez ce que les institutions voient — avant tout le monde.”
Institutional Liquidity Map Pro — La vision institutionnelle du marché.

🔖 Auteur

👤 KOUAME N’DA LEMISSA
Créateur du système LEMISSA TRADING SYSTEM
Spécialiste des indicateurs institutionnels et des zones de liquidité sur MetaTrader 5.


Produits recommandés
Manyal trading system, CovEchoTrend Robot, focuses on reliability and flexibility. By employing statistical analysis methods to study the relationships between the base indicator and market patterns, the system enables a deeper understanding of market processes. Intelligent pattern analysis: The application of statistical data processing helps identify key trend reversal points more accurately, signaling significant market shifts. Informed decision-making is based on the intersection of indicato
Indicateur unique qui met en œuvre une approche professionnelle et quantitative pour signifier le trading de réversion. Il capitalise sur le fait que le prix dévie et revient à la moyenne de manière prévisible et mesurable, ce qui permet des règles d'entrée et de sortie claires qui surpassent largement les stratégies de trading non quantitatives. [ Installation Guide | Update Guide | Troubleshooting | FAQ | All Products ] Des signaux de trading clairs Étonnamment facile à échanger Couleurs et t
Owl Smart Levels MT5
Sergey Ermolov
4.03 (32)
Version MT4   |  FAQ L' indicateur Owl Smart Levels est un système de trading complet au sein d'un seul indicateur qui comprend des outils d'analyse de marché populaires tels que les fractales avancées de Bill Williams , Valable ZigZag qui construit la structure d'onde correcte du marché et les niveaux de Fibonacci qui marquent les niveaux exacts d'entrée. sur le marché et les endroits où prendre des bénéfices. Description détaillée de la stratégie Mode d'emploi de l'indicateur Conseiller-Assis
Manus Pro
Itumeleng Mohlouwa Kgotso Tladi
MANUS PRO EA The Trading Revolution You've Been Waiting For Are you TIRED of watching other traders make consistent profits while your account bleeds red?   The financial markets don't wait for anyone – and neither should you. MANUS PRO isn't just another Expert Advisor... it's your   TICKET TO FINANCIAL FREEDOM . Why MANUS PRO is Different (And Why Everyone's Talking About It) FOR BEGINNERS: Your Trading Mentor That Never Sleeps Zero Learning Curve   – Install, activate, and watch it wo
The  SuperTrend Advance Trading  is a widely-used technical indicator based on  SuperTrend Strategy + Price Action + EMA . How it works: -  Buy/Sell Signals  can be generated when the trend reverses, the conditions of Price action, TrendLine and EMA are met. - After the  Signal  appears, be patient and wait until the candle closes, at that time place the order as soon as possible. You may have time to review your entry, consider whether it is a good entry or not. - Carefully review the entry, up
FX Order Flow MT5
Carl Gustav Johan Ekstrom
5 (1)
This powerful tool is engineered to transform the way traders analyze currency strength. Built for every experience level, it offers clear, actionable guidance on when to trade and in which direction. Its versatility extends across all currency-related symbols, including gold (XAU/USD) and bitcoin (BTC/USD). By delivering deep, data-driven insights, it empowers traders to make smarter, more confident decisions. Whether you're a beginner or a seasoned professional, this indicator equips you with
Range Directional Force Indicator – Designed for You to Optimize! The Range Directional Force Indicator is a cutting-edge tool designed to empower traders by visualizing market dynamics and directional strength. Built to offer insights into market trends and reversals, this indicator is an invaluable asset for traders seeking precision in their strategies. However, it is important to note that this indicator is not optimized, leaving room for you to tailor it to your unique trading preferences.
STRICTLY FOR BOOM INDEX ONLY!!!!! Here I bring the Maximum Trend Arrows OT1.0 MT5 indicator. This indicator is made up of a combination of different trend indicators for entries and exits, for entries an orange arrow will paint on the chart below the current market and a red flag for closing of trades and it produces buy arrows only. When the orange arrow appears, it will appear along with it's sound to notify you. The 1H timeframe is recommended, don't use it anywhere else than on the 1H timefr
Inverted_Chart_EA Utility Expert Advisor Inverted_Chart_EA creates and maintains a mirror-inverted chart of any symbol and timeframe. It automatically generates a custom instrument (e.g. US30_INV ) and keeps its price history updated in real time, with bars mirrored around a chosen pivot. This utility gives traders a new way to analyze the market from a different perspective by flipping the chart upside down. Why use an inverted chart? Highlight hidden patterns – price formations that look ordin
The Goat Scalper
Giordan Cogotti
The Goat Scalper EA — Smart, Fast, and Built for Real Market Performance Overview The Goat Scalper EA is a next-generation trading system built to capture decisive market moves with surgical precision. Unlike typical scalpers that rely on risky methods such as martingale, grid, hedging, or arbitrage, The Goat uses a pure breakout logic based on advanced supply and demand zone detection, ensuring stable and transparent results in any condition. Core Strengths Smart Risk Management Stop Loss on
L'indicateur SMC Venom Model BPR est un outil professionnel pour les traders travaillant dans le concept Smart Money (SMC). Il identifie automatiquement deux modèles clés sur le graphique des prix: FVG   (Fair Value Gap) est une combinaison de trois bougies, dans laquelle il y a un écart entre la première et la troisième bougie. Forme une zone entre les niveaux où il n'y a pas de support de volume, ce qui conduit souvent à une correction des prix. BPR   (Balanced Price Range) est une combinaiso
Noize Absorption Index - is the manual trading system that measures the difference of pressure between bears forces and bulls forces. Green line - is a noize free index that showing curent situation. Zero value of index shows totally choppy/flat market.Values above zero level shows how powerfull bullish wave is and values below zero measures bearish forces.Up arrow appears on bearish market when it's ready to reverse, dn arrow appears on weak bullish market, as a result of reverse expectation.
Engulfing with EMAs Indicator Unlock the power of advanced candlestick pattern detection with the Engulfing with EMAs Indicator , a cutting-edge tool designed for MetaTrader 5. This futuristic indicator combines the precision of engulfing pattern analysis with the trend-following strength of Exponential Moving Averages (EMA 21 and EMA 50), empowering traders to identify high-probability setups across all currency pairs and timeframes. Key Features: Comprehensive Engulfing Detection : Detects b
The Riko Trend indicator is a revolutionary trend trading and filtering solution with all the important features of a trend tool built into one tool! The Riko Trend indicator is good for any trader, suitable for any trader for both forex and binary options. You don’t need to configure anything, everything is perfected by time and experience, it works great during a flat and in a trend. The Riko Trend indicator is a technical analysis tool for financial markets that reflects the current price f
Introduction to the Manual Backtesting Indicator on MQL5 The MetaTrader platform provides an excellent backtesting tool for evaluating Expert Advisors (EAs). However, when it comes to manually backtesting a strategy to assess its effectiveness, this tool has some limitations: You cannot manually draw zones or trend lines while in backtesting mode. You cannot switch timeframes to check time alignment. For example, if my strategy requires additional confirmation from a higher timeframe (HTF), this
Le niveau Premium est un indicateur unique avec une précision de plus de 80 % des prédictions correctes ! Cet indicateur a été testé par les meilleurs Trading Specialists depuis plus de deux mois ! L'indicateur de l'auteur que vous ne trouverez nulle part ailleurs ! À partir des captures d'écran, vous pouvez constater par vous-même la précision de cet outil ! 1 est idéal pour le trading d'options binaires avec un délai d'expiration de 1 bougie. 2 fonctionne sur toutes les paires de devises
L'une des séquences de numéros s'appelle « Séquence des incendies de forêt ». Il a été reconnu comme l'une des plus belles nouvelles séquences. Sa principale caractéristique est que cette séquence évite les tendances linéaires, même les plus courtes. C'est cette propriété qui a constitué la base de cet indicateur. Lors de l'analyse d'une série chronologique financière, cet indicateur essaie de rejeter toutes les options de tendance possibles. Et seulement s'il échoue, il reconnaît alors la prés
Be notified of every color change of Heiken Ashi (HA) candles. The indicator will trigger past and new signals every time that HA candles change their colors. ( Note : this tool is based on the code of Heiken Ashi indicator developed by MetaQuotes Software Corp.) Features The signals are triggered at closing of last bar/opening of a new bar; Any kind of alerts can be enabled: Dialog Box, Email message, SMS notifications for smartphones and tablets, and Sound alerts; By default, up arrows are pl
MercariaPattern1-2-3 відстежує рух ціни, знаходить трьоххвильові структури 1-2-3 та підсвічує момент, коли сценарій підтверджується пробоєм ключового рівня. MercariaPattern1-2-3 tracks price movement, detects three-leg 1-2-3 structures and highlights the moment when the scenario is confirmed by a key level breakout. Індикатор збирає локальні свінги в компактну фігуру 0–1–2–3 , чекає підтвердженого пробою та будує стрілку входу з готовими рівнями SL/TP. The indicator combines local swings into a
BREAK RETEST NON-REPAINT. WORKS BEST AT M15 AND ABOVE.  Benefits Fewer false breakouts . Combining close confirmation + retest + previous-close filter greatly reduces noise vs. raw high/low breaks. Tighter execution plans . The drawn level line gives an objective spot for entries, stop placement (just beyond the level), and partial-take-profit structure. Non-repainting confidence . Signals are placed on current bar. Flexible across markets . Works on FX, indices, metals, crypto; scalping on M15
PREngulfing
Slobodan Manovski
PR EA - Système de trading basé sur les motifs Engulfing Détection automatique des chandeliers Engulfing avec confirmation par moyenne mobile Le PR EA est un expert advisor pour MetaTrader 5 qui identifie et trade les motifs Engulfing haussiers/baissiers lorsqu'ils sont confirmés par un filtre de moyenne mobile. Optimisé pour le timeframe M30, compatible avec M15 et H1. Caractéristiques principales : Reconnaissance de motifs - Détecte les formations Engulfing valides Confirmation de tend
Price reach indicator. It also serves as the perfect term for supports and resistance. I use it in two experts. The basic tool for professional trading. The indicator analyzes the last 500 bar and uses this to determine the levels ( but it doesn't predict the future ) . Personally, I use it on TF H1.  It is very simple. Four lines on chart and that's all. Only two input parameters.  Thousands of indicators. Why this? Is good ? No! Is very good. Please test the indicator prior to purchasing. You
Price manipulation risk
Vincent Albert Feugier
Price Manipulation Risk Indicator Outil Avancé d’Évaluation du Risque & de Détection de Manipulation Price Manipulation Risk Indicator est un indicateur professionnel conçu pour mesurer le niveau de risque présent sur le marché . Il analyse le comportement du prix, l’activité du marché et la dynamique des bougies afin d’identifier les phases instables ou potentiellement manipulées. Cet outil aide le trader à éviter les pièges , filtrer les faux signaux , et améliorer son timing d’entrée et
QXS Market Scanner
Netlux Digital Kft.
QuantXMarketScanner is a multi assets indicator for MT5 - Mathematical model based on 7 custom moving averages indicators  - Adaptable on Currencies, Stocks and Crypto - Automatic setup, self optimized About QuantXsystem Products: –         Simple installation & integration into MT5   –         Unlimited License after purchase (for one user) –         Automatic pattern recognition to identify the best timing and price levels. –         Trading indicators are displayed directly and automaticall
Indicateur RSI Multi-Périodes Libérez la puissance de l'analyse multi-périodes avec notre indicateur RSI intuitif ! Obtenez une perspective complète sur l'élan du marché sur différentes périodes, le tout sur un seul graphique. Notre indicateur RSI Multi-Périodes vous permet de suivre l'indice de force relative (RSI) avec une période cohérente sur cinq périodes personnalisables, vous permettant de prendre des décisions de trading plus éclairées. Caractéristiques principales: Affichage simultané m
Magic EA MT5
Kyra Nickaline Watson-gordon
Magic EA is an Expert Advisor based on Scalping, Elliot Waves and with filters such as RSI, Stochastic and 3 other strategies managed and decided with the robot smartly. Large number of inputs and settings are tested and optimized and embedded in the program thus inputs are limited and very simple. Using EA doesn't need any professional information or Forex Trading Knowledge. EA can trade on all symbols and all time frames, using special and unique strategies developed by the author. The EA w
Statistical Arbitrage Spread Generator for Cointegration [MT5] What is Pair Trading? Pair trading is a market-neutral strategy that looks to exploit the relative price movement between two correlated assets — instead of betting on the direction of the market. The idea? When two assets that usually move together diverge beyond a statistically significant threshold, one is likely mispriced. You sell the expensive one, buy the cheap one , and profit when they converge again. It’s a statistica
FREE
Based on the trading model/strategy/system of gold double-position hedging and arbitrage launched by Goodtrade Brokers, problems encountered in daily operations: 1. Account B immediately places an order immediately following account A. 2: After account A places an order, account B will automatically copy the stop loss and take profit. 3: Account A closes the position of Account B and closes the position at the same time. 4: When account B closes the position, account A also closes the position.
Introducing to your attention the unique trading system/indicator "Scaled Vidya Trends", designed for dynamic scalp trading on trend volatility pairs hour + timeframes. Main features of Scaled Vidya Trends: -Multi-level market analysis: it works on H1, H2, H3 timeframes; -Uses the most popular currency pairs: EURUSD, GBPUSD, USDCAD. Brokers usually set one of the lowest spreads for these pairs; -Applies a scalping method based on local targets for signals; -Signals appears at the new open of
Stormer RSI 2
Ricardo Rodrigues Lucca
This strategy was learned from Stormer to be used on B3. Basically, 15 minutes before closing the market, it will check RSI and decided if it will open an position. This strategy do not define a stop loss. If the take profit reach the entry price it will close at market the position. The same happens if the maximal number of days is reached. It is created to brazilian people, so all configuration are in portuguese. Sorry Activations allowed have been set to 50.
Les acheteurs de ce produit ont également acheté
AriX
Temirlan Kdyrkhan
1 (4)
AriX Indicator for MT5 A powerful trend-following and signal-evaluation tool AriX is a custom MT5 indicator that combines Moving Averages and ATR-based risk/reward logic to generate clear buy/sell signals. It visualizes dynamic SL/TP levels, evaluates past trade outcomes, and displays win/loss statistics in a clean on-chart panel. Key features include: Buy/Sell signals based on MA crossovers ATR-based SL/TP1/TP2/TP3 levels with visual lines and labels Signal outcome tracking with real-time stat
ARICoins
Temirlan Kdyrkhan
ARICoin is a powerful trading companion designed to generate high-probability entry signals with dynamic TP/SL/DP levels based on volatility. Built-in performance tracking shows win/loss stats, PP1/PP2 hits, and success rates all updated live. Key Features: Buy/Sell signals with adaptive volatility bands Real-time TP/SL/DP levels based on ATR Built-in MA Filter with optional ATR/StdDev volatility Performance stats panel (Success, Profit/Loss, PP1/PP2) Alerts via popup, sound, push, or email Cust
TrendMaestro5
Stefano Frisetti
note: this indicator is for METATRADER4, if you want the version for METATRADER5 this is the link:  https://www.mql5.com/it/market/product/108106 TRENDMAESTRO ver 2.5 TRENDMAESTRO recognizes a new TREND from the start, he never makes mistakes. The certainty of identifying a new TREND is priceless. DESCRIPTION TRENDMAESTRO identifies a new TREND in the bud, this indicator examines the volatility, volumes and momentum to identify the moment in which there is an explosion of one or more of these da
L'indicateur « Dynamic Scalper System MT5 » est conçu pour la méthode de scalping, permettant de trader au sein des vagues de tendance. Testé sur les principales paires de devises et l'or, il est compatible avec d'autres instruments de trading. Fournit des signaux pour l'ouverture de positions à court terme le long de la tendance, avec un support supplémentaire pour les fluctuations de prix. Principe de l'indicateur : De grandes flèches déterminent la direction de la tendance. Un algorithme de
##   ONLY GOLD ##   Тiльки Золото ## **Mercaria Professional Trading Zones - Complete Guide** ## **Mercaria Professional Trading Zones - Повний посібник** ### **How Mercaria Zones Work / Як працюють зони Mercaria** **English:** Mercaria Zones is an advanced trading indicator that identifies high-probability support and resistance areas using ZigZag extremes combined with mathematical zone calculations. The indicator works on multiple timeframes simultaneously, providing a comprehensive view
Obtenez l’indicateur AUX GRATUIT et le support EA   Téléchargement direct — Cliquez ici [ D.I.C.E ] The DICE Indicator  Divergence in Chaos Environment est un outil MT5 spécialisé conçu pour les traders appliquant la théorie des vagues d’Elliott dans le cadre des techniques de Trading Chaos. Il identifie les divergences cachées et régulières du prix, synchronisées avec l’environnement de marché chaotique décrit par Bill Williams. Caractéristiques clés Divergence alignée sur les vagues d’Elliott
+++++++++++++++++++++++++++++++++++++++++++++++++++++++++++++++++++++++++++++++++++++++++++++++++ +++ Link to EURUSD Only Free Version -->  https://www.mql5.com/en/market/product/156904?source=Unknown +++++++++++++++++++++++++++++++++++++++++++++++++++++++++++++++++++++++++++++++++++++++++++++++++ Hallo Trader, This is a traditional GANN & FIBONACCI strategy based on detection of an impulsive move in the opposite direction. This is called a Breakout. At the moment of Breakout, the indicator draw
Frontier Pivots
Nestor Jose Mendez Boza
FRONTIER PIVOTS - Geometric Levels Indicator This indicator plots support and resistance levels/ranges on the chart using mathematical calculations. It helps traders identify potential price reaction zones based on geometric patterns. Main Features: Automatically calculates and displays key price levels Plots both support and resistance lines Uses daily price data for level calculation Clean visual presentation with different colors for different level types No repainting - levels remain static
Pantera Indicator
Temirlan Kdyrkhan
5 (1)
A tool for on-chart strategy backtesting and performance analysis. A utility for developing, debugging, and testing custom trading ideas and indicator functions. An indicator designed to quickly test trading concepts and visualize the effectiveness of different input parameters. An all-in-one sandbox for testing everything from simple crossovers to complex, multi-condition trading systems.
Weis Wave with Alert MT5
Trade The Volume Waves Single Member P.C.
4.94 (17)
Rental/Lifetime Package Options and Privileges  Rent Monthly Six Months   Yearly/Lifetime Weis Wave with Speed with Alert+Speed Index x x x Manual  x x x Quick Set up Video x x x Blog x x x Lifetime Updates x x x Setup and Training Material x x Discord Access Channel "The SI traders"          x Rectangle Break Alert Tool      x How to trade with it:    http://www.tradethevolumewaves.com   ** If you purchase please contact me to setup your  : Training Room and  complete manual access.  Wei
Hello I Want to introduce The Forex Buy Sell Arrow Premium MT5 i recently release this premium indicator! its 1000% Non Repaint Indicator, It Work Perfectly Well,, i tested it day by day, Just mind blowing Result,  Including Powerful trend Algorithm! How It Work? well, it work market trend formula, when trend Bullish Or when trend Bearish,  Recommend Timeframe M30, H1 it work all timeframe, and all currency pair, 100% non repaint, How to take signal From Forex Buy Sell Arrow Premium Ind
Big Player Range
Thalles Nascimento De Carvalho
5 (3)
BigPlayerRange – Meilleur indicateur pour MT5 BigPlayerRange est considéré comme le meilleur indicateur pour le Mini Indice et le Mini Dollar sur MetaTrader 5. Cet outil met en évidence les zones stratégiques d’action des gros acteurs du marché, offrant une analyse technique institutionnelle d’une grande précision. Comment utiliser BigPlayerRange : Cet indicateur trace des zones d’achat (ligne verte) et de vente (ligne rouge). Lorsque le prix clôture en dehors de ces zones, une tendance
Enigma 112
issam rahhal sabour
دليل استخدام مؤشر Enigma 112 مؤشر Enigma 112 دليل الاستخدام الكامل - الحل الأمثل للتداول المقدمة مؤشر Enigma 112 هو أداة تحليل فني شاملة تجمع بين مفاهيم متقدمة تشمل بوابات Tesla 3-6-9، نظرية Huddleston، نطاقات PO3، وأنظمة متطورة لإدارة المخاطر. بوابات Tesla 3-6-9 تعتمد على رياضيات دوامة نيكولا تسلا لتحديد مستويات الدعم والمقاومة بدقة نظرية Huddleston تحليل هيكل السوق بناءً على الحجم لتحديد المستويات المؤسسية نطاقات PO3 كشف التذبذب السعري والمستويات المؤسسية لدخول دقيق دليل
VTrende Pro
Andrii Diachenko
5 (1)
VTrende Pro - MTF indicator for trend trading with a display panel for MT5 *** Videos can be translated into any language using subtitles (video language - Russian) Although the signals of the VTrende Pro indicator can be used as signals of a full-fledged trading system, it is recommended to use them in conjunction with the Bill Williams TS. VTrende Pro is an extended version of the VTrende indicator. Difference between Pro version and VTrende: - Time zones - Signal V - signal 1-2 waves -    S
L’indicateur analyse le volume à partir de n’importe quel point et calcule les niveaux d’épuisement du marché pour ce volume. Lignes principales de Meravith : Ligne d’épuisement du volume haussier – sert d’objectif. Ligne d’épuisement du volume baissier – sert d’objectif. Ligne de tendance – indique la tendance du marché. Sa couleur change selon que le marché est haussier ou baissier et elle sert de support de tendance. Comment l’utiliser : double-cliquez sur la ligne verticale violette et dépla
ChartMaster Heikin Ashi with Pivot Indicator for MT5 Take your trading to the next level with ChartMaster Heikin Ashi with Pivot Indicator , a powerful tool that combines the clarity of Heikin Ashi candles with advanced pivot-point analysis. This indicator is designed for traders who want to identify market trends, reversals, and key support/resistance zones with precision. Key Features: Heikin Ashi Visualization – Smooths out market noise for cleaner trend identification. Automatic Pivot
The Second-Level Tick Candlestick Generator is a professional-grade MT5 indicator tool specifically designed for high-frequency trading and short-term scalping. It can convert raw tick data into highly customizable second-level candlestick charts in real-time, helping traders accurately capture micro-market fluctuations and optimize entry and exit timing. This tool provides clear chart displays, allowing you to more intuitively identify price action patterns and improve trading decision efficien
XCalper TFO
Aecio de Feo Flora Neto
This oscillator was developed exclusively by xCalper in 2015 based on moving averages calculations to indicate and try predicting oversold and overbought levels. The fast line (white, by default) oscillates basically between values -0.5 (oversold) and +0.5 (overbought). Whenever this line crosses upward value -0.5, it means an oversold price level. When it crosses downward value +0.5, it means an overbought price level. When fast line crosses value 0.0 and returns, it is a strong pull-back indic
The Expert Advisor and the video are attached in the Discussion tab . The robot applies only one order and strictly follows the signals to evaluate the indicator efficiency. Pan PrizMA CD Phase is an option based on the Pan PrizMA indicator. Details (in Russian). Averaging by a quadric-quartic polynomial increases the smoothness of lines, adds momentum and rhythm. Extrapolation by the sinusoid function near a constant allows adjusting the delay or lead of signals. The value of the phase - wave s
Классификатор силы тренда. Показания на истории не меняет. Изменяется классификация только незакрытого бара. По идее подобен полной системе ASCTrend, сигнальный модуль которой, точнее его аппроксимация в несколько "урезанном" виде, есть в свободном доступе, а также в терминале как сигнальный индикатор SilverTrend . Точной копией системы ASCTrend не является. Работает на всех инструментах и всех временных диапазонах. Индикатор использует несколько некоррелируемых между собой алгоритмов для класси
FFx Universal Strength Meter PRO is more than a basic strength meter. Instead of limiting the calculation to price, it can be based on any of the 19 integrated strength modes + 9 timeframes. With the FFx USM, you are able to define any period for any combination of timeframes. For example, you can set the dashboard for the last 10 candles for M15-H1-H4… Full flexibility! Very easy to interpret... It gives a great idea about which currency is weak and which is strong, so you can find the best pai
The FFx Universal MTF alerter shows on a single chart all the timeframes (M1 to Monthly) with their own status for the chosen indicator. 9 indicators mode (MACD-RSI-Stochastic-MA-ADX-Ichimoku-Candles-CCI-PSAR). Each can be applied multiple times on the same chart with different settings. Very easy to interpret. Confirm your BUY entries when most of the timeframes are showing green color. And confirm your SELL entries when most of the timeframes are showing red color. 2 Alert Options : input to s
The FFx Watcher PRO is a dashboard displaying on a single chart the current direction of up to 15 standard indicators and up to 21 timeframes. It has 2 different modes: Watcher mode: Multi Indicators User is able to select up to 15 indicators to be displayed User is able to select up to 21 timeframes to be displayed Watcher mode: Multi Pairs User is able to select any number of pairs/symbols User is able to select up to 21 timeframes to be displayed This mode uses one of the standard indicators
FFx Patterns Alerter gives trade suggestions with Entry, Target 1, Target 2 and StopLoss .... for any of the selected patterns (PinBar, Engulfing, InsideBar, OutsideBar) Below are the different options available: Multiple instances can be applied on the same chart to monitor different patterns Entry suggestion - pips to be added over the break for the entry 3 different options to calculate the SL - by pips, by ATR multiplier or at the pattern High/Low 3 different options to calculate the 2 TPs -
MetaTrader 4 version available here : https://www.mql5.com/en/market/product/24881 FFx Basket Scanner is a global tool scanning all pairs and all timeframes over up to five indicators among the 16 available. You will clearly see which currencies to avoid trading and which ones to focus on. Once a currency goes into an extreme zone (e.g. 20/80%), you can trade the whole basket with great confidence. Another way to use it is to look at two currencies (weak vs strong) to find the best single pairs
Currency Index Watcher is a simple and user-friendly tool for whoever wish to trade Forex using currencies indexes. Currency Index Watcher is configurable and usable directly from the panel. Indexes of 8 custom currencies EUR, USD, GBP, JPY, CHF, AUD, CAD, NZD (default) Any 3-chars symbol from your market watch could be used (BTC = bitcoin, RUB = ruble, CNH = yuan etc ...) : double click the symbol label  Ability to select which currencies and made-of pairs will be analyzed : check/uncheck wante
MetaTrader 4 version available here: https://www.mql5.com/en/market/product/25793 FFx Pivot SR Suite PRO is a complete suite for support and resistance levels. Support and Resistance are the most used levels in all kinds of trading. Can be used to find reversal trend, to set targets and stop, etc. The indicator is fully flexible directly from the chart 4 periods to choose for the calculation: 4Hours, Daily, Weekly and Monthly 4 formulas to choose for the calculation: Classic, Camarilla, Fibonac
Forex Relative Performance indicator This indicator calculates the relative strength of major currencies against the US dollar. The basic idea behind this indicator is "to buy strong currency and to sell weak currency". This indicator allows you to quickly identify the best forex pair to trade according to your trading style (Intraday, Scalping, Swing, or Long Term)
Pendiente de Precio
Cesar Juan Flores Navarro
Indicador en base a la pendiente de la linea de precio, dibuja una línea de color cuando sube a base de los precios que previamente has sido procesados o linealizados, y cuando baja la pendiente la linea linealizada toma otro color. En este caso se a considerado 6 lineas de diferentes procesos desde pendientes largas hacia las cortas, observándose que cuando coincidan las pendientes se produce un máximo o mínimo, lo que a simple vista nos permitirá hacer una COMPRA O VENTA.
WanaScalper
Isaac Wanasolo
1 (1)
A scalping indicator based on mathematical patterns, which on average gives signals with relatively small SL, and also occasionally helps to catch big moves in the markets (more information in the video) This indicator has three main types of notifications: The first type warns of a possible/upcoming signal on the next bar The second type indicates the presence of a ready signal to enter the market/open a position The third type is for SL and TP levels - you will be notified every time price re
Plus de l'auteur
Canal H Pro
N'da Lemissa Kouame
Français – Canal H Pro Nom : Canal H Pro – Support, Résistance & Breakout Description courte : Indicateur premium affichant trois lignes dynamiques (haute, basse, médiane) . Idéal pour Breakout, Range et suivi de tendance. Description complète : Rouge (Haute) → résistance dynamique Bleue (Basse) → support dynamique Jaune (Médiane) → équilibre et filtre de tendance Période et couleurs personnalisables Compatible toutes stratégies et unités de temps Canal H Pro – repérez les zones clés et prenez
NuageTrend Pro
N'da Lemissa Kouame
Nuage Trend Pro – Suivi de Tendance & Signaux Kijun Nuage Trend Pro est un indicateur avancé pour MetaTrader 5 , conçu pour détecter les tendances fortes et les points d’entrée optimaux grâce au croisement de la Kijun . Il transforme vos graphiques en cartes visuelles instantanées pour trader avec précision et confiance. Fonctionnalités principales Croisement de Kijun automatique : repère immédiatement les moments clés où le prix franchit la ligne de base. Nuage de tendance dynamique : col
Weekly Levels Pro
N'da Lemissa Kouame
Description – Weekly Levels Pro Weekly Levels Pro – Niveaux Clés Hebdomadaires est un indicateur simple et efficace pour MetaTrader 5, conçu pour afficher automatiquement les quatre niveaux les plus importants de chaque semaine de trading : Plus haut de la semaine (Weekly High) → zone de résistance naturelle Plus bas de la semaine (Weekly Low) → zone de support naturel Prix d’ouverture de la semaine (Weekly Open) → point de référence de tendance Prix de clôture de la semaine (Weekly Close) →
Pin Bar Pro v1
N'da Lemissa Kouame
Pin Bar Pro v1.0 – Indicateur MQL5 Description générale Pin Bar Pro est un indicateur professionnel pour MetaTrader 5 qui détecte automatiquement les Pin Bars , une formation de bougie japonaise cruciale pour anticiper les retournements du marché. Grâce à cet indicateur, les traders peuvent identifier rapidement les points d’entrée potentiels en achat ou en vente sans avoir à analyser manuellement chaque bougie. Les signaux sont affichés directement sur le graphique sous forme de flèches clair
Monthly Levels Pro
N'da Lemissa Kouame
Monthly Levels Pro v1.0 – L’indicateur ultime des niveaux mensuels du marché Maîtrisez les niveaux clés du marché en un coup d’œil Monthly Levels Pro est l’outil indispensable pour tous les traders souhaitant analyser les tendances à long terme et repérer rapidement les zones clés de support et de résistance . Cet indicateur affiche les niveaux High (Haut), Low (Bas), Open (Ouverture) et Close (Fermeture) d’une bougie mensuelle, révélant instantanément les zones où le prix est susceptible de ré
Indicateur Monthly Levels + Pin Bar Pro Description L’indicateur Monthly Levels + Pin Bar Pro combine la puissance des niveaux clés mensuels (High, Low, Open, Close) avec la détection automatique des figures de retournement Price Action (Pin Bars) . Conçu pour les traders techniques et institutionnels, il permet d’anticiper les zones de réaction du marché et de générer des signaux visuels clairs directement sur le graphique. Fonctionnalités principales Niveaux mensuels automatiques :
Yearly Levels Pro
N'da Lemissa Kouame
Yearly Levels Pro v1.0 – Indicateur annuel de support et résistance Version : 1.0 Développeur : KOUAME N'DA LEMISSA Plateforme : MetaTrader 5 (MT5) Type : Indicateur technique / Zones de prix annuelles Description générale Yearly Levels Pro v1.0 , développé par KOUAME N'DA LEMISSA , est un indicateur puissant qui permet aux traders d’identifier rapidement les niveaux clés annuels du marché. Il calcule automatiquement les prix Open, High, Low et Close d’une année spécifique et les affiche directe
Quarterly Levels Pro v1.0 – Notice Commerciale Nom du produit : Quarterly Levels Pro v1.0 Développeur : KOUAME N'DA LEMISSA Version : 1.0 Description : Quarterly Levels Pro , développé par KOUAME N'DA LEMISSA , est un indicateur professionnel pour MetaTrader 5 qui affiche automatiquement les niveaux High, Low, Open et Close d’une période trimestrielle. Il permet aux traders de visualiser clairement les zones clés de support et résistance sur le graphique, facilitant la prise de décision pour les
Notice Commerciale – MQL5 Market Multi-Timeframe Levels Pro v1.0 Développeur : KOUAME N’DA LEMISSA Description Multi-Timeframe Levels Pro v1.0 est un indicateur puissant qui trace automatiquement les niveaux clés Daily, Monthly, Quarterly et Yearly (High, Low, Open, Close) directement sur votre graphique. Ces niveaux historiques sont utilisés par les traders professionnels pour identifier : Les zones de support et résistance majeures Les points de retournement probables Les zones de breakout
Marubozu Pro MT5
N'da Lemissa Kouame
Notice Commerciale – Marubozu Pro (MT5) Description Marubozu Pro est un indicateur professionnel pour MetaTrader 5 qui détecte automatiquement les bougies Marubozu (haussières et baissières) directement sur votre graphique. Il vous aide à identifier les zones de force du marché, là où les acheteurs ou les vendeurs prennent totalement le contrôle, en affichant des flèches visuelles d’achat et de vente. Cet outil est conçu pour être simple, efficace et rapide , idéal pour le trading manuel ou c
ETE Detector – Head & Shoulders Indicator Transformez vos graphiques en opportunités de trading claires et visuelles ! À propos de l’indicateur L’indicateur ETE Detector détecte automatiquement les figures Épaule-Tête-Épaule (ETE) et ETE inversées (ETEi) , les configurations classiques de retournement de tendance. Fini les heures passées à chercher manuellement les figures : votre analyse devient rapide, précise et visuelle . Ce que vous obtenez Détection automatique des figures de retourn
Fusion Monthly Levels + PinBar + Marubozu Description Cet indicateur unique combine trois outils puissants de l’analyse technique en un seul : Niveaux mensuels (High, Low, Open, Close) – pour repérer les zones clés de support et de résistance. Détection des PinBars – figure de retournement fiable signalant des rejets de prix. Détection des Marubozu – bougies de tendance fortes indiquant un momentum directionnel. Grâce à cette fusion, vous obtenez un outil visuel, complet et réactif pour an
ABCD Lemissa + Monthly Levels + PinBar + Marubozu Indicator Description Cet indicateur fusionne plusieurs outils puissants pour fournir une vision complète du marché : ABCD Lemissa – Détecte automatiquement les structures ABCD avec points A, B, C et D , zones de support/résistance, et flèches d’achat/vente. Monthly Levels – Affiche les niveaux High, Low, Open, Close des bougies mensuelles pour repérer les zones clés. PinBar & Marubozu – Détecte les bougies PinBar (signaux d’inversion) et Maru
Order Block Pro (MQL5) – Version 1.0 Auteur : KOUAME N'DA LEMISSA Plateforme : MetaTrader 5 Description : Order Block Pro est un indicateur avancé conçu pour détecter automatiquement les Order Blocks haussiers et baissiers sur votre graphique. Grâce à une analyse précise des bougies de consolidation et des bougies suivantes de forte impulsion, cet indicateur vous permet d’identifier les zones clés où les mouvements de prix sont susceptibles de s’accélérer. Cet outil est parfait pour les traders
ETE Detector v4.0 (Head & Shoulders) Auteur : KOUAME N’DA LEMISSA Version : 4.0 Plateforme : MetaTrader 5 Type d’indicateur : Graphique / Signaux de trading visuels Description générale L’ ETE Detector v4.0 est un indicateur technique conçu pour identifier automatiquement les figures chartistes “Épaule-Tête-Épaule” (ETE) classiques et inversées sur les graphiques MT5. Ces motifs sont largement utilisés pour anticiper les retournements de tendance. Grâce à cet outil, les traders peuvent : Détecte
DÉTECTEUR DE PUISSANCE ETE v5.0 (Head & Shoulders Pro) Détection Automatique des Figures "Tête et Épaules" L'indicateur ETE DETECTOR POWER v5.0 est un outil professionnel conçu pour les traders qui souhaitent anticiper les retours majeurs du marché grâce à l'une des figures chartistes les plus puissantes : la Tête et Épaules (ETE) et sa variante inversée. Grâce à son système optimisé et intelligent de gestion d'objets (MaxObjects) , l'indicateur reste fluide et lisible, même sur des graphiqu
Dynamique mensuelle des plages hautes et basses v1.0 Auteur : KOUAME N'DA LEMISSA Description : L'indicateur Monthly High & Low Range Dynamique affiche les niveaux clés d'un mois sur votre graphique, avec des fonctionnalités avancées de suivi dynamique. Il permet de visualiser facilement les zones de support et de résistance mensuelles, ainsi que les zones où le prix tend à dépasser ou à tester ces niveaux, offrant ainsi des opportunités de trading précis. Fonctions principales : Mensu
Monthly High & Low Range Dynamique + Liquidity Zones v1.2 Auteur : KOUAME N'DA LEMISSA Description : Transformez votre analyse du marché avec cet indicateur puissant qui combine : Niveaux Mensuels Clés : High, Low, Open et Close pour identifier les zones de support et résistance les plus importantes. High/Low Range Dynamique : Suivi automatique des variations extrêmes pour détecter les mouvements de prix significatifs. Zones de Liquidité : Rectangles visuels indiquant les zones où les liquidités
Booster Trading Pro Auteur : KOUAME N'DA LEMISSA Plateforme : MetaTrader 5 Type : Indicateur technique multifonction Description Transformez votre analyse de marché avec Booster Trading Pro , l'indicateur tout-en-un qui combine plusieurs outils essentiels pour les traders : Niveaux mensuels clés : haut, bas, ouverture et clôture pour identifier rapidement les zones de support et de résistance. Plage dynamique haute et basse : suivez les mouvements extrêmes des prix au-dessus ou en dessous des
StructureBlocksAuto + MensuelOU Puissance structurelle + précision mensuelle Description Fusion StructureBlocksAuto + MonthlyOR est un indicateur avancé tout-en-un combinant la lecture structurelle du marché (Swing High/Low + blocs automatiques) et la plage d'ouverture mensuelle (Monthly Open Range) . Il permet d'analyser les zones de support/résistance dynamiques , les structures de tendance , et les niveaux clés mensuels , pour une lecture claire du marché et des points d'entrée précis. C
Channel Ultima
N'da Lemissa Kouame
Channel Ultima – Indicateur Multi-Canal Dynamique   Description courte Channel Ultima   est un indicateur avancé qui trace automatiquement   trois canaux dynamiques   du marché. Il offre une   lecture claire des zones de support, de résistance et d'équilibre   , idéale pour les traders techniques et structurels.   Présentation détaillée Channel Ultima   détecte et affiche   trois canaux indépendants   associés sur les pivots majeurs et mineurs du marché. Chaque canal représente une   zon
Filtrer:
Aucun avis
Répondre à l'avis