Quarterly Levels Pro
- 지표
- N'da Lemissa Kouame
- 버전: 1.0
- 활성화: 5
Korean Version (한국어)
Quarterly Levels Pro v1.0 – 상업 공지
제품명:
Quarterly Levels Pro v1.0
개발자:
KOUAME N'DA LEMISSA
버전:
1.0
설명:
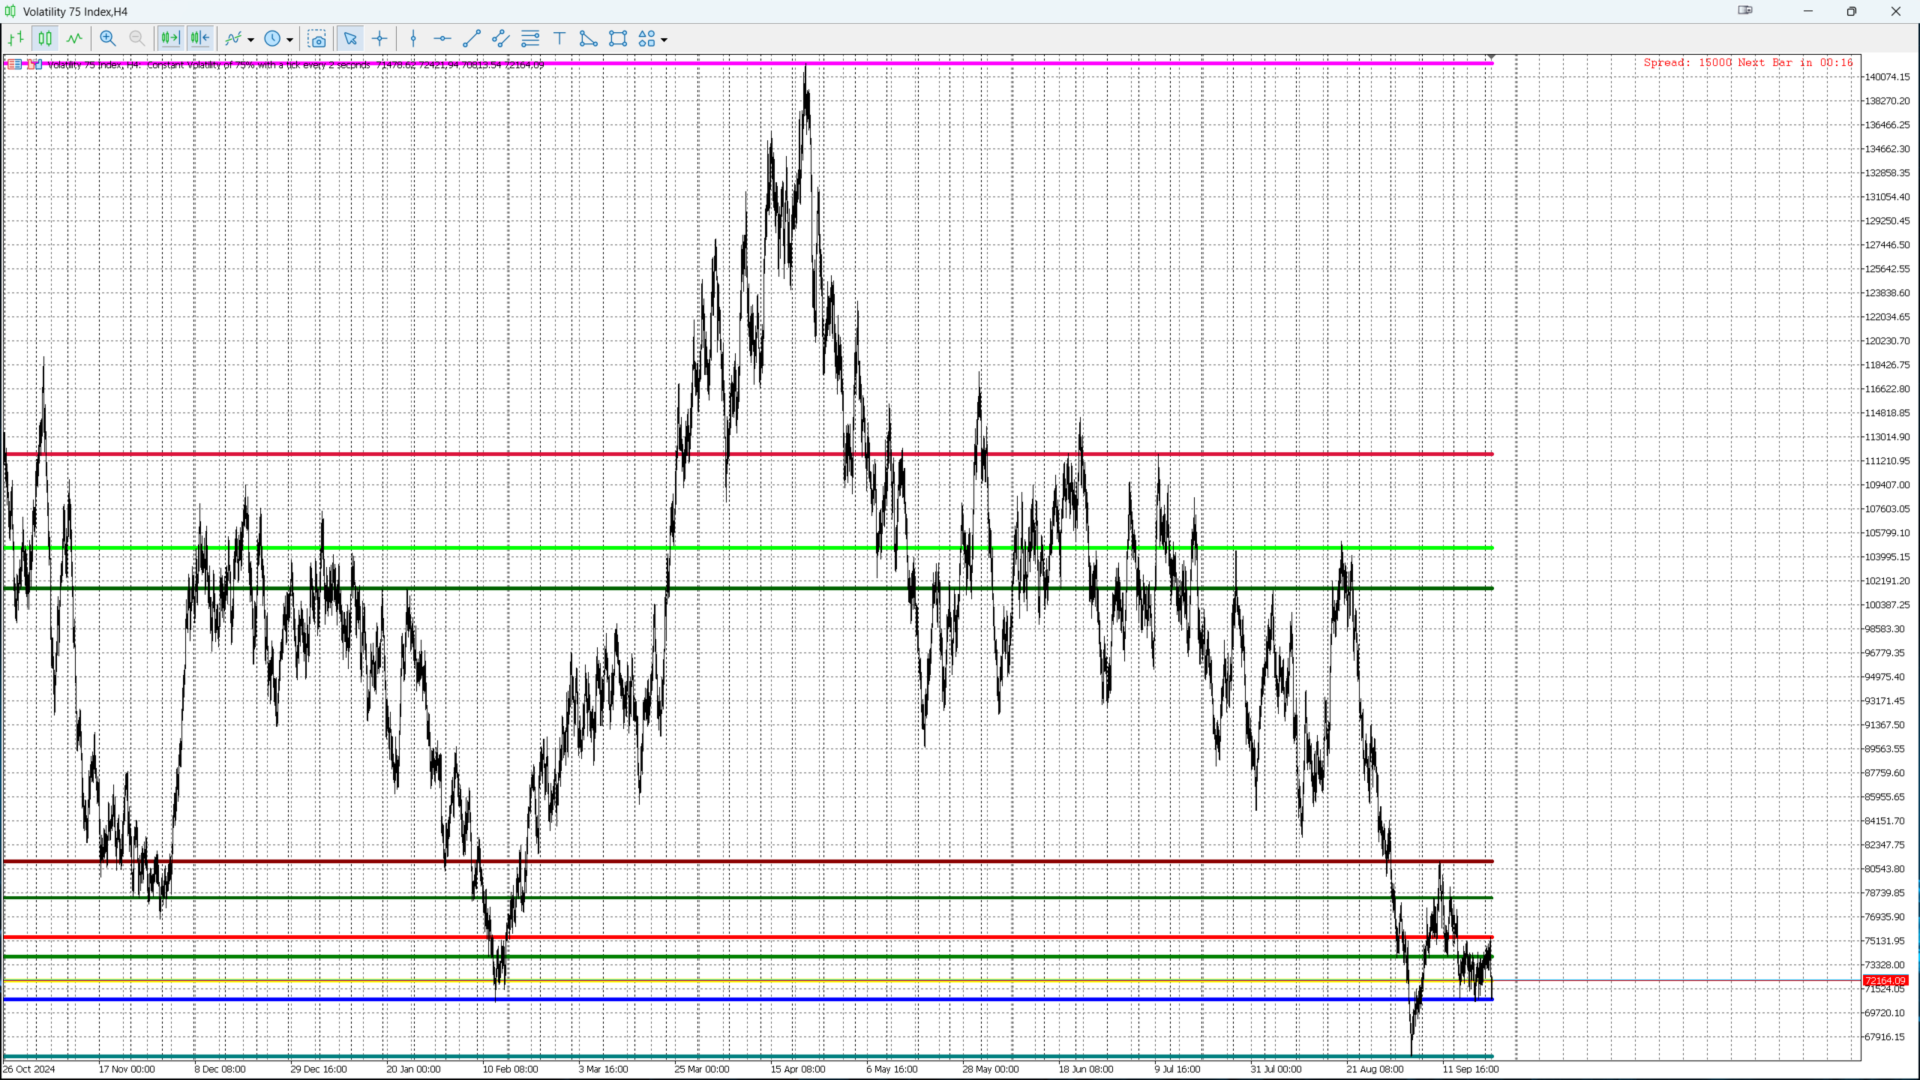
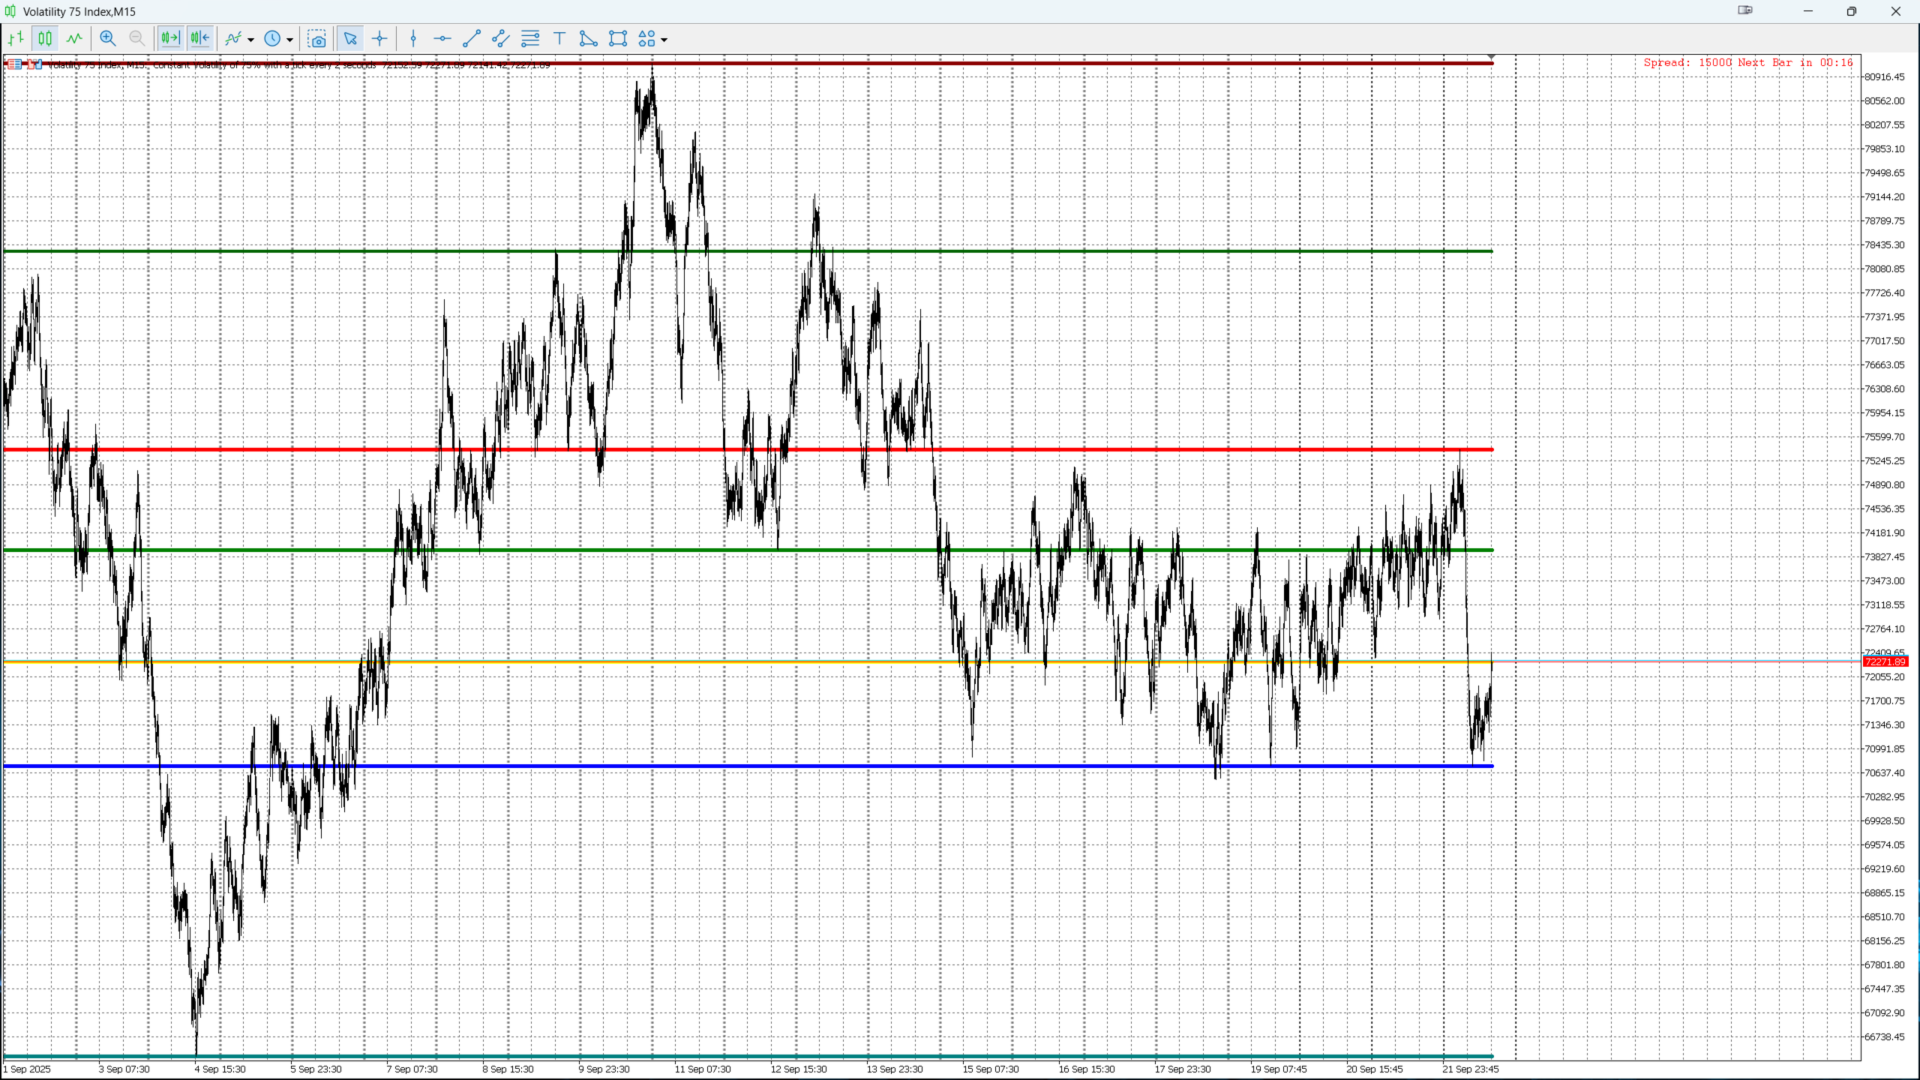
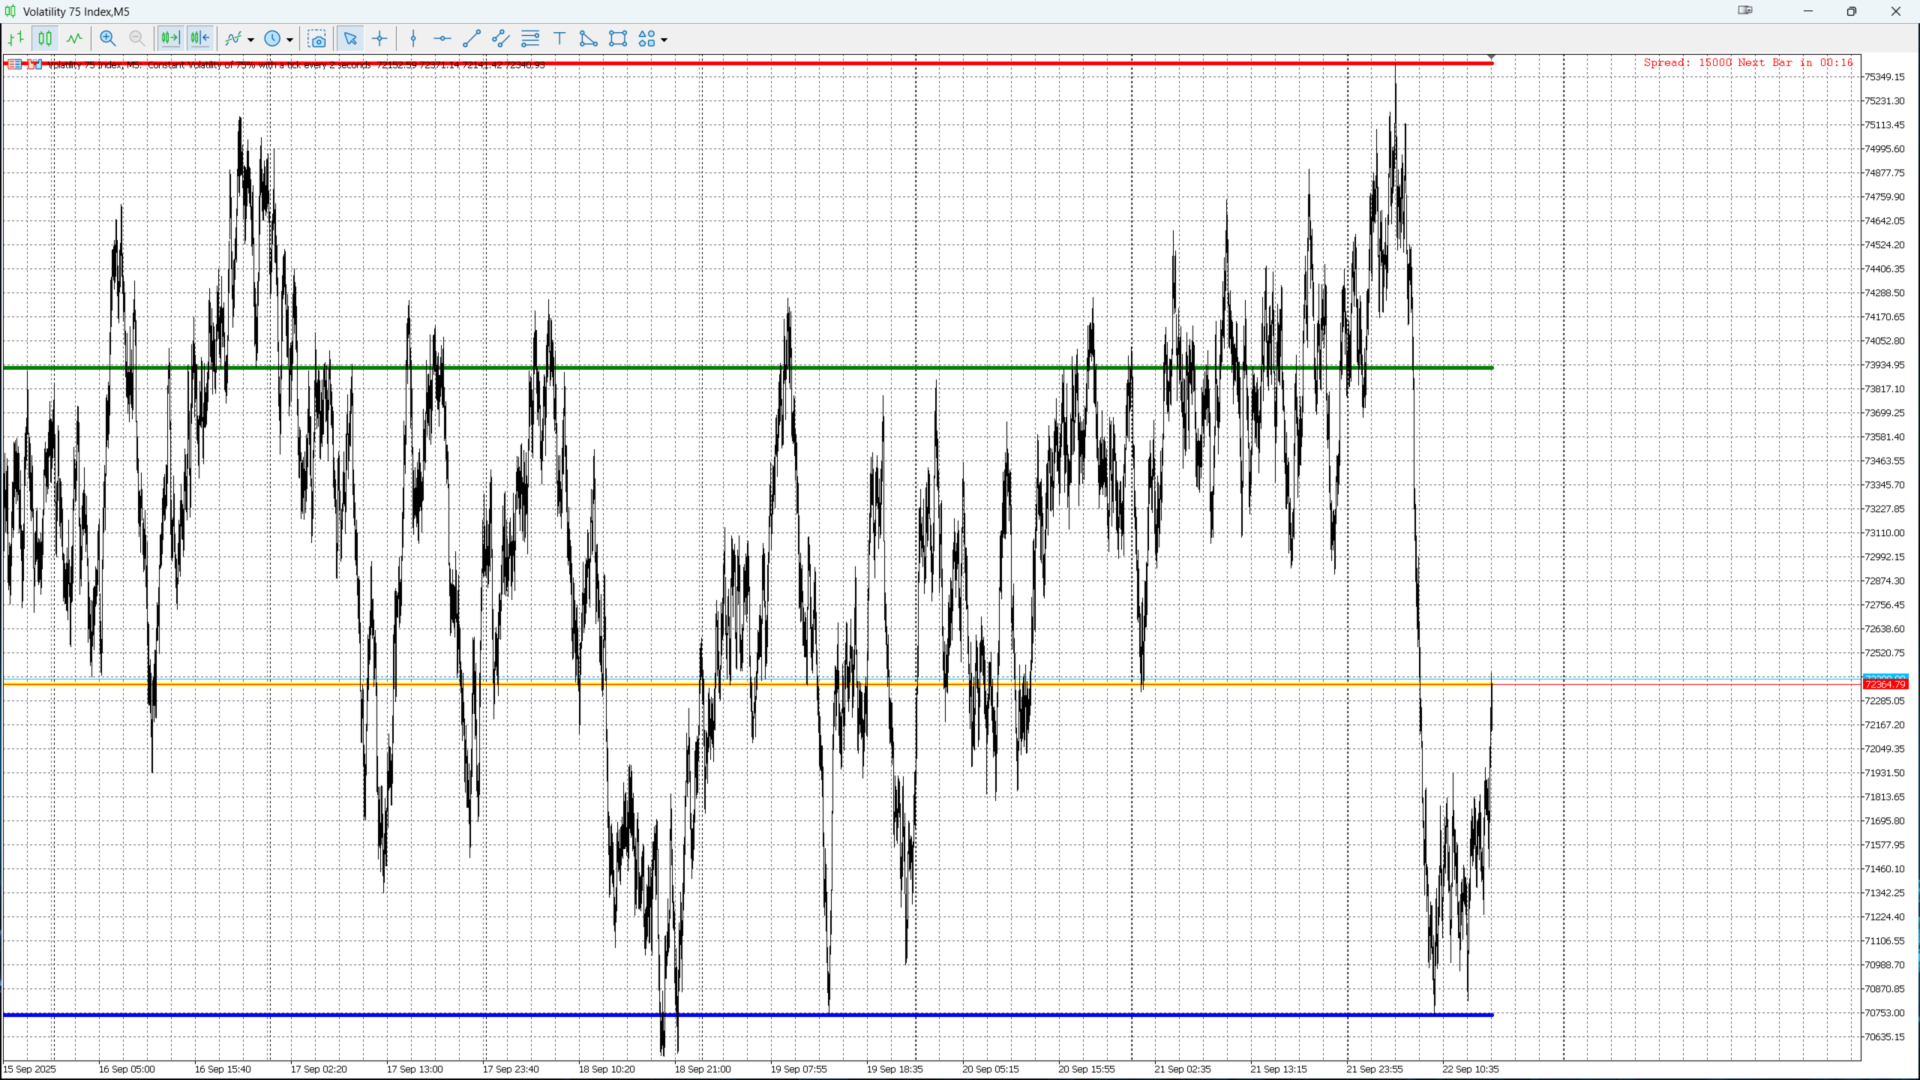
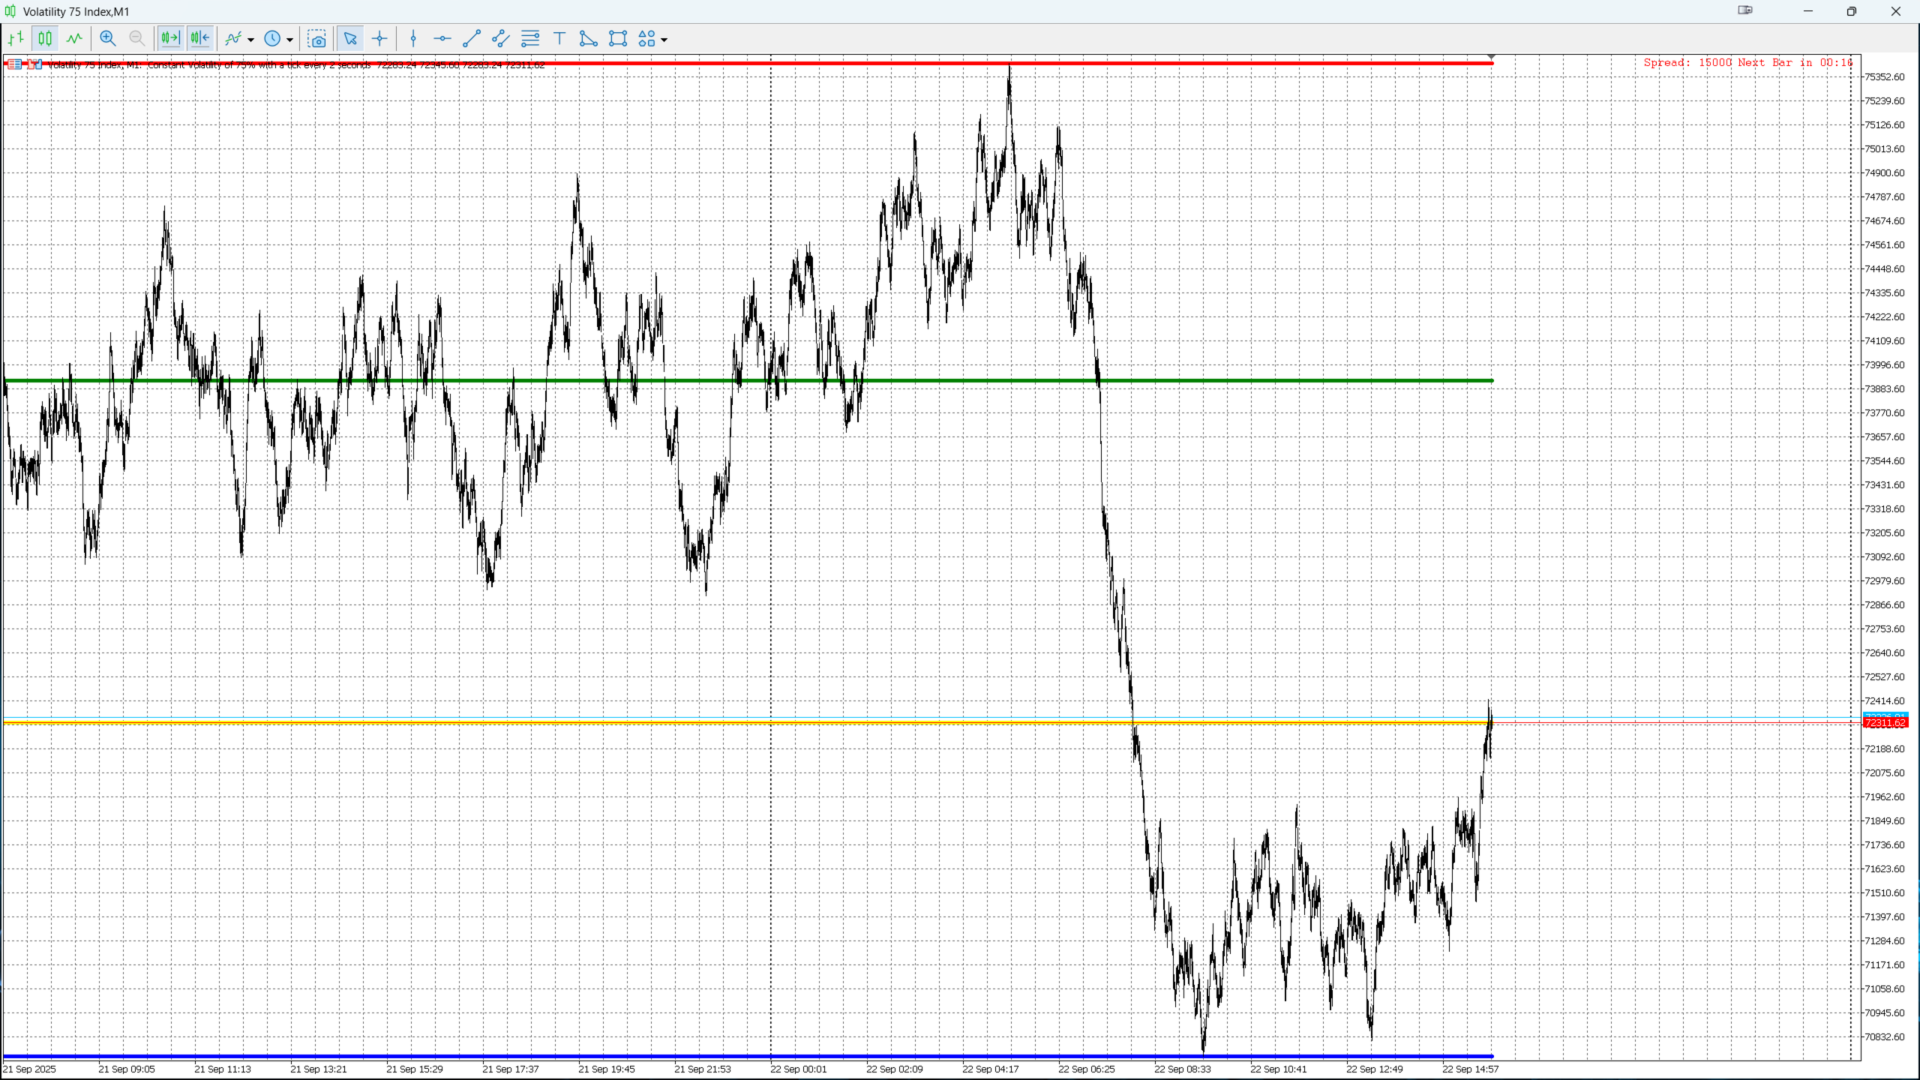
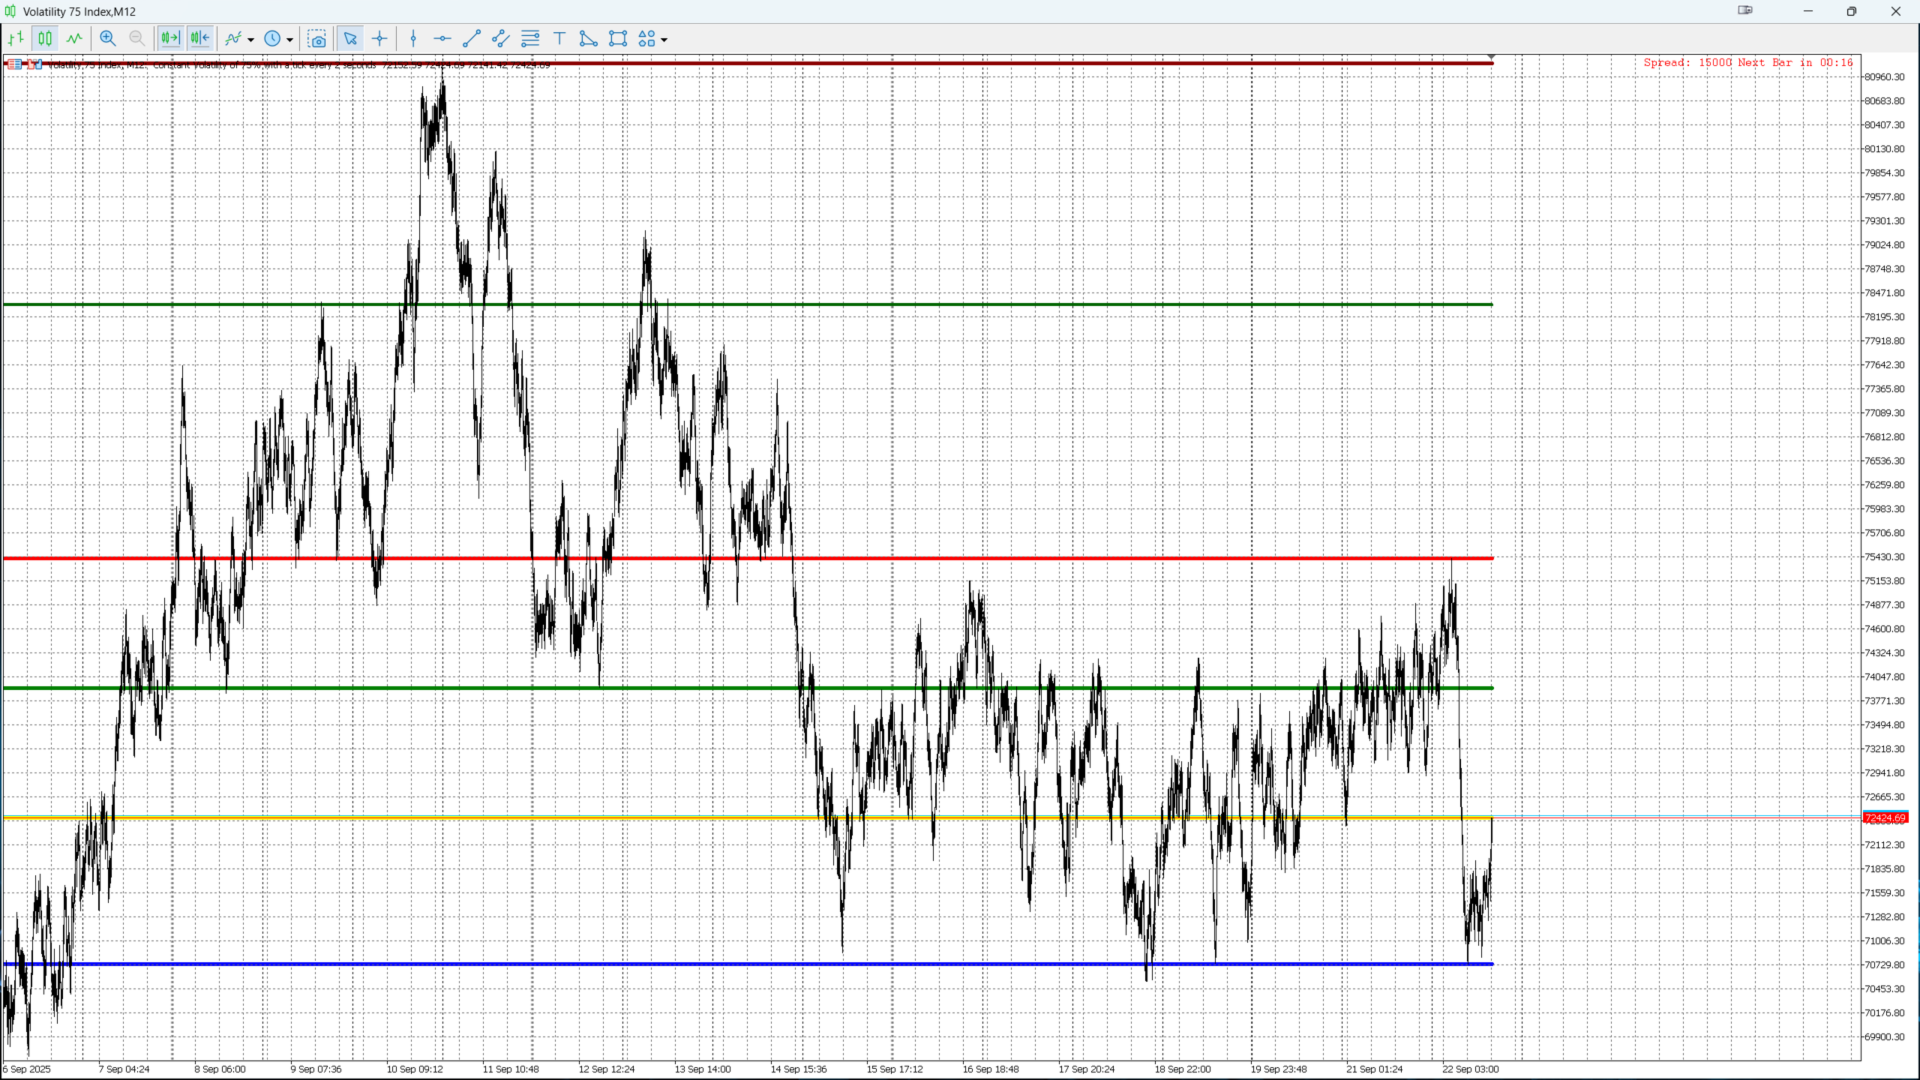
Quarterly Levels Pro 는 KOUAME N'DA LEMISSA 가 개발한 MetaTrader 5용 전문 지표로, 분기별 High, Low, Open, Close 레벨을 자동으로 표시합니다. 트레이더는 차트에서 주요 지지 및 저항 구간을 명확히 시각화하여 중기 거래 의사결정을 용이하게 할 수 있습니다.
주요 기능:
-
분기별 High, Low, Open, Close 레벨 자동 표시
-
각 레벨 색상 사용자 지정 가능:
-
High: 빨강
-
Low: 파랑
-
Open: 초록
-
Close: 주황
-
-
시각적 구분을 위한 선 굵기 조절 가능
-
Quarter_Shift 파라미터를 사용하여 현재, 이전 또는 이전 분기 레벨 표시 가능
-
MT5의 모든 통화쌍 및 금융상품과 호환
파라미터:
| 파라미터 | 설명 | 기본값 |
|---|---|---|
| Quarter_Shift | 이전 분기로 표시 이동: 0 = 현재, 1 = 이전, 등 | 0 |
트레이더 장점:
-
중요한 분기 레벨 빠르게 식별
-
중요 가격 레벨 기반 의사결정 용이 시각화
-
지지/저항 또는 횡보 전략과 호환 가능
설치 방법:
-
Quarterly Levels Pro.mq5 파일을 다음에 복사:
MetaTrader 5\MQL5\Indicators -
MetaTrader 5 열고 에디터에서 지표 재컴파일
-
Navigator → Indicators에서 원하는 차트에 지표 첨부
-
이전 분기 레벨 표시 시 Quarter_Shift 조정
지원 및 업데이트:
문의 또는 향후 업데이트는 MQL5 또는 구매 시 제공된 이메일로 KOUAME N'DA LEMISSA 에게 연락
라이센스:
개인 사용용 상업 제품. KOUAME N'DA LEMISSA 허가 없이 재배포 금지