ON Trade Harmonic Patterns

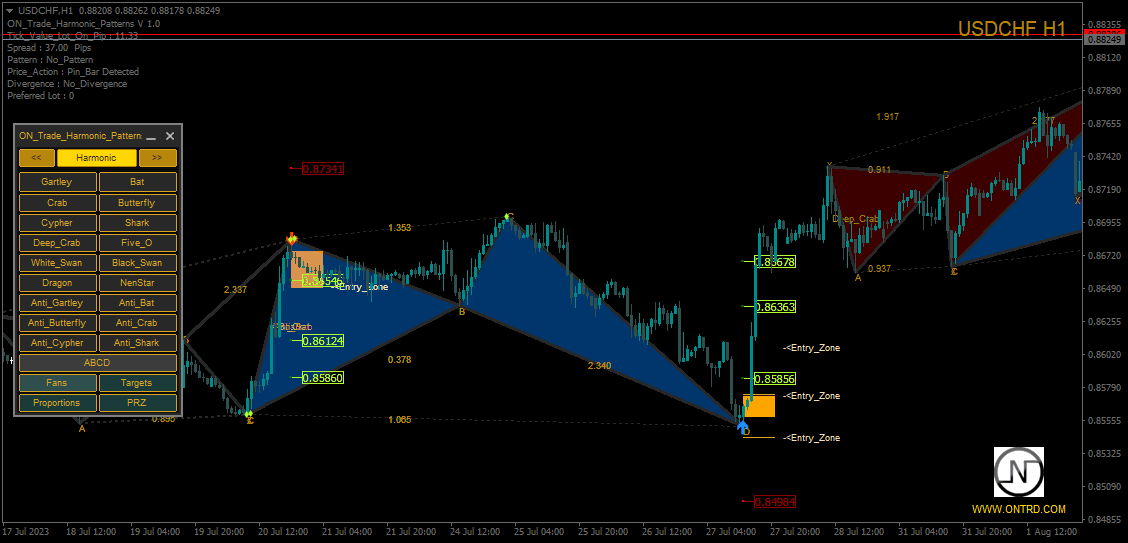
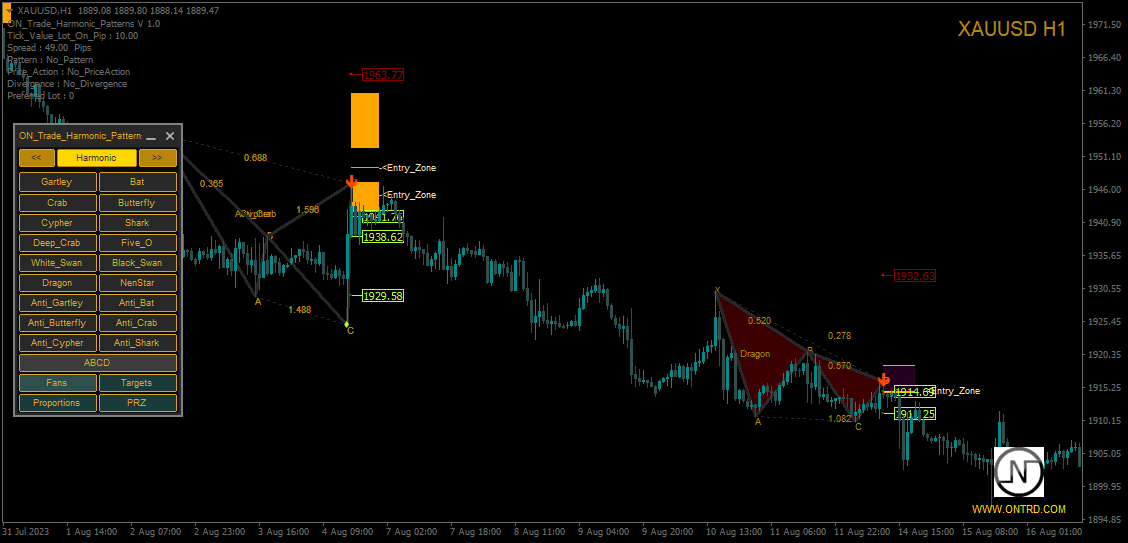
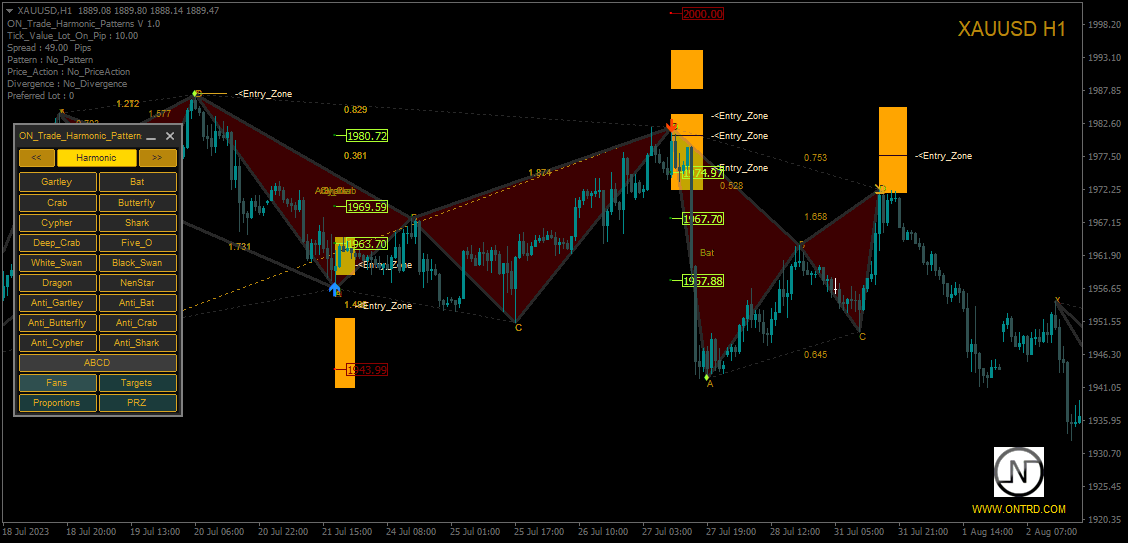
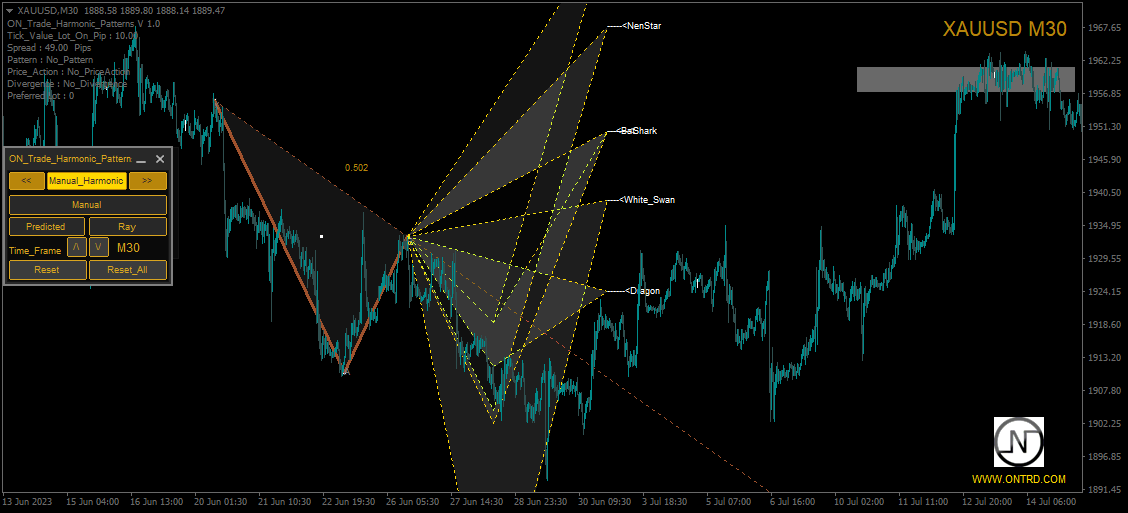
Cet indicateur détectera les motifs harmoniques tracés sur le graphique à l'aide de méthodes manuelles et automatiques.

Ajoutez votre avis, s'il vous plaît.

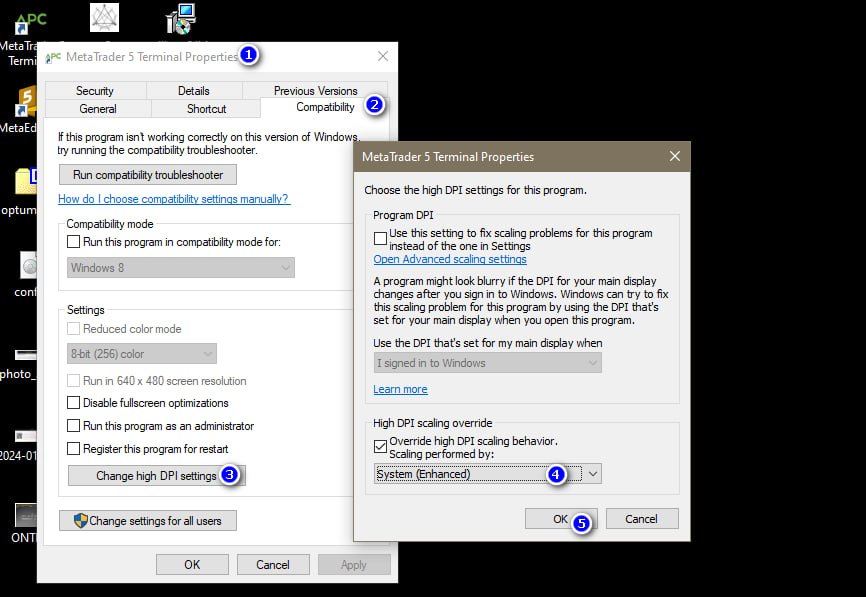
Notes: Cet indicateur dispose d'un panneau de contrôle et il enregistrera chaque réglage (graphique et unité de temps). Vous pouvez le réduire pour avoir plus d'espace sur le graphique et vous pouvez appuyer sur le bouton de fermeture pour masquer toutes les données de l'indicateur sur le graphique si vous préférez travailler avec d'autres outils d'analyse. Lorsque vous utilisez cet indicateur et modifiez les paramètres, ajoutez des indicateurs tels que la moyenne mobile ou les bandes de Bollinger, cet indicateur enregistrera automatiquement le modèle de vos modifications et vous pourrez les charger à tout moment si nécessaire. Si vous utilisez Windows 10, faites un clic droit sur l'icône MetaTrader > Compatibilité > Modifier les paramètres du DPI élevé > Système (amélioré) pour avoir les meilleurs paramètres d'écran (à faire sur les appareils HD). Cet indicateur est essentiellement une interprétation de la théorie du trading harmonique pour détecter les motifs harmoniques sur le graphique. Si vous souhaitez en apprendre davantage, vous pouvez rechercher le livre de Scott Carney intitulé "Harmonic Trading vol 1&2". L'indicateur dispose de lignes d'alerte de prix et de temps. L'indicateur tracera des éventails de Fibonacci sur vos motifs détectés. L'indicateur tracera des rayons de pivots/motifs. L'indicateur dispose d'une calculatrice de lots pour vous aider à gérer votre risque. Vous pouvez charger manuellement des objets dessinés à partir d'unités de temps supérieures dans des unités de temps inférieures. Les boutons de réinitialisation effaceront tous les paramètres enregistrés (Tous / Unité de temps actuelle). L'indicateur dispose d'un système d'alerte/notification qui vous fournira des points cibles/stop/entrée en tant que signal. L'indicateur détectera les divergences (flèches jaunes et orange) qui servent de bonnes confirmations. L'indicateur calculera la meilleure taille de lot pour chaque motif, ce qui est bon pour votre solde avec la valeur du risque que vous avez définie dans les paramètres. L'indicateur détectera également les motifs d'action des prix (Pinbar, InsideBar, OutsideBar). Vous pouvez utiliser ces tampons d'indicateur dans un EA en utilisant ce code:

Paramètres: Use_System_Theme - Choisissez le schéma de couleurs. EA_MODE - Mettez-le sur vrai lorsque vous l'appelez sur un EA. Show_Last_Candle_Counter - Activer/Désactiver le compteur de bougies. Candle_Counter_Color - Couleur du compteur de bougies. Accuracy_Percent - Pourcentage d'exactitude des proportions des motifs. Bullish_Pattern_Color - Couleur des motifs haussiers. Bearish_Pattern_Color - Couleur des motifs baissiers. ABCD_Color - Couleur des motifs AB=CD. Manual_Pattern_Color - Couleur du motif manuel. Targets_Only_Completed_D - Activer/Désactiver l'affichage des cibles uniquement sur les motifs terminés. Font_Color - Couleur du texte. Fan_Color - Couleur des éventails. Send_Alert - Activer/Désactiver la fonction d'alerte. Send_Notification - Activer/Désactiver la fonction de notification. Send_Email - Activer/Désactiver la fonction d'e-mail. InsideBar_Sensor - Activer/Désactiver la détection de l'InsideBar de l'action des prix. OutSideBar_Sensor - Activer/Désactiver la détection de l'OutsideBar de l'action des prix. PinBar_Sensor - Activer/Désactiver la détection du PinBar. Risk_Percent - Pourcentage de risque pour le calcul de la valeur du stop loss des motifs et du solde du compte. Lot_Calculate_On - Choisissez le calcul du risque entre une valeur statique ou un pourcentage. History_Bars - Nombre maximum de barres.


Produits recommandés
Overview Harmonic Patterns MT4 is a technical analysis indicator designed for the MetaTrader 5 platform. It identifies and displays harmonic price patterns, such as Butterfly, Cypher, Crab, Bat, Shark, and Gartley, in both bullish and bearish directions. The indicator calculates key price levels, including entry, stop loss, and three take-profit levels, to assist traders in analyzing market movements. Visual elements and customizable alerts enhance usability on the chart. Features Detects six ha
This is an arrow indicator without a future function,developed based on the most advanced profit trading algorithms.It has the most innovative and advanced dual trend analysis module, as well as the latest and highly effective market trend prediction algorithm.Trends are your friends, and following larger trends can earn the maximum profit in foreign exchange. This indicator helps traders identify current trends and track them. Someone once made a profit of 10 times in a week by relying on it.No
Reversal Pattern Pro
Boonyapagorn Rodvattanajinda
Reversal Patterns Pro Reversal Patterns Pro is a Price Action (PA) analytical tool that scans the reversal patterns.  - Finds and marks the most dependable Japanese candlestick patterns in real-time. - Supports all time frames (Best for Scalping) - Doesn't repaint making it an exceptional indicator for Expert Advisors. Input parameters : - Support & Resistance Mode ( true or false ) for enabling advanced filtering - Donchian Period - RSI Period - RSI Oversold Level - RSI Overbought Level - Al
PZ Harmonacci Patterns
PZ TRADING SLU
3.17 (6)
Trade smarter, not harder: Empower your trading with Harmonacci Patterns This is arguably the most complete harmonic price formation auto-recognition indicator you can find for the MetaTrader Platform. It detects 19 different patterns, takes fibonacci projections as seriously as you do, displays the Potential Reversal Zone (PRZ) and finds suitable stop-loss and take-profit levels. [ Installation Guide | Update Guide | Troubleshooting | FAQ | All Products ] It detects 19 different harmonic pric
The indicator provides a superior alternative to price action analysis. It enables the identification of normalized patterns, which are then transformed into a graphical representation to forecast future steps within a time series. In the top-left corner, you'll find information regarding the expected prediction accuracy, determined through a complex MSQE calculation. You have the flexibility to adjust the time window, making it easy to validate the indicator's performance. Additionally, you can
Trade with Gann on your side!! MASTER CIRCLE 360 CIRCLE CHART, originally created by Gann admitted that this is “The Mother of all charts”. It is one of the last studies that this great trader left for us. The numeric tab le is apparently quite simple like all the tables and is based on square numbers, the SQUARE OF 12 and is by evolution, one of the most important square numbers. Here we can find CYCLE, PRICE AND TIME thanks to angles and grades, to show past and future support and resistance.
Crazy Dancing moving RES/SUP Levels Automatic redrawing of moving Supports and resistances levels  to indicate price breaking supports (signal SELL)  or breaking resistance levels (signal BUY) Very simple appearing indicator but very clever and smart too !!!! Main Inputs: # of bars for the support and resistances levels + the initial shift from start + moving average for filter signaling Smaller values for bars /shift inputs when using Higher Time frames (D1-H4) and the reverse higher values for
PZ 123 Pattern
PZ TRADING SLU
1 (1)
Unlock powerful breakout opportunities The 123 Pattern is one of the most popular, powerful and flexible chart patterns. The pattern is made up of three price points: a bottom, a peak or valley, and a Fibonacci retracement between 38.2% and 71.8%. A pattern is considered valid when the price breaks beyond the last peak or valley, moment at which the indicator plots an arrow, rises an alert, and the trade can be placed. [ Installation Guide | Update Guide | Troubleshooting | FAQ | All Products ]
All Symbols   AND  All Time frames Scan                                                                                                                 Document Introduction   The ABCD is a basic harmonic pattern. The ABCD pattern is a visual, geometric chart pattern comprised of three consecutive price swings. It looks like a diagonal lightning bolt and can indicate an upcoming trading opportu
Fibonacci retracements can be used to draw support lines, identify resistance levels, place stop-loss orders and set target prices. The Advanced Automatic Fibonacci retracements draws automatically all the levels. You have a lot of options to choose. For exemple you can use the tracements of another time frame (MTF) in the current chart, you can also choose between the closest level or less close to draw the retracements. You can also add 2 levels of your choice. You can add levels extensions o
Levels Market
Vitalii Zakharuk
Levels Market is one of the simplest, but no less effective tools from this. Pivot points can be built from these levels, levels are constructed as statistical significance at a given point in time. Trading by levels is a classic in the work of a trader. You can use them as a ready-made trading strategy or as an additional filter in your trading system. In the settings you can specify the offset for building levels. Interpretation of levels: Lines 8/8 and 0/8 (Final Resistance). These lines ar
Monster Harmonic Indicator
Paul Geirnaerdt
4.59 (29)
Monster Harmonics Indicator is a harmonic pattern indicator. It recognizes Gartley, Bat, Crab, Butterfly, Cypher, White Swan, Black Swan, Shark and several other patterns. Projected patterns that are not yet completed are recognized, too. Monster even shows the PRZ (Potential Reversal Zone). Users can add their own user defined patterns to Monster. Besides the current pattern, Monster also shows all patterns in the symbols history. Monster will provide alerts for developing patterns. Introduced
"Impulses and Corrections 4" is created to help traders navigate the market situation. The indicator shows multi-time frame upward and downward "Impulses" of price movements. These impulses are the basis for determining the "Base" , which is composed of zones of "Corrections" of price movements, as well as "Potential" zones for possible scenarios of price movement. Up and down impulses are determined based on a modified formula of Bill Williams' "Fractals" indicator. The last impulse is always
Introduction to X3 Chart Pattern Scanner X3 Cherart Pattern Scanner is the non-repainting and non-lagging indicator detecting X3 chart patterns including Harmonic pattern, Elliott Wave pattern, X3 patterns, and Japanese Candlestick patterns. Historical patterns match with signal patterns. Hence, you can readily develop the solid trading strategy in your chart. More importantly, this superb pattern scanner can detect the optimal pattern of its kind. In addition, you can switch on and off individu
Master Scalping M1 est un indicateur innovant qui utilise un algorithme pour déterminer rapidement et avec précision la tendance. L'indicateur calcule le temps d'ouverture et de fermeture des positions, les algorithmes de l'indicateur vous permettent de trouver les moments idéaux pour entrer dans une transaction (acheter ou vendre un actif), ce qui augmente le succès des transactions pour la plupart des commerçants. Avantages de l'indicateur : Facile à utiliser, ne surcharge pas le graphique ave
Trendlines Chart Patterns Indicator (MT4) Automated Chart Patterns & Breakout Signals for MT4: Trade with Precision! The "Trendlines Chart Patterns Indicator" is an advanced trading tool for MetaTrader 4 (MT4) , meticulously designed to identify high-probability buy and sell signals based on dynamically forming, robust trend lines and popular chart patterns . This powerful forex indicator automates the complex process of identifying patterns like triangles, flags, ranges, ascending/descending tr
Voenix
Lorentzos Roussos
4.58 (12)
Motifs harmoniques , scanner et commerçant  Patrons inclus : Modèle ABCD Motif Gartley Motif chauve-souris Modèle de chiffrement Modèle 3Drives Motif cygne noir Motif cygne blanc Motif Quasimodo ou motif Over Under Modèle de chauve-souris alternative Motif papillon Motif de crabe profond Motif crabe Motif requin Motif FiveO Motif tête et épaules Motif triangle ascendant Modèle un deux trois Et 8 motifs personnalisés Voenix est un scanner de modèles harmoniques multi-périodes et multi-paires, pr
The MTC Equidistant Channel indicator is a helping tool for the traders who use: The supports and resistances lines; The trends; Fibonacci levels; It's a combination between the ZigZag indicator and the Equidistant chanel, It helps to detect the break-outs in many strategies and shows the possible entry points. The indicator capabilities : Drawing the Equidistant chanel automatically on the ZigZag indicator. The possibility of changing the ZigZag indicator settings. The indicator works on all ti
Daily Candle Predictor est un indicateur qui prédit le cours de clôture d'une bougie. L'indicateur est principalement destiné à être utilisé sur les graphiques D1. Cet indicateur convient à la fois au trading forex traditionnel et au trading d'options binaires. L'indicateur peut être utilisé comme un système de trading autonome, ou il peut servir de complément à votre système de trading existant. Cet indicateur analyse la bougie actuelle, calcule certains facteurs de force à l'intérieur du corps
RTrends
Nikolay Likhovid
The RTrends indicator does two things: first, it automatically draws the layout of the price chart by plotting trend lines and, secondly, it produces bearish and bullish signals. The layout reflects the fractal nature of the market. Trends from different time horizons are applied simultaneously on the chart. Thus, from a single chart a trader can see trend lines of higher timeframes. The lines, depending on the horizon, differ in color and width: the older the horizon, the thicker the line is. T
The indicator detects and displays М. Gartley's Butterfly pattern. The pattern is plotted by the extreme values of the ZigZag indicator (included in the resources, no need to install). After detecting the pattern, the indicator notifies of that by the pop-up window, a mobile notification and an email. The pattern and wave parameters are displayed on the screenshots. The default parameters are used for demonstration purposes only in order to increase the amount of detected patterns. Parameters z
All Harmonic Patterns Scanner for MT4 The All Harmonic Patterns Scanner for MT4 is a comprehensive tool developed to detect and illustrate a wide range of harmonic chart patterns on the MetaTrader 4 trading terminal. This indicator evaluates pivot formations and price movement behavior to automatically map out formations such as the Gartley, Bat, Butterfly, along with numerous standard and nonstandard harmonic setups on the chart. Beyond the traditional patterns, the scanner is also capable of i
YK-Fibo Pivot Indicator: Trade Smarter with Fibonacci Pivot Points The YK-Fibo Pivot Indicator is a powerful technical analysis tool that combines the precision of Fibonacci retracements with the insights of Pivot Points. Whether you're a novice or seasoned trader, this indicator empowers you to spot profitable opportunities in the market with ease. Why Choose YK-Fibo Pivot? Pinpoint Support & Resistance: By calculating Fibonacci levels based on the previous day's high, low, and close prices, y
Crazy Dancing moving RES/SUP Levels Automatic redrawing of moving Supports and resistances levels  to indicate price breaking supports (signal SELL)  or breaking resistance levels (signal BUY) Very simple appearing indicator but very clever and smart too !!!! Main Inputs: # of bars for the support and resistances levels + the initial shift from start + moving average for filter signaling Smaller values for bars /shift inputs when using Higher Time frames (D1-H4) and the reverse higher values for
Forex Gump
Andrey Kozak
2.4 (5)
Forex Gump is a fully finished semi-automatic trading system. In the form of arrows, signals are displayed on the screen for opening and closing deals. All you need is to follow the instructions of the indicator. When the indicator shows a blue arrow, you need to open a buy order. When the indicator shows a red arrow, you need to open a sell order. Close orders when the indicator draws a yellow cross. In order to get the most effective result, we recommend using the timeframes H1, H4, D1. There
L'indicateur SMC Venom Model BPR est un outil professionnel pour les traders travaillant dans le concept Smart Money (SMC). Il identifie automatiquement deux modèles clés sur le graphique des prix: FVG   (Fair Value Gap) est une combinaison de trois bougies, dans laquelle il y a un écart entre la première et la troisième bougie. Forme une zone entre les niveaux où il n'y a pas de support de volume, ce qui conduit souvent à une correction des prix. BPR   (Balanced Price Range) est une combinaiso
Classic Fractals indicator for MT4, with additional Trendlines connecting the latest couples of fractals ( fractals are showing highest high, and lowest low on each period) Rules for trendlines: -if new top fractal is below the last one = new resistance line -if new bot fractal is above the last one = new support line -Trendlines can be hidden -Fractals can be hidden Fractal Period = can be both even or uneven number, as it is setting for half (one side) of the bars sequence for findin
Auto Levels
Yaroslav Varankin
Auto Level this tool is able to determine the levels of support and resistance. search and display when the price has broken through the level and when it pushed off from it. the indicator can be useful if you use resistance support levels in your trading. or the highs and lows of the price, then it will greatly simplify your work and help you more quickly and more accurately determine the rebound or breakdown of the current trend or tendencies level. blue line bottom uptrend red line on top dow
Gartley Projection D
Oleksandr Medviediev
3.71 (7)
The indicator identifies the harmonic patterns (XABCD) according to developments of H.M.Gartley ( "Profits in the Stock Market" , 1935г). It projects D-point as a point in the perspective projection (specify ProjectionD_Mode = true in the settings). Does not redraw. When a bar of the working timeframe closes, if the identified pattern point has not moved during Patterns_Fractal_Bars bars, an arrow appears on the chart (in the direction of the expected price movement). From this moment on, the ar
"Auto FIBO Pro" Crypto_Forex indicator - est un excellent outil auxiliaire dans le trading ! - L'indicateur calcule et place automatiquement sur le graphique les niveaux de Fibo et les lignes de tendance locales (couleur rouge). - Les niveaux de Fibonacci indiquent les zones clés où le prix peut s'inverser. - Les niveaux les plus importants sont 23,6 %, 38,2 %, 50 % et 61,8 %. - Vous pouvez l'utiliser pour le scalping inversé ou pour le trading en grille de zones. - Il existe également de nomb
Les acheteurs de ce produit ont également acheté
Scalper Inside PRO
Alexey Minkov
4.7 (69)
An exclusive indicator that utilizes an innovative algorithm to swiftly and accurately determine the market trend. The indicator automatically calculates opening, closing, and profit levels, providing detailed trading statistics. With these features, you can choose the most appropriate trading instrument for the current market conditions. Additionally, you can easily integrate your own arrow indicators into Scalper Inside Pro to quickly evaluate their statistics and profitability. Scalper Inside
Dynamic Forex28 Navigator
Bernhard Schweigert
5 (6)
Dynamic Forex28 Navigator - L'outil de trading Forex de nouvelle génération. ACTUELLEMENT 49 % DE RÉDUCTION. Dynamic Forex28 Navigator est l'évolution de nos indicateurs populaires de longue date, combinant la puissance de trois en un : Advanced Currency Strength28 Indicator (695 avis) + Advanced Currency IMPULSE avec ALERT (520 avis) + CS28 Combo Signals (Bonus). Détails sur l'indicateur https://www.mql5.com/en/blogs/post/758844 Qu'offre l'indicateur de force de nouvelle génération ? Tout
GOLD Impulse with Alert
Bernhard Schweigert
4.64 (11)
Cet indicateur est une super combinaison de nos 2 produits Advanced Currency IMPULSE with ALERT  +   Currency Strength Exotics . Il fonctionne pour tous les cadres temporels et montre graphiquement l'impulsion de force ou de faiblesse pour les 8 principales devises plus un symbole ! Cet indicateur est spécialisé pour montrer l'accélération de la force des devises pour tout symbole comme l'or, les paires exotiques, les matières premières, les indices ou les contrats à terme. C'est le premier
Supply and Demand Dashboard PRO
Bernhard Schweigert
4.8 (20)
Actuellement 20% de réduction ! Ce tableau de bord est un logiciel très puissant qui fonctionne sur plusieurs symboles et jusqu'à 9 horizons temporels. Il est basé sur notre indicateur principal (Best reviews : Advanced Supply Demand ).   Le tableau de bord donne une excellente vue d'ensemble. Il montre :  Les valeurs d'offre et de demande filtrées, y compris l'évaluation de la force de la zone, Les distances en pips vers/et dans les zones, Il met en évidence les zones imbriquées, Il donne 4
Currency Strength Exotics
Bernhard Schweigert
4.88 (33)
ACTUELLEMENT 20% DE RÉDUCTION ! La meilleure solution pour tout débutant ou trader expert ! Cet indicateur est spécialisé pour montrer la force de la devise pour tous les symboles comme les paires exotiques, les matières premières, les indices ou les contrats à terme. C'est le premier de son genre, n'importe quel symbole peut être ajouté à la 9ème ligne pour montrer la force réelle de la devise de l'or, l'argent, le pétrole, DAX, US30, MXN, TRY, CNH etc. Il s'agit d'un outil de trading unique
Actuellement 20% de réduction ! La meilleure solution pour tout débutant ou trader expert ! Ce logiciel de tableau de bord fonctionne sur 28 paires de devises. Il est basé sur 2 de nos principaux indicateurs (Advanced Currency Strength 28 et Advanced Currency Impulse). Il donne un excellent aperçu de l'ensemble du marché Forex. Il montre les valeurs de l'Advanced Currency Strength, la vitesse de mouvement des devises et les signaux pour 28 paires de devises dans tous les (9) délais. Imaginez
The Super Arrow Indicator provides non-repainting buy and sell signals with exceptional accuracy. Key Features No repainting – confirmed signals remain fixed Clear visual arrows: green for buy, red for sell Real-time alerts via pop-up, sound, and optional email Clean chart view with no unnecessary clutter Works on all markets: Forex, gold, oil, indices, crypto Adjustable Parameters TimeFrame Default: "current time frame" Function: Sets the time frame for indicator calculation Options: Can be set
"The Squeeze indicator attempts to identify periods of consolidation in a market. In general the market is either in a period of quiet consolidation or vertical price discovery. By identifying these calm periods, we have a better opportunity of getting into trades with the potential for larger moves. Once a market enters into a "squeeze," we watch the overall market momentum to help forecast the market direction and await a release of market energy." Modified TTM Squeeze Indicator is a modifica
Gann Square of 9
Olga Borovskaia
5 (1)
The only one of its kind square 9 indicator that corresponds to the real situation on Gannzilla! The indicator calculates price levels by Square 9 and dates by Square 9.  All price and time levels are 100% consistent with the location on Square 9 (Gannzila). This tool will be a great solution for determining the price and time levels using the methods of the legendary trader William Delbert Gann.
Cycle Sniper
Elmira Memish
4.39 (36)
Please contact us after your purchase and we will send you the complimentary indicators to complete the system Cycle Sniper is not a holy grail but when you use it in a system which is explained in the videos, you will feel the difference. If you are not willing to focus on the charts designed with Cycle Sniper and other free tools we provide, we recommend not buying this indicator. We recommend watching the videos about the indiactor and system before purchasing. Videos, settings  and descri
RelicusRoad Pro
Relicus LLC
4.63 (106)
Combien de fois avez-vous acheté un indicateur de trading avec de **grands backtests,** une **preuve de performance sur compte réel** avec des chiffres fantastiques et des **statistiques partout**, mais après l'avoir utilisé, vous **finissez par vider votre compte ?** Vous ne devriez pas faire confiance à un signal seul, vous devez savoir pourquoi il est apparu en premier lieu, et c'est ce que RelicusRoad Pro fait de mieux ! Manuel de l'utilisateur + Stratégies + Vidéos de formation + Groupe pr
Volatility Trend System - un système de trading qui donne des signaux pour les entrées. Le système de volatilité donne des signaux linéaires et ponctuels dans le sens de la tendance, ainsi que des signaux pour en sortir, sans redessiner ni retarder. L'indicateur de tendance surveille la direction de la tendance à moyen terme, montre la direction et son changement. L'indicateur de signal est basé sur les changements de volatilité et montre les entrées sur le marché. L'indicateur est équipé de pl
TPSpro RFI Levels
Roman Podpora
4.85 (27)
Zones de retournement - niveaux / Zones actives d'un acteur majeur INSTRUCTIONS RUS   /   INSTRUCTIONS   ENG   /   Version MT5 CHAQUE ACHETEUR DE CET INDICATEUR       OBTENEZ EN PLUS   GRATUITEMENT   : Accès de 3 mois       aux signaux de trading du service       SUPER SIGNAUX       — points d’entrée prêts à l’emploi selon l’algorithme TPSproSYSTEM. Accès de 3 mois       aux supports de formation avec mises à jour régulières - immersion dans la stratégie et la croissance professionnelle. Assist
Core Principles Swing Angle Measurement   Swing angles are calculated by measuring the degree of price movement between swing highs and lows over time. Steeper angles (typically 45+ degrees) indicate stronger momentum and potentially more profitable trading opportunities. Traders use various timeframes to identify these patterns, from intraday charts to weekly swings. Momentum Confirmation   High degree swing angles often coincide with strong momentum indicators like RSI breakouts, volume spikes
Trend Arrow Super
Aleksandr Makarov
5 (2)
Trend Arrow Super The indicator not repaint or change its data. A professional, yet very easy to use Forex system. The indicator gives accurate BUY\SELL signals. Trend Arrow Super is very easy to use, you just need to attach it to the chart and follow simple trading recommendations. Buy signal: Arrow + Histogram in green color, enter immediately on the market to buy. Sell signal: Arrow + Histogram of red color, enter immediately on the market to sell.
Gold Channel is a volatility-based indicator, developed with a specific timing algorithm for the XAUUSD pair, which consists of finding possible corrections in the market. This indicator shows two outer lines, an inner line (retracement line) and an arrow sign, where the theory of the channel is to help identify overbought and oversold conditions in the market. The market price will generally fall between the boundaries of the channel. If prices touch or move outside the channel it is a tradi
Trend Reversal – Votre allié pour identifier les renversements de tendance sur MT4 Vous recherchez un outil puissant et intuitif pour améliorer votre analyse de marché et prendre des décisions plus éclairées ? L’indicateur Trend Reversal est conçu spécifiquement pour les traders qui souhaitent identifier avec précision les points de renversement de tendance directement sur la plateforme MetaTrader 4. Grâce à une combinaison d’algorithmes avancés et de techniques éprouvées, Trend Reversal offre
Algo Pumping MT4
Ihor Otkydach
4.94 (16)
PUMPING STATION – Votre stratégie personnelle «tout compris» Nous vous présentons PUMPING STATION – un indicateur Forex révolutionnaire qui transformera votre façon de trader en une expérience à la fois efficace et passionnante. Ce n’est pas seulement un assistant, mais un véritable système de trading complet, doté d’algorithmes puissants pour vous aider à trader de manière plus stable. En achetant ce produit, vous recevez GRATUITEMENT : Fichiers de configuration exclusifs : pour un réglage auto
Entry Points Pro
Yury Orlov
4.61 (170)
Indicateur supérieur pour MT4 fournissant des signaux précis pour entrer dans un trade sans repeindre ! Il peut être appliqué à tous les actifs financiers : forex, cryptocurrencies, métaux, actions, indices.  La version MT5 est ici Il fournira des signaux de trading assez précis et vous dira quand il est préférable d'ouvrir un trade et de le fermer. Regardez la vidéo (6:22) avec un exemple de traitement d'un seul signal qui a rapporté à l'indicateur ! La plupart des traders améliorent leurs
BinaryUniversal
Andrey Spiridonov
BinaryUniversal is a signal indicator for binary options and Forex. In its work, the indicator uses a complex algorithm for generating signals. Before forming a signal, the indicator analyzes volatility, candlestick patterns, important support and resistance levels. The indicator has the ability to adjust the accuracy of the signals, which makes it possible to apply this indicator for both aggressive and conservative trading. The indicator is set in the usual way, it works on any time period and
WeSpread
Anchor Trading S.R.L.S.
The We-Spread mt4 indicator is a spread trading tools and it is suitable for those who want to study the markets with a different approach to the contents that are normally available in online trading bookstores. I think the Spread Trading strategy is one of the best I've ever used in the last few years. This is a unique indicator for spread trading because allow you to study till 3 spreads in one time. What is Spread Trading on forex The Spread Trading is the study of the strength of 2 currency
Presenting one-of-a-kind Gann Indicator for XAUUSD IQ Gold Gann Levels is a non-repainting, precision tool designed exclusively for XAUUSD/Gold intraday trading. It uses W.D. Gann’s square root method to plot real-time support and resistance levels, helping traders spot high-probability entries with confidence and clarity. William Delbert Gann (W.D. Gann) was an exceptional market analyst whose trading technique was based on a complex blend of mathematics, geometry, astrology, and ancient calcul
System Trend Pro
Aleksandr Makarov
5 (2)
System Trend Pro - This is the best trend trading indicator!!! The indicator no repaint!!!  The indicator has   MTF   mode, which adds confidence to trading on the trend (   no repaint   ). How to trade? Everything is very simple, we wait for the first signal (big arrow), then wait for the second signal (small arrow) and enter the market in the direction of the arrow. (See screens 1 and 2.) Exit on the opposite signal or take 20-30 pips, close half of it, and keep the rest until the opposite
Gold Titan King Scalper
Dodong Christian Arnon
Indicator Description GOLD TITAN KING SIGNAL INDICATOR High-Precision Gold Scalping Buy/Sell Signals – Manual Trading Assistant Overview The Gold Titan King Signal Indicator is a manual trading assistant tool designed for high-frequency scalping on Gold (XAUUSD) and other major pairs. It generates clear BUY/SELL signals with precise entry levels, along with adjustable Stop Loss and Take Profit levels displayed directly on the chart. ️ This tool is NOT an EA. It does not execute trades
Indicateur unique qui met en œuvre une approche professionnelle et quantitative pour signifier le trading de réversion. Il capitalise sur le fait que le prix dévie et revient à la moyenne de manière prévisible et mesurable, ce qui permet des règles d'entrée et de sortie claires qui surpassent largement les stratégies de trading non quantitatives. [ Installation Guide | Update Guide | Troubleshooting | FAQ | All Products ] Des signaux de trading clairs Étonnamment facile à échanger Couleurs et t
Special offer! https://www.mql5.com/ru/users/bossik2810 Quantum Entry is a powerful price action trading system built on one of the most popular and widely known strategies among traders: the Breakout Strategy! This indicator produces crystal clear buy and sell signals based on breakouts of key support and resistance zones. Unlike typical breakout indicators, it uses advanced calculations to accurately confirm the breakout! When a breakout occurs, you receive instant alerts. No lag and no repai
Currency Strength Meter 1:Correctly identifying trends in foreign exchange investments is critical. 2:TrendSymbolOneClick quickly detects and displays trends that have just begun and those that have already been in place for an extended period of time. 3:There is also a USD JPY EUR GBP AUD NZD strength function. 4:Volatility allows you to know exactly when there is a major market move. 5:You can save time in your market analysis by using Trend Symbol One Click. 6:Analysis available from 1 minut
Offer 249 down from 350 for the next 3 copies. then back to 350 $ Are you tired of using outdated indicators that leave you guessing where to set your profit targets? Look no further than the AK CAP Opening Range Breakout Indicator. This powerful tool is backed by a US patent and has already helped countless traders pass funded challenges like FTMO. We use it daily on our prop traders and internal funds, and now it's available to you as well. The calculation behind the indicator is incredibly a
Fx Market Dashboard is a very innovative tool that features very professional graphics. Simplifying the reading of the market has always been our prerogative and we believe that with this tool everyone can better understand the market. This tool is mainly concerned with giving us a clear view of what are the strongest and weakest currencies, through this information we can begin to better understand where the market puts money or takes away money. The reading of the percentage logic serves to h
TPSproTREND PrO
Roman Podpora
4.68 (25)
VERSION MT5        —        ИНСТРУКЦИЯ RUS           —        INSTRUCTIONS  ENG Fonctions principales : Signaux d'entrée précis SANS RENDU ! Si un signal apparaît, il reste d’actualité ! Il s'agit d'une différence importante par rapport aux indicateurs de redessinage, qui peuvent fournir un signal puis le modifier, ce qui peut entraîner une perte de fonds en dépôt. Vous pouvez désormais entrer sur le marché avec plus de probabilité et de précision. Il existe également une fonction de coloration
Plus de l'auteur
"Cet indicateur détecte les entrées basées sur la théorie du motif Bystra et fournit les valeurs d'entrée pour placer des ordres limités avec des niveaux cibles et des niveaux de stop. Cela vous permet de calculer votre pourcentage de risque. Notes : Cet indicateur dispose de tampons qui permettent son utilisation dans les Expert Advisors (EAs). Il est important de pratiquer une bonne gestion de l'argent en travaillant avec ce produit. Lorsque vous changez votre cadre temporel, L'indicateur sauv
Indicateur technique pour détecter de forts schémas d'action sur les prix : Pin Bar, Inside Bar et Outside Bar Introduction : Dans le domaine de l'analyse technique, les schémas d'action sur les prix servent d'indicateurs essentiels des mouvements potentiels du marché. Nous avons développé un indicateur technique sophistiqué qui simplifie l'identification de solides schémas d'action sur les prix sur les graphiques. Notre indicateur est spécialisé dans la détection de trois schémas essentiels : l
ON Trade Pivoteer
Abdullah Alrai
4 (1)
Introducing the Pivot Point Selector Indicator: Your Ultimate Tool for Custom Pivot Levels Are you ready to take your trading to the next level? Say hello to the Pivot Point Selector Indicator, a game-changing tool that puts you in control of your pivot levels. This innovative indicator empowers you to choose three specific points that will determine the pivot level calculations, giving you unparalleled customization and precision in your trading strategy. Key Features and Benefits: Custom Pivo
FREE
ON Trade Pivots is A technical indicator that Draws all Pivot levels depending on time frame that defined in settings. Notes It will be good tool for all traders who use pivot levels in their trades. Let me inform you that this indicator draw this level as buffers not as objects then you can connect it easily to EA. This indicator allow you to find pivots levels for any time frame not only daily you are free to choose time frame from settings. Parameters Use_System_Visuals - Enable /Disable Sy
FREE
Présentation de l'indicateur Calculateur de Prix du Gramme d'Or Vous souhaitez être constamment informé du prix de l'or dans votre devise locale ? Ne cherchez plus, l'indicateur Calculateur de Prix du Gramme d'Or vous offre un outil novateur qui vous permet de calculer en temps réel le prix par gramme d'or dans votre devise locale préférée. Avec cet indicateur, vous pouvez exploiter les informations financières pour prendre des décisions éclairées. Caractéristiques Principales : Prix Localisé de
FREE
Cet indicateur a pour but de représenter visuellement le canal Donchian sur votre graphique de trading. Le canal Donchian est un outil technique simple utilisé pour représenter la plage entre le plus haut et le plus bas sur une période spécifiée. Cet indicateur améliore l'analyse visuelle des mouvements de prix en offrant des indications sur les points potentiels de rupture et de continuation de tendance. Le canal Donchian peut être appliqué aussi bien sur l'unité de temps actuelle que sur une u
FREE
"Cet indicateur est un outil simple de détection de tendance. Vous pouvez l'utiliser avec votre stratégie pour obtenir de bonnes entrées, comme en mode scalping. Il dessinera un canal autour du prix, qui s'étendra à mesure que le temps augmente. Pendant les périodes personnalisées, il reviendra au point de départ de l'expansion en fonction d'un algorithme qui prend en compte le temps et le prix ensemble. Vous pouvez acheter à la limite inférieure du canal après l'apparition de signes de retourne
Cet indicateur fonctionne en conjonction avec la théorie des vagues d'Elliott de deux manières : Mode automatique : Dans ce mode, l'indicateur détectera automatiquement les cinq vagues motrices sur le graphique conformément à la théorie des vagues d'Elliott. Il fournira des prédictions et identifiera les zones potentielles de retournement. De plus, il a la capacité de générer des alertes et des messages push pour informer les traders des développements importants. Cette fonctionnalité automatiqu
Cet indicateur propose une méthode robuste d'analyse de marché centrée autour du concept de "l'outil de canal de régression". En utilisant cet outil, les traders peuvent obtenir un contrôle exceptionnel sur le canal de régression de leur graphique, ce qui leur permet de prendre des décisions de trading plus éclairées. L'outil de canal de régression est un instrument puissant dans la boîte à outils d'un trader. Il est conçu pour fournir des informations précieuses sur les tendances des prix et le
"Nous vous présentons notre puissant indicateur Forex conçu pour améliorer votre stratégie de trading et vous fournir des informations précises sur les tendances du marché. Cet outil innovant utilise un algorithme personnalisé sophistiqué qui analyse minutieusement les mesures des bougies, en effectuant des ajustements pour obtenir une précision optimale. Le résultat ? Un ensemble de flèches précisément tracées sur votre graphique, indiquant des points d'entrée stratégiques. La génialité derrièr
Cet indicateur a été conçu pour détecter et visualiser les vagues diamant de Gann, un modèle spécifique dérivé de la théorie de Gann. Il offre aux traders des informations sur les potentielles inverses de marché en traçant des points (P) basés sur les points ABC du modèle. De plus, l'indicateur trace des lignes verticales à partir des points prédits (P) pour aider les traders à identifier plus facilement les points potentiels d'inversion. Fonctionnalités de l'indicateur : Use_System_Visuals : Ce
L'indicateur "Fibo Star" a été conçu pour tracer les éventails de Fibonacci sous forme d'étoiles sur votre graphique. Ces éventails de Fibonacci sont un outil puissant pour analyser les mouvements de prix et peuvent fournir des aperçus des niveaux potentiels de support et de résistance. Cet indicateur est équipé d'un panneau de contrôle convivial qui vise à simplifier le processus de dessin et de configuration des éventails, permettant ainsi d'économiser du temps et des efforts. Mode d'emploi :
L'indicateur de "Force des Devises" est un outil puissant conçu pour fournir aux traders des informations sur la force relative de différentes devises sur le marché des changes. En calculant et en représentant la force de chaque devise en fonction de son intervalle de temps spécifié, cet indicateur offre aux traders la possibilité d'identifier des opportunités de trading potentielles, notamment lorsque des divergences significatives ou des croisements sont observés. Principales caractéristiques
L'indicateur de Carré Gann est un puissant outil d'analyse du marché basé sur l'article "Formule Mathématique pour les Prédictions de Marché" écrit par W.D. Gann. Cet outil utilise des concepts mathématiques et des théories de Gann pour réaliser une analyse précise du marché. Il utilise les carrés de 144, 90, 52 et aussi le carré de 9. De plus, il intègre la méthode du  pour le carré de 9 et sa relation avec les canaux et le modèle en étoile de ce carré. Manuel d'Utilisateur et Application : Ava
L'indicateur de motif de chandelier japonais Hikkake est un outil spécialisé conçu pour identifier et détecter les motifs d'action des prix Hikkake qui se forment sur un graphique. Ces motifs sont basés sur le concept d'une fausse rupture à partir d'une barre intérieure, ce qui conduit souvent à des opportunités de trading potentielles. La principale fonction de l'indicateur est d'analyser les cinq dernières bougies sur le graphique et de déterminer si elles présentent les caractéristiques du mo
Indicateur de Support et Résistance Basé sur la Numérologie pour MetaTrader Introduction : Découvrez une nouvelle dimension dans l'analyse technique avec notre Indicateur de Support et Résistance Basé sur la Numérologie pour MetaTrader. Cet outil unique exploite la puissance de la numérologie pour identifier des niveaux clés de support et de résistance sur vos graphiques, vous offrant des informations précieuses sur les mouvements potentiels des prix. Concepts Clés : La Numérologie dans le Tradi
Découvrez une approche révolutionnaire du trading avec l'indicateur Shepherd Numerology Levels. Cet outil innovant combine la sagesse ancienne de la numérologie avec les techniques de trading modernes pour vous aider à identifier des niveaux de support et de résistance clés sur vos graphiques. En utilisant la méthode du carré de neuf, cet indicateur offre une perspective unique sur les mécanismes du marché et vous permet de prendre des décisions de trading plus éclairées. Principales caractérist
Présentation de l'indicateur ON Trade Numerology Mirror : Découvrez les motifs inverses cachés grâce à la numérologie Explorez une nouvelle dimension dans l'analyse technique avec l'indicateur ON Trade Numerology Mirror. Cet outil innovant exploite la sagesse ancienne de la numérologie pour identifier des niveaux clés de retournement dans vos graphiques. En reconfigurant les chiffres dans des positions inversées, cet indicateur révèle des motifs cachés qui ont le potentiel d'indiquer des retourn
Présentation de l'indicateur astronomique pour MT4 : Votre compagnon de trading céleste ultime Êtes-vous prêt à élever votre expérience de trading à des hauteurs célestes ? Ne cherchez pas plus loin que notre indicateur astronomique révolutionnaire pour MT4. Cet outil innovant transcende les indicateurs de trading traditionnels en exploitant des algorithmes complexes pour vous fournir des aperçus astronomiques inégalés et des calculs de précision. Un univers d'informations à portée de main : Con
Introducing the ON Trade Melad Pattern Indicator: Enhance Your Trading Strategy with Breakout Patterns Discover the power of the ON Trade Melad Pattern Indicator—an intuitive tool designed to elevate your trading decisions by detecting and highlighting breakout patterns on your charts. This indicator is your key to identifying crucial breakout points and potential trend shifts with simplicity and precision. Key Features: Breakout Pattern Detection: The ON Trade Melad Pattern Indicator focuse
This indicator will give you entries as result of scalping strategy that will be applied on 14 symbols in same time and you are able to be notified with this entries  Note :   This indicator for scalping on 5 minutes timeframe only . How to use it : 1-Open chart and adjust settings (edit symbols names as your platform names , activate the alert system if you need it . 2-Wait for any signal you have it from this scanner you will have it as alert and as notification and you will see it on board
This indicator gives you the signal of real cross on stochastic indicator. This indicator is easy to attach to an ea. This indicator will work best on All time frames. Arrow appears depending on many algorithms that study the cross parameters. Indicator properties Use_System_Visuals: enable/disable visual styles. Stochastic_K_Period. Stochastic_D_Period. Stochastic_Slowing. Use_Notifications: enable/disable Push Notifications. Use_Alert: enable/disable Alerts. Use_E_Mail: enable/disable Email n
Présentation de "ON Trade VSA" - Votre outil ultime d'analyse de volume et de répartition ! Découvrez la puissance de l'Analyse de Volume et de Répartition (VSA) avec notre indicateur de pointe - "ON Trade VSA". Le VSA est une méthodologie puissante utilisée par les traders pour évaluer la force du marché, identifier les tendances et prendre des décisions éclairées. Explorons les fonctionnalités clés qui font de "ON Trade VSA" un outil indispensable pour votre arsenal de trading : Bougies de Vol
Nous vous présentons ON Trade Waves Patterns Harmonic Elliot Wolfe, un indicateur avancé conçu pour détecter divers types de schémas sur le marché à l'aide de méthodes manuelles et automatiques. Voici comment il fonctionne : Schémas Harmoniques : Cet indicateur peut identifier les schémas harmoniques qui apparaissent sur votre graphique. Ces schémas sont essentiels pour les traders qui pratiquent la théorie du trading harmonique, telle qu'elle est décrite dans le livre de Scott Carney "Harmonic
This product is a part of  ON Trade Waves Patterns Harmonic Elliot Wolfe you can test free version on EURJPY from this link  Wolf Waves Indicator Découvrez les Vagues de Loup - Votre Outil de Trading Ultime ! Êtes-vous à la recherche d'un outil puissant pour repérer facilement les Vagues de Loup sur n'importe quel intervalle de temps ? Ne cherchez plus ! Notre indicateur de Vagues de Loup fait le travail sans effort. Voici pourquoi il est parfait pour vous : Caractéristiques principales : Déte
This program serves as an effective tool for sending messages through a Telegram bot using the MetaTrader platform. It enables you to send your trading recommendations related to the orders you open on the trading platform directly to your Telegram channel or group. These messages may include details about open trades and can be accompanied by illustrative images of the orders. Alternatively, they can be configured to be without images based on your preferences. This means that if you are the ow
Présentation de notre nouvel indicateur : [ON Trade Breakout Zone] Outil d'analyse de marché simple mais puissant pour tous les traders ! Convient aussi bien aux professionnels qu'aux traders débutants Êtes-vous prêt à dynamiser votre stratégie de trading ? Notre dernier indicateur est conçu pour simplifier l'analyse du marché et donner du pouvoir aux traders de tous niveaux. Que vous soyez un professionnel chevronné ou que vous débutiez tout juste, [ON Trade Breakout Zone] est la clé p
User Manual Download link: https://ontrd.com/our-books/ For all who are asking about indicator  ON Trade Numerology Station It obtain about 16 numerology strategies it make together completed unit control your trading . Basic strategies to work with it are 3 strategies statistics about them are the following : 1. RBA levels success rate more then 95%. 2. FF more then 96%  3.RBA SUN 98% We will not say 100 % as they are .. Ratio rates as following :  1.Rba levels more then 1/3 to 1/6 . 2.FF MORE
Ce produit vous permettra de contrôler vos commandes et votre compte avec de nombreuses fonctions 1- il calculera la taille correcte du lot en fonction de la taille de votre compte/taille SL/valeur en points de paire pour 1 taille de lot. 2- il vous donnera la situation actuelle des commandes en fonction des emplacements des lignes (cible sl tp). 3- il déplacera toutes les commandes cible/sl en appuyant sur 1 bouton. 4- il vous donnera des informations sur votre compte et la marge nécessair
ON Trend
Abdullah Alrai
5 (1)
Maîtrisez la puissance du trading de tendance Cet indicateur est conçu pour les traders débutants, intermédiaires et professionnels. Il simplifie le processus de trading en détectant avec précision la tendance réelle sur n'importe quelle paire de devises. Pourquoi choisir cet indicateur ? - Trading simplifié : Plus besoin d'analyses complexes. Chargez l'indicateur sur le graphique, attendez les signaux d'achat ou de vente, et vous n'avez plus besoin de surveiller le graphique toute la journé
Filtrer:
Aucun avis
Répondre à l'avis