Transaction Speed MT4

Voici la traduction en français, sans aucun commentaire supplémentaire :

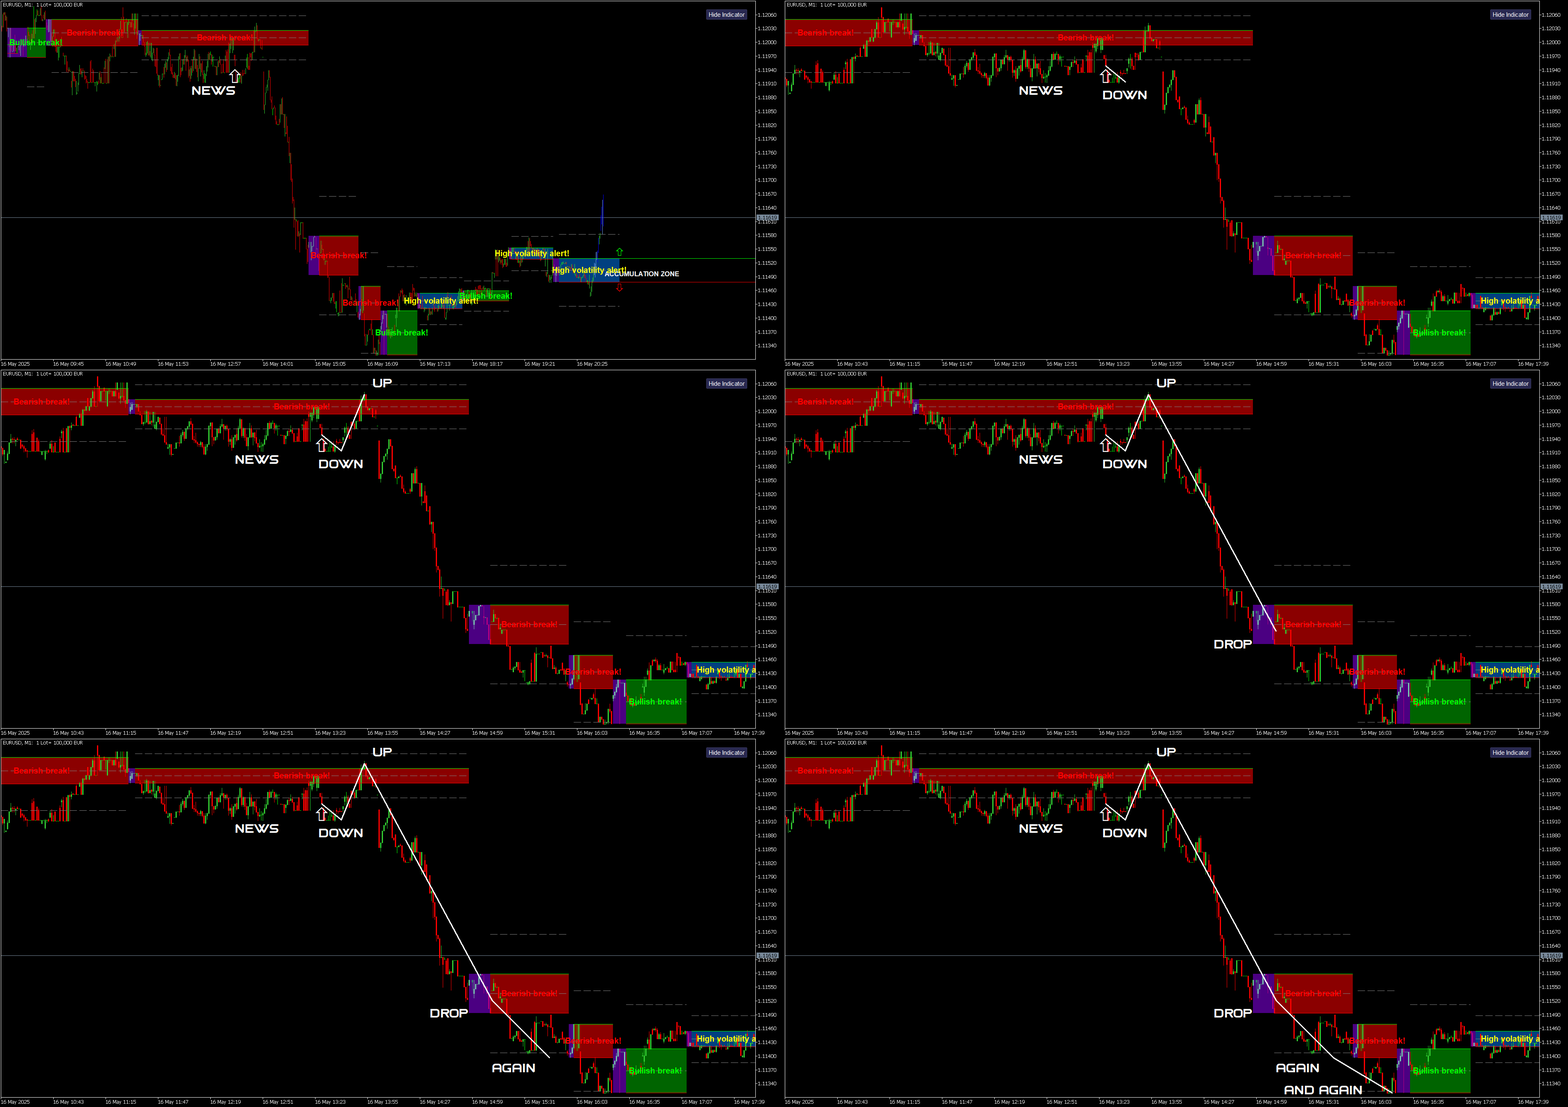
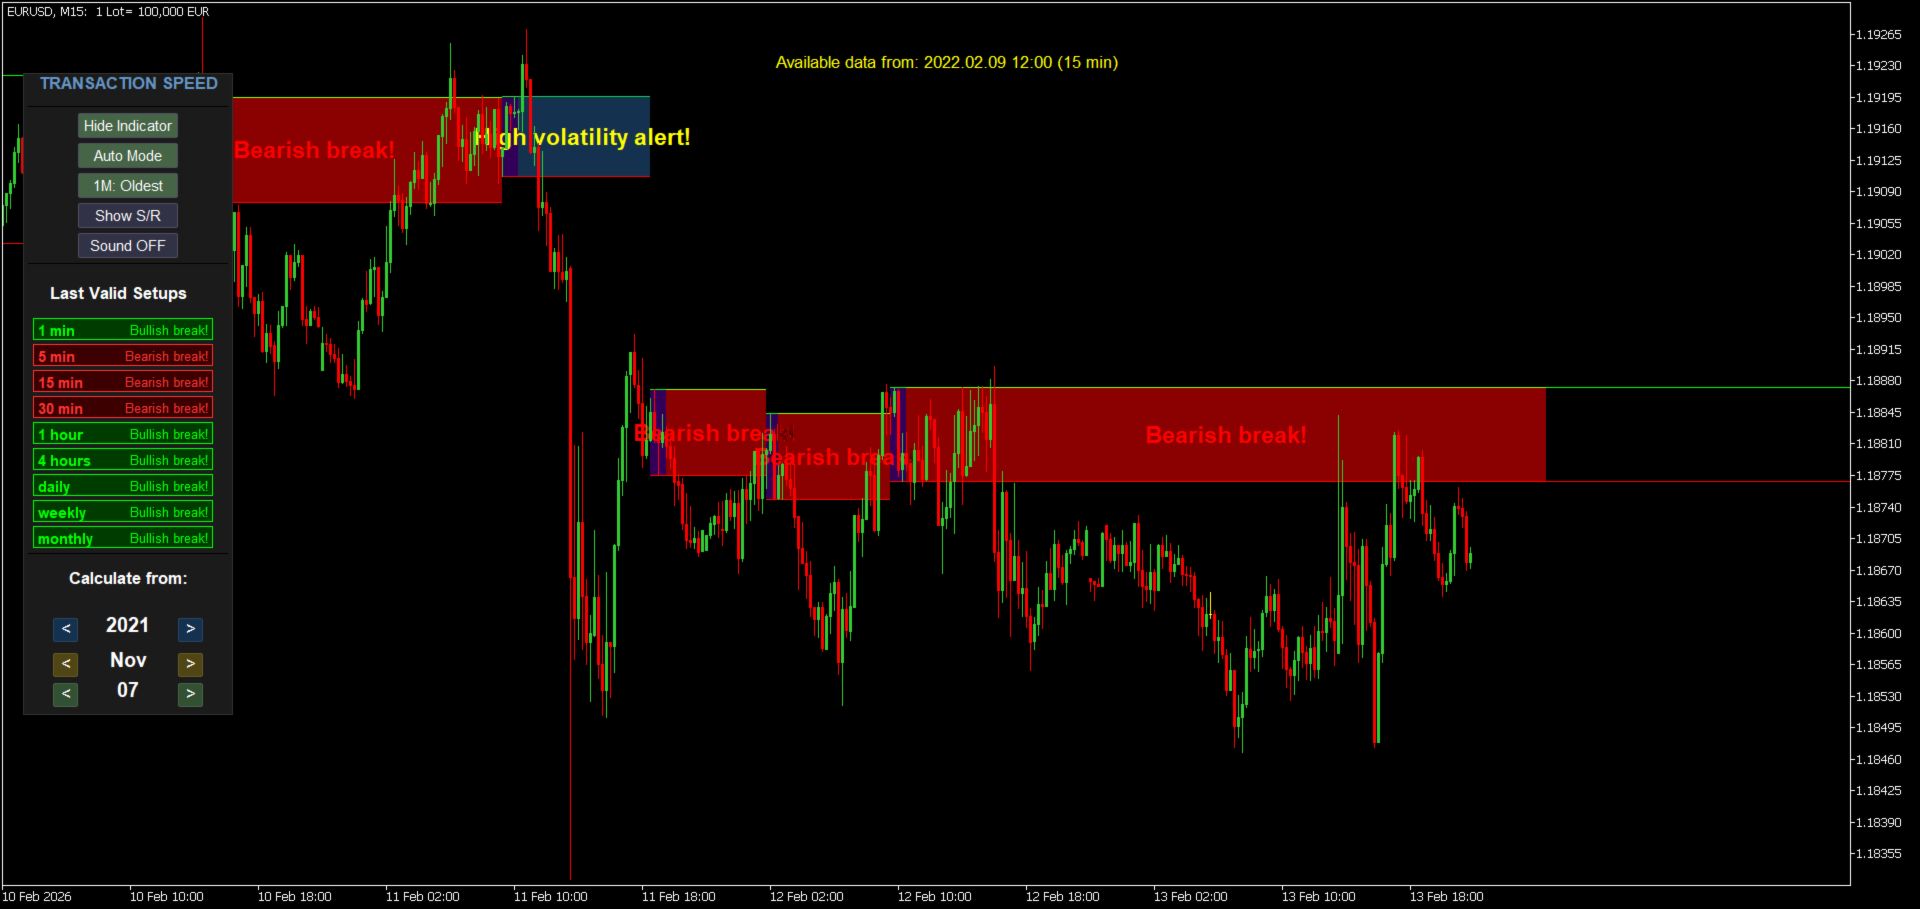
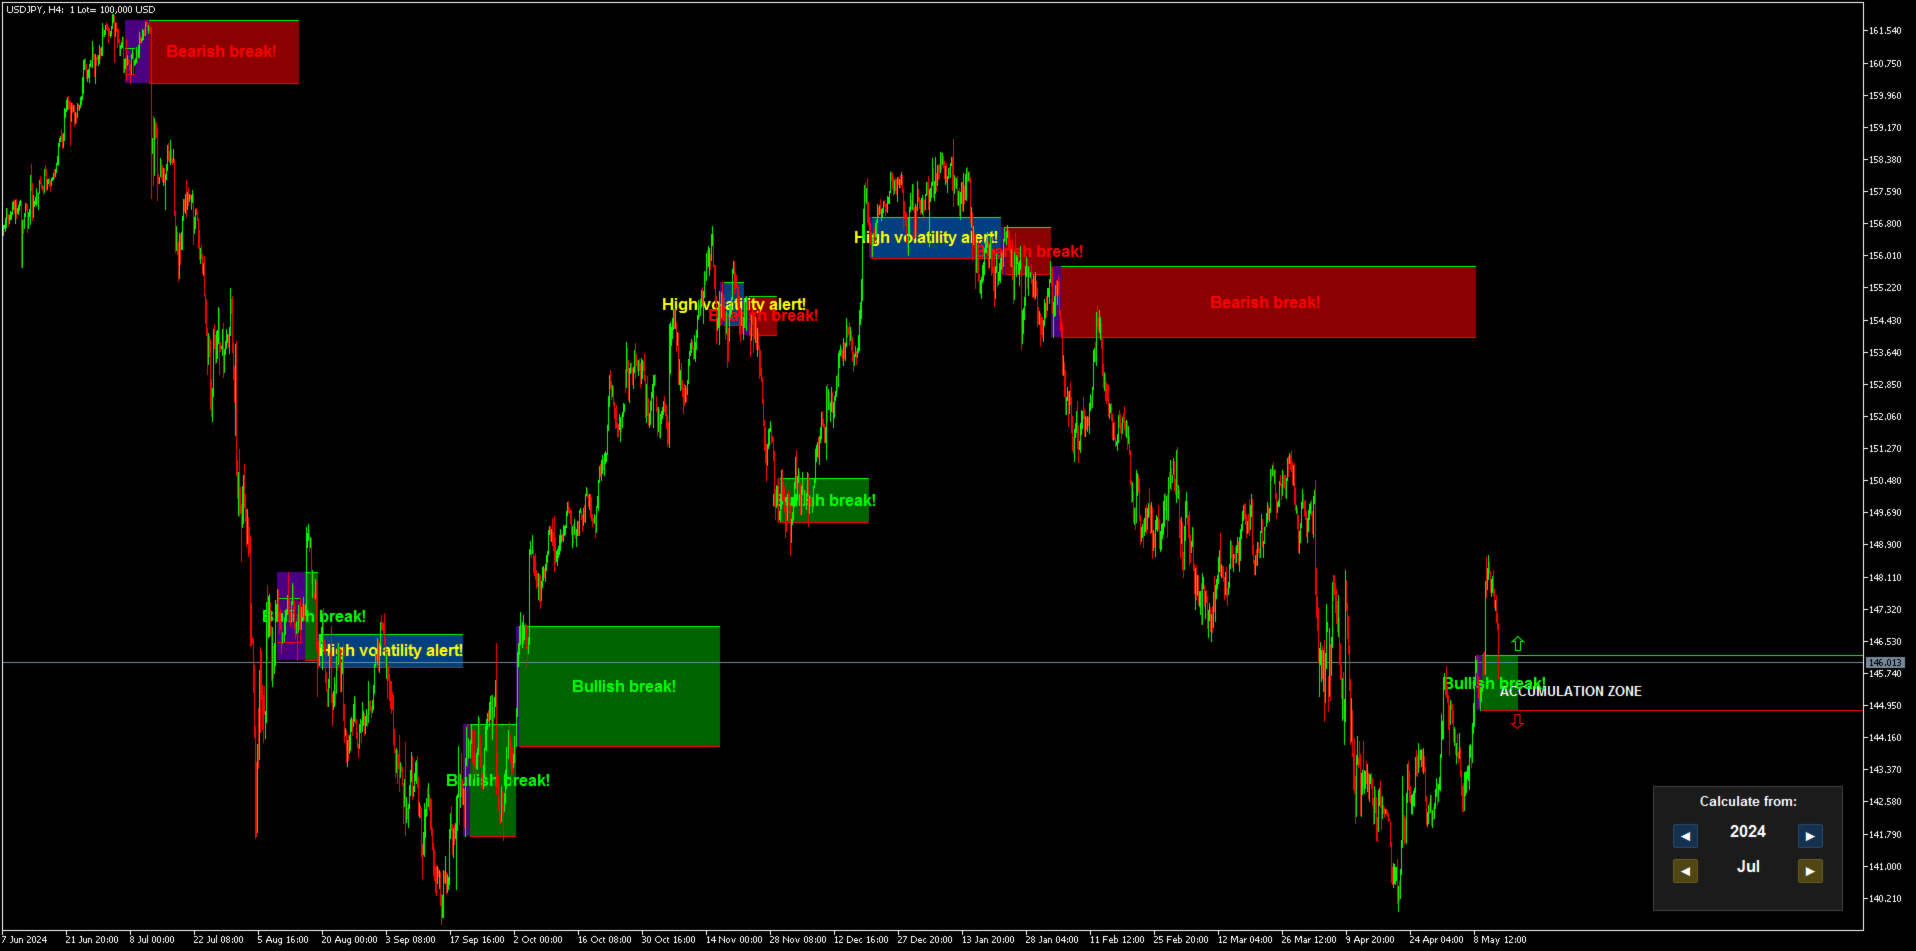
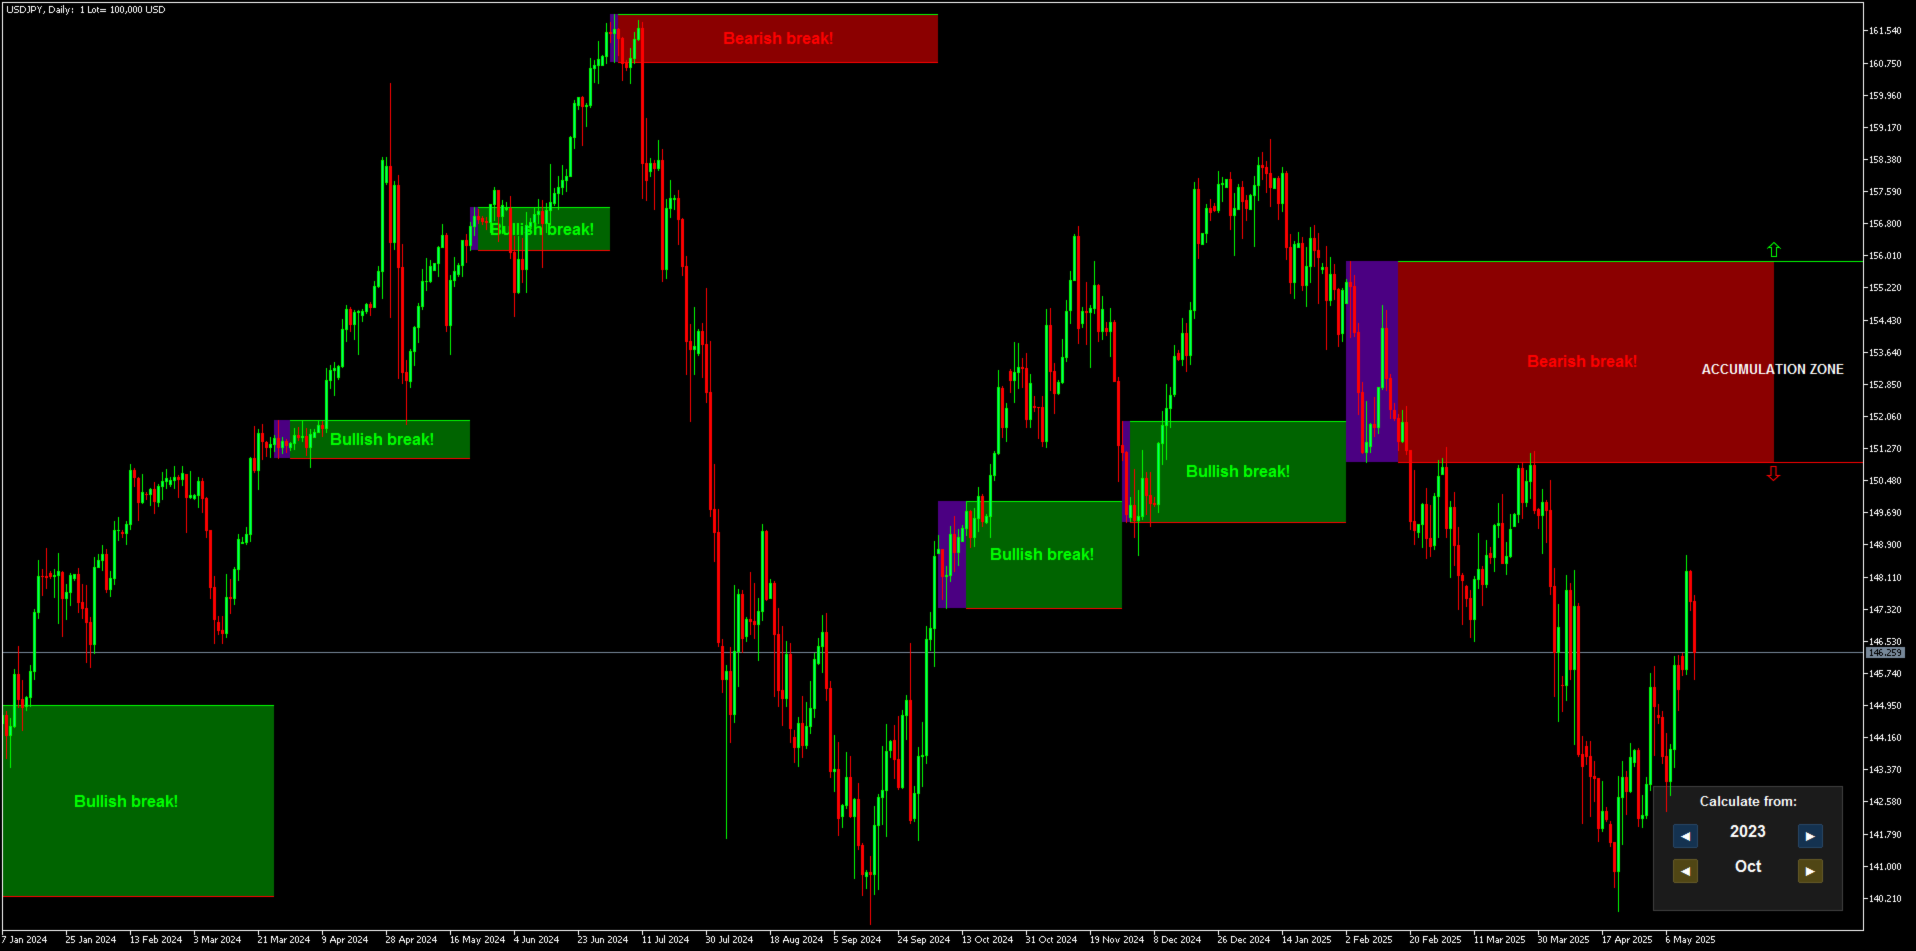
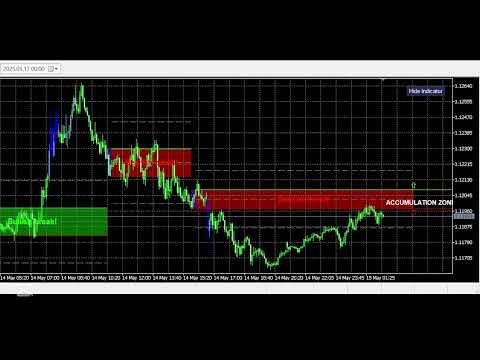
L’indicateur met en évidence les zones un intérêt est déclaré, puis montre la zone d’accumulation des ordres.

Transaction Speed fonctionne comme un carnet d’ordres à grande échelle.

C’est l’indicateur destiné aux capitaux les plus importants. Ses performances sont exceptionnelles. Quel que soit l’intérêt présent sur le marché, vous le verrez.

Transaction Speed est un indicateur conceptuellement nouveau qui montre et quand de gros ordres s’accumulent sur le marché, et permet d’en tirer avantage. Il détecte les changements de tendance à un stade très précoce. Sur le Forex, le volume est appelé volume de manière trompeuse. En réalité, il s’agit de la variation du prix par unité de temps, d’où le nom correct : vitesse de transaction. Tout dépend de notre manière de penser, d’agir et d’analyser. Le changement de paradigme est d’une importance capitale. Cet indicateur revoit complètement l’idée du volume sur le Forex, en le définissant logiquement de la bonne manière, et l’application de cette logique en fait un outil unique et précis.

Comment l’utiliser :

Par défaut, l’indicateur est réglé en mode automatique, ce qui permet de l’utiliser indépendamment sur n’importe quelle unité de temps. Si vous souhaitez passer en mode manuel, cliquez simplement sur le bouton auto / manuel.

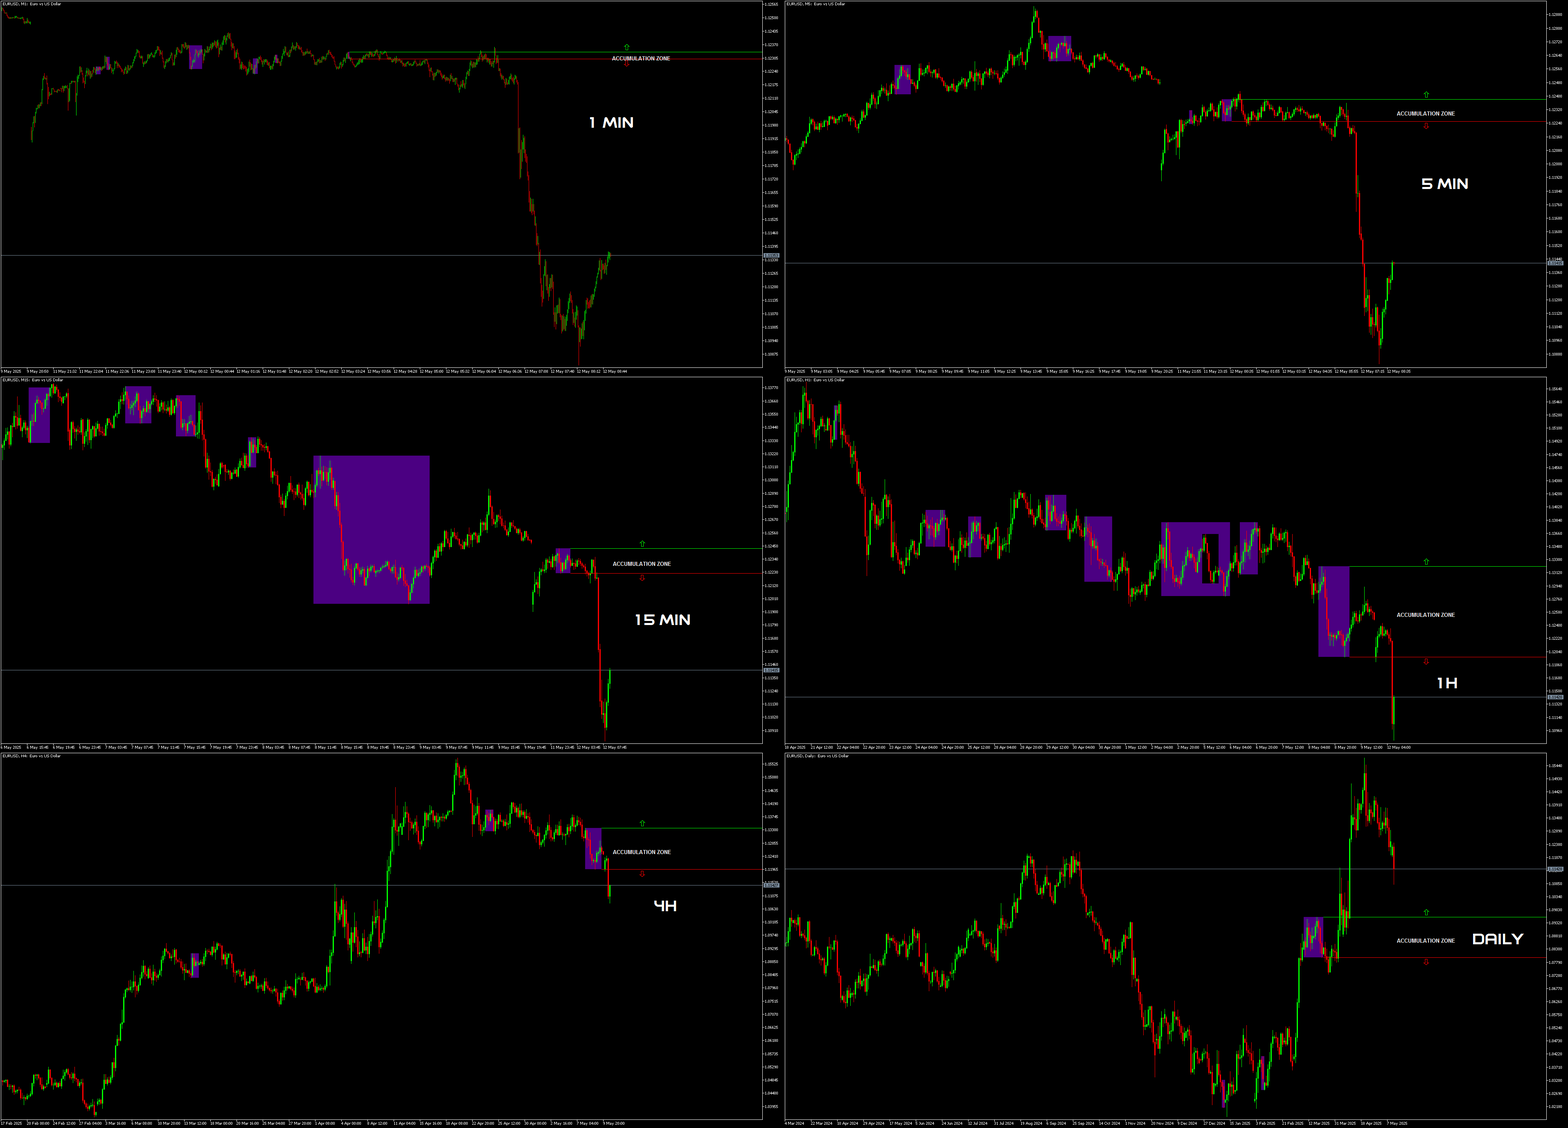
En mode manuel, tous les calculs commencent au 1er janvier 2025. Vous pouvez modifier cette date pour obtenir différents résultats. La période de données optimale pour l’indicateur est de quatre à six mois. Ainsi, vous capturez des données provenant de plusieurs cycles, garantissant une base solide pour vos résultats. Plus la période est grande, moins il y a de zones.

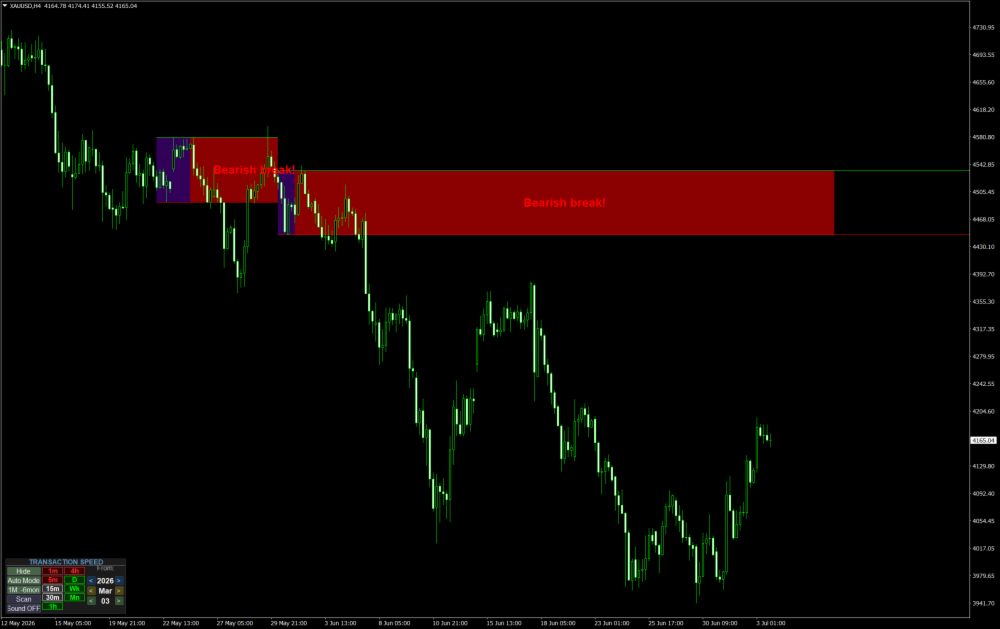
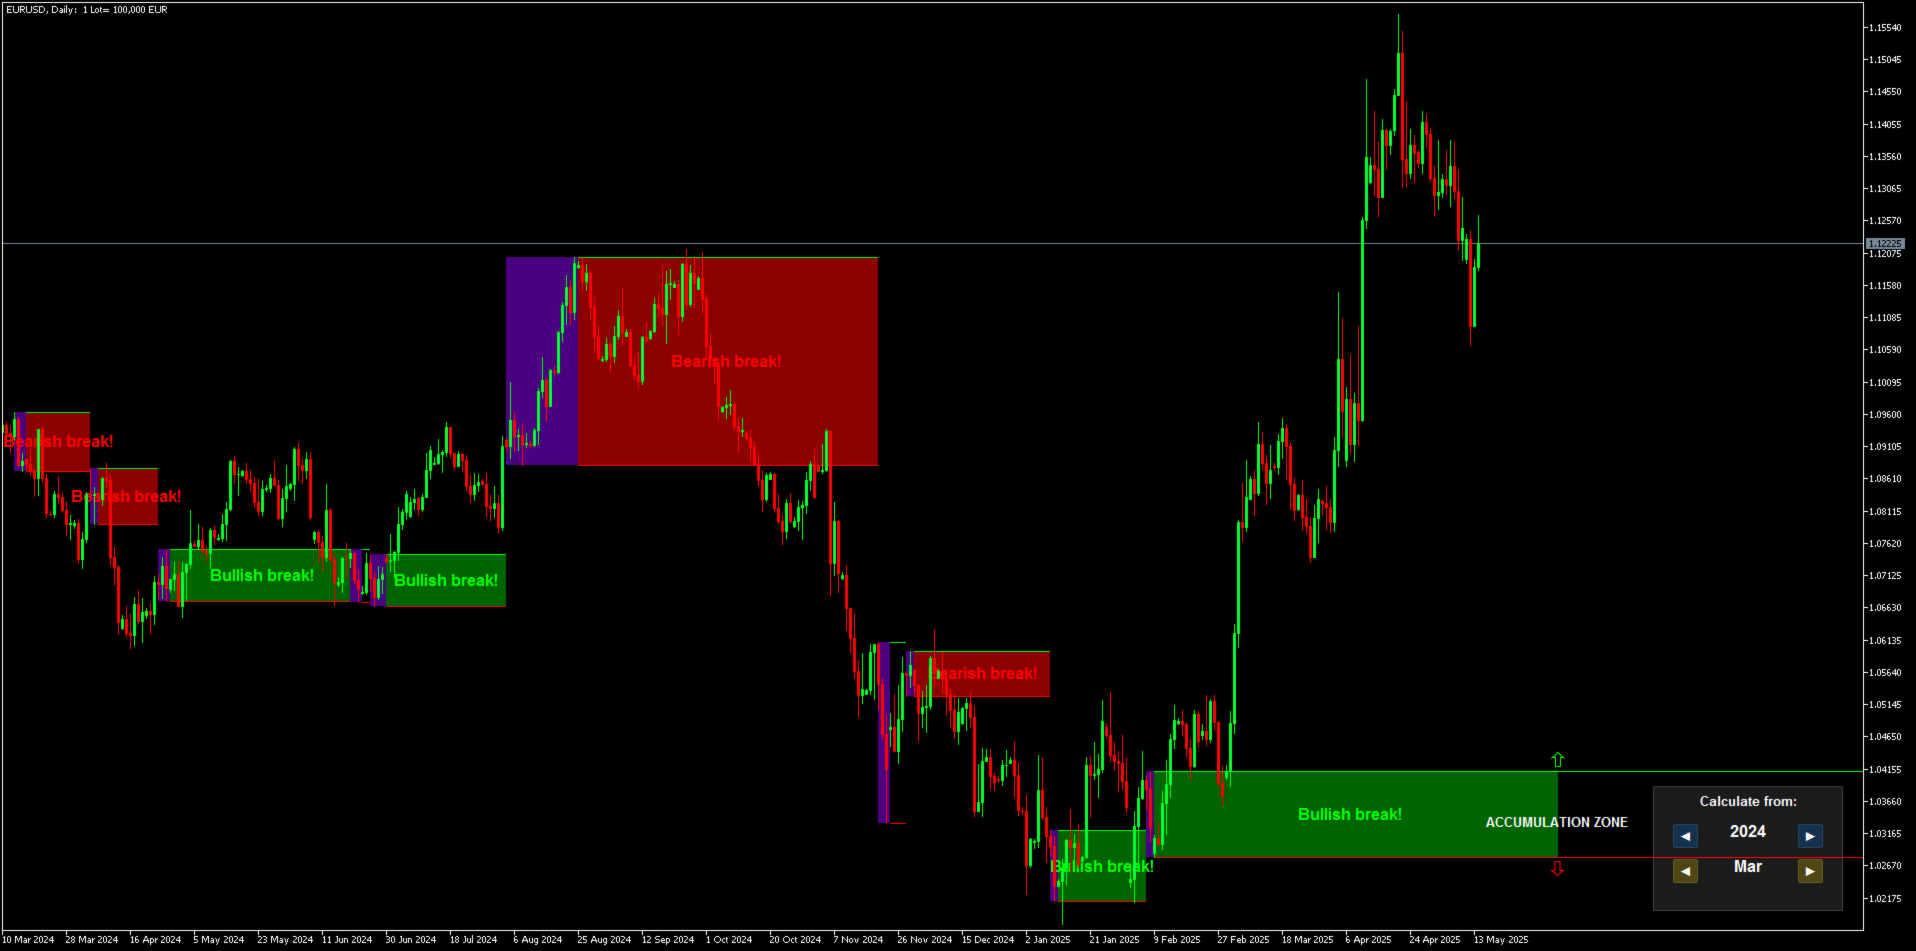
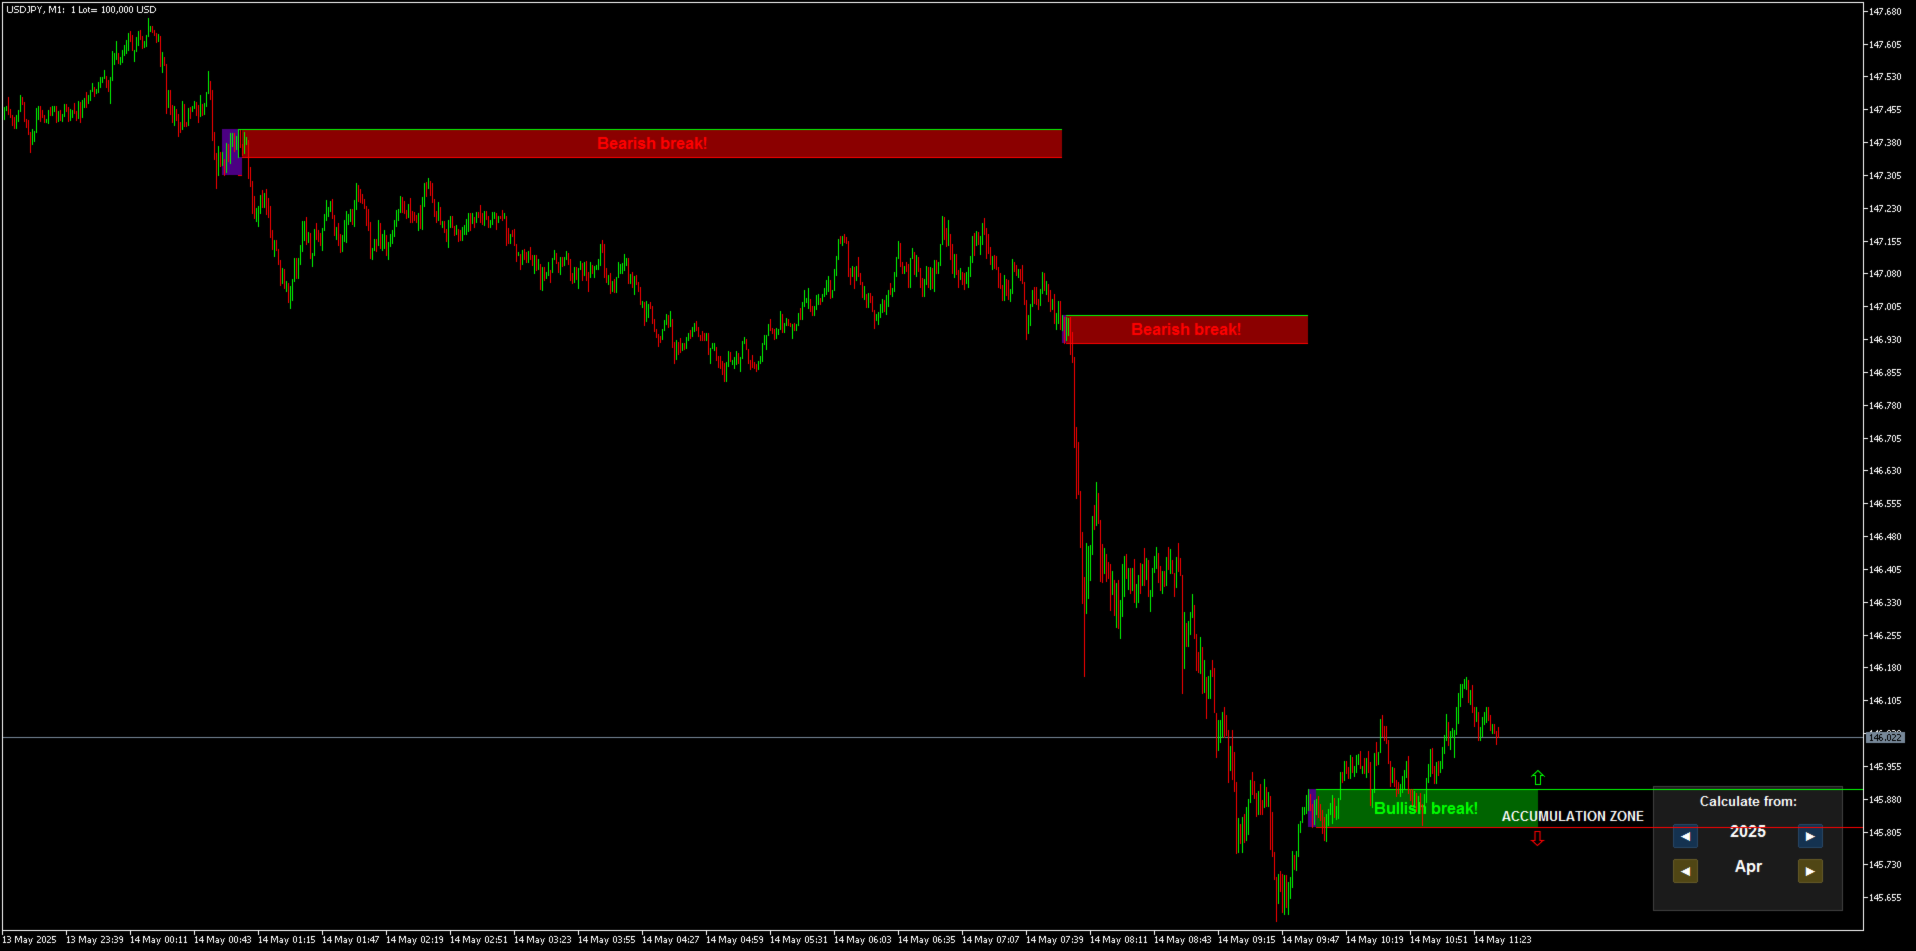
La zone le marché montre un DECLARED INTEREST est mise en évidence par un rectangle violet. Ensuite apparaît la ZONE D’ACCUMULATION DES ORDRES.

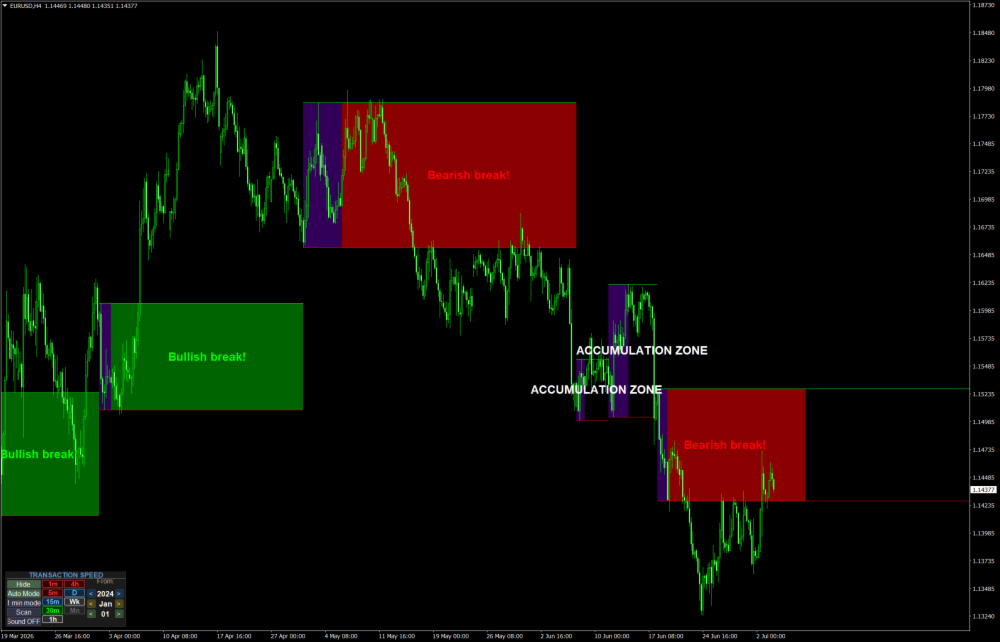
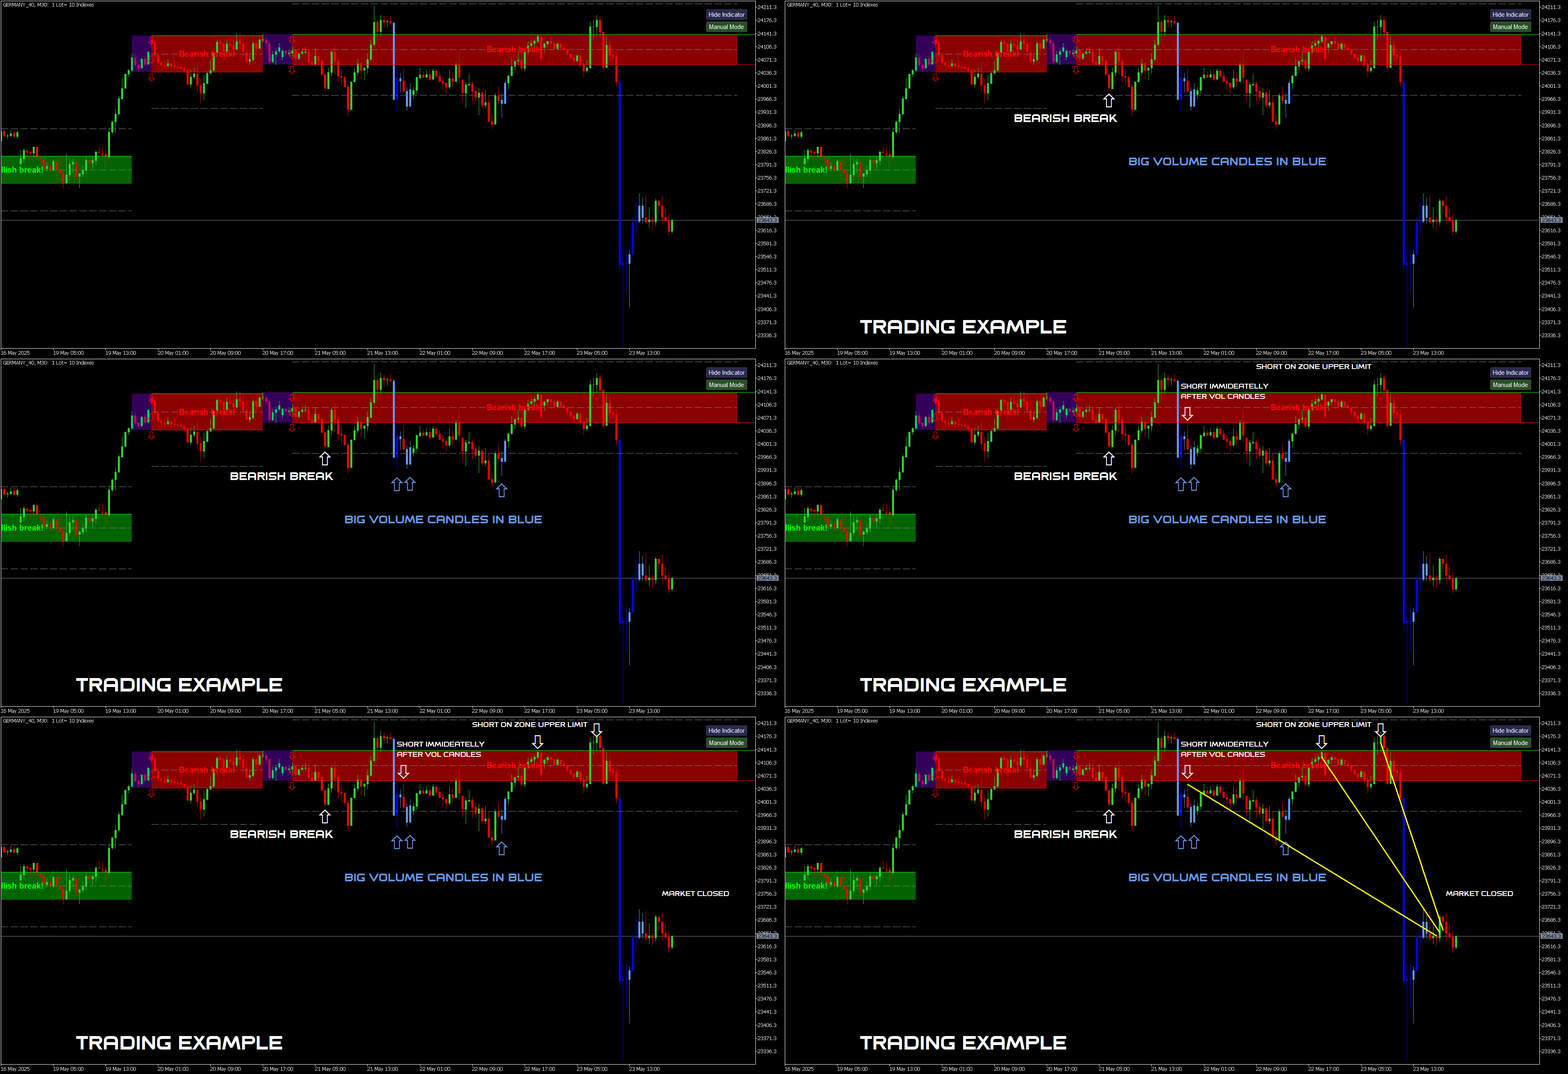
Si le marché casse cette zone par le haut, la tendance devient haussière et la zone d’accumulation devient verte ; s’il la casse par le bas, la tendance devient baissière et la zone devient rouge.

Une bougie qui clôture entièrement en dehors de la zone sans toucher sa bordure est considérée comme une véritable cassure.

Lorsqu’une bougie se forme entièrement en dehors d’une zone d’accumulation d’ordres, cela signale une cassure et indique la direction du marché. Cela définit la tendance. La tendance reste valide jusqu’à ce qu’une cassure dans la direction opposée se produise ou qu’une nouvelle zone d’intérêt apparaisse sur le marché.

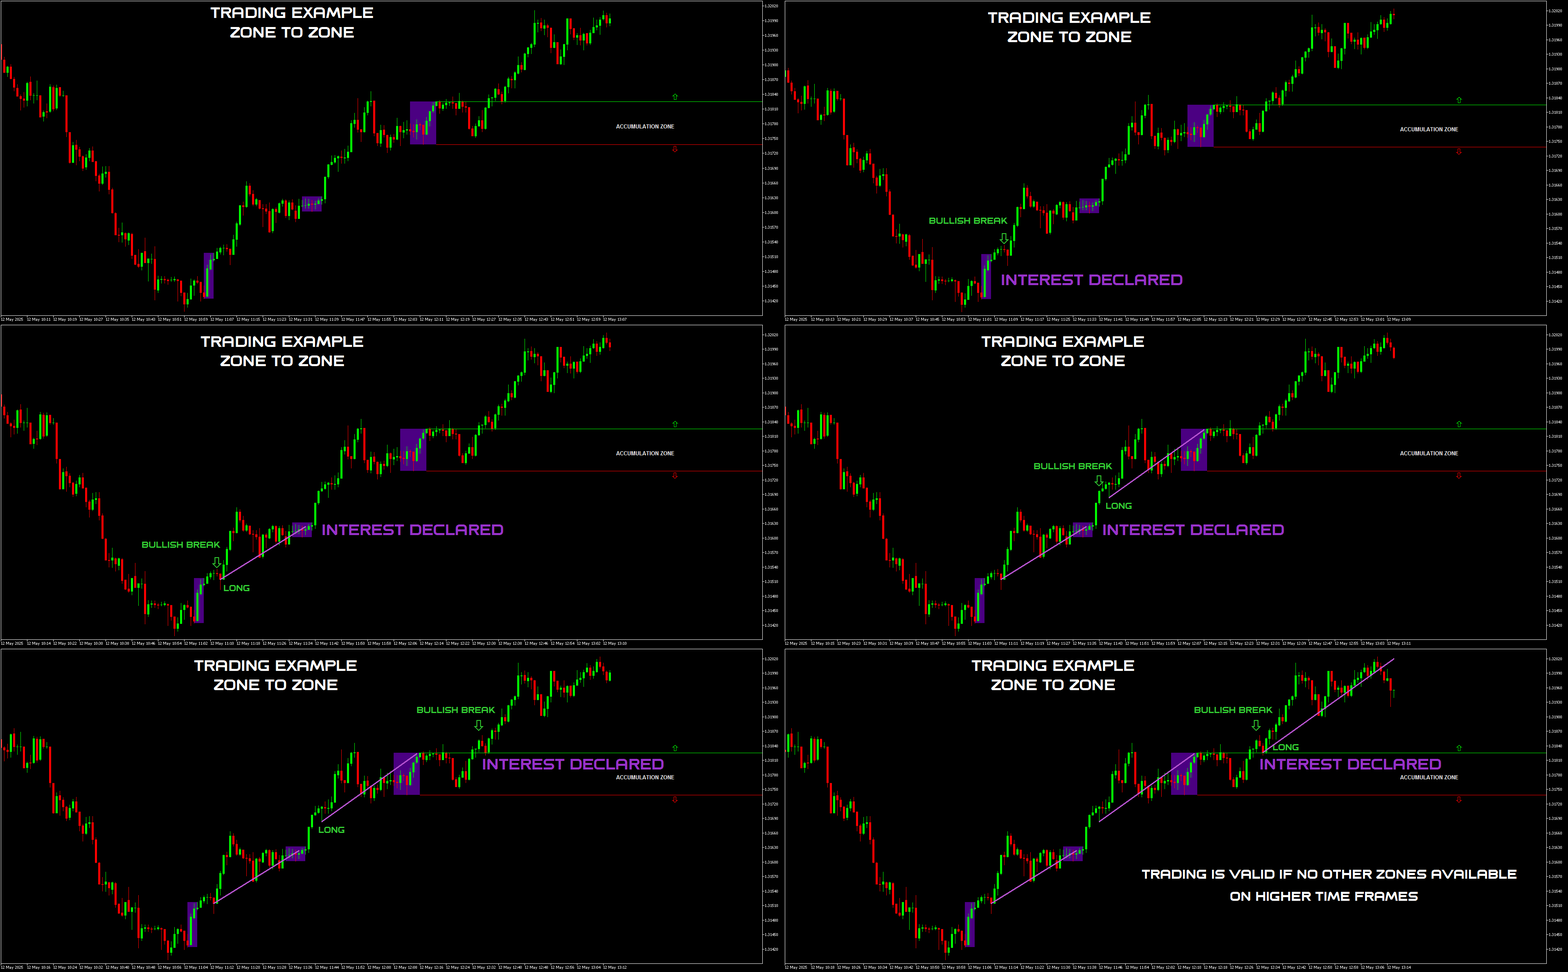
Vous pouvez trader « de zone à zone ».

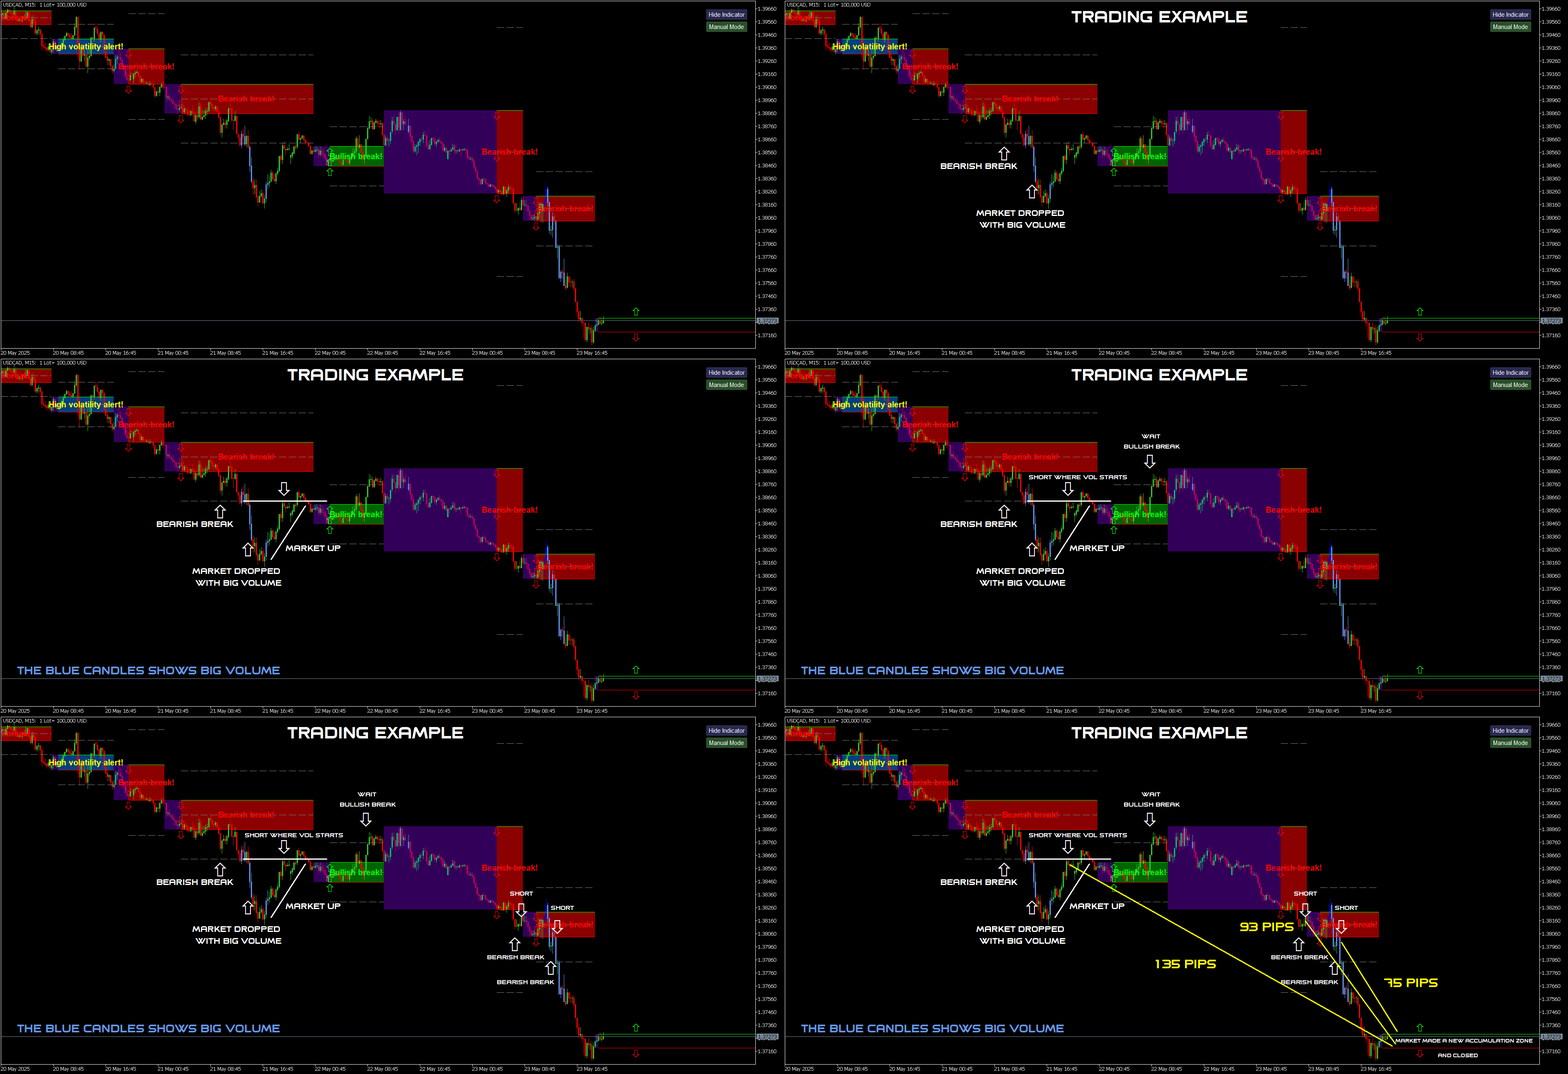
Exemple 1 : Lorsqu’il y a une cassure de la zone d’accumulation, ouvrez des ordres dans la direction du marché.

Exemple 2 : Sur le graphique H4, une cassure haussière se produit et le marché monte. Après un certain temps, une zone H1 apparaît. Vous pouvez fermer votre position et attendre que la zone H1 vous donne une nouvelle direction.

Exemple 3 : Si vous êtes à l’intérieur d’une zone, vous pouvez vendre depuis le haut ou acheter depuis le bas jusqu’à la cassure de la zone. C’est un trading en range, mais plus risqué. Ne tradez jamais contre l’indicateur. Jamais.

Si une zone est cassée des deux côtés, vous recevez un signal High Volatility Alert.

Ce sont les traces de l’argent. Et tout cela ne peut pas être vu à l’œil nu, car nous avons le volume en ticks, qui est la plus grande illusion. C’est pour cela que sert cet indicateur de vitesse de transaction, qui convertit le volume en ticks en activité de marché. C’est un outil très sérieux conçu pour des besoins d’analyse avancée.

Les zones sont créées sur chaque unité de temps. La zone valide est la dernière dans laquelle le marché se trouve actuellement. Pour qu’une zone soit considérée valide, elle ne doit se superposer à aucune autre zone.

Recommandations :

Paires de devises : uniquement les instruments avec un grand volume de ticks EUR/USD, USD/JPY, GBP/USD, etc. Unités de temps : toutes. Dépôt minimum : aucun. Type de compte : aucune limitation. Courtiers : aucune limitation. Les grands courtiers sont préférables en raison du volume plus élevé.

Science pure.

Support complet, aide à l’installation et matériel bonus disponibles après l’achat.

Avant d’acheter : Ce produit peut être testé directement dans le MetaTrader Strategy Tester. Je recommande fortement d’examiner son comportement avec vos instruments, unités de temps et conditions de marché avant de prendre une décision d’achat.

Des questions ou besoin de précisions ? Si vous souhaitez vérifier l’indicateur en trading réel, envoyez‑moi un message. Je suis disponible pour vous aider et vous fournir des explications claires afin que vous compreniez pleinement ce que le produit offre.
Produits recommandés
Alpha Trend sign est notre outil de Trading très populaire depuis longtemps, il valide notre système de Trading et invite clairement les signaux de Trading sans dérive. Fonctions principales: • En fonction de la zone active du marché, selon les indicateurs, il est intuitif de déterminer si le cours actuel appartient à la tendance ou à la tendance. Et coupez le marché selon les flèches d'indication de l'indicateur, les flèches vertes suggèrent d'acheter et les flèches rouges suggèrent de vend
VR Cub
Vladimir Pastushak
VR Cub est un indicateur permettant d'obtenir des points d'entrée de haute qualité. L'indicateur a été développé pour faciliter les calculs mathématiques et simplifier la recherche de points d'entrée dans un poste. La stratégie de trading pour laquelle l'indicateur a été rédigé prouve son efficacité depuis de nombreuses années. La simplicité de la stratégie de trading est son grand avantage, qui permet même aux traders débutants de négocier avec succès avec elle. VR Cub calcule les points d'ouve
PZ Harmonacci Patterns
PZ TRADING SLU
3.17 (6)
Trade smarter, not harder: Empower your trading with Harmonacci Patterns This is arguably the most complete harmonic price formation auto-recognition indicator you can find for the MetaTrader Platform. It detects 19 different patterns, takes fibonacci projections as seriously as you do, displays the Potential Reversal Zone (PRZ) and finds suitable stop-loss and take-profit levels. [ Installation Guide | Update Guide | Troubleshooting | FAQ | All Products  ] It detects 19 different harmonic pric
Gartley Projection D
Oleksandr Medviediev
3.71 (7)
The indicator identifies the harmonic patterns (XABCD) according to developments of H.M.Gartley ( "Profits in the Stock Market" , 1935г). It projects D-point as a point in the perspective projection (specify ProjectionD_Mode = true in the settings). Does not redraw. When a bar of the working timeframe closes, if the identified pattern point has not moved during Patterns_Fractal_Bars bars, an arrow appears on the chart (in the direction of the expected price movement). From this moment on, the ar
This is an arrow indicator without a future function,developed based on the most advanced profit trading algorithms.It has the most innovative and advanced dual trend analysis module, as well as the latest and highly effective market trend prediction algorithm.Trends are your friends, and following larger trends can earn the maximum profit in foreign exchange. This indicator helps traders identify current trends and track them. Someone once made a profit of 10 times in a week by relying on it.No
"Auto FIBO Pro" Crypto_Forex indicator - est un excellent outil auxiliaire dans le trading ! - L'indicateur calcule et place automatiquement sur le graphique les niveaux de Fibo et les lignes de tendance locales (couleur rouge). - Les niveaux de Fibonacci indiquent les zones clés où le prix peut s'inverser. - Les niveaux les plus importants sont 23,6 %, 38,2 %, 50 % et 61,8 %. - Vous pouvez l'utiliser pour le scalping inversé ou pour le trading en grille de zones. - Il existe également de nombr
Overview Harmonic Patterns MT4 is a technical analysis indicator designed for the MetaTrader 5 platform. It identifies and displays harmonic price patterns, such as Butterfly, Cypher, Crab, Bat, Shark, and Gartley, in both bullish and bearish directions. The indicator calculates key price levels, including entry, stop loss, and three take-profit levels, to assist traders in analyzing market movements. Visual elements and customizable alerts enhance usability on the chart. Features Detects six ha
Forex Gump
Andrey Kozak
2.4 (5)
Forex Gump is a fully finished semi-automatic trading system. In the form of arrows, signals are displayed on the screen for opening and closing deals. All you need is to follow the instructions of the indicator. When the indicator shows a blue arrow, you need to open a buy order. When the indicator shows a red arrow, you need to open a sell order. Close orders when the indicator draws a yellow cross. In order to get the most effective result, we recommend using the timeframes H1, H4, D1. There
The   RSI Divergence + FVG Signal   indicator combines   Relative Strength Index (RSI) Divergence   with   Fair Value Gap (FVG)   detection to generate high-probability buy and sell signals based on both momentum shifts and institutional imbalance zones. Core Features: RSI Divergence Detection : Identifies both regular and hidden bullish/bearish divergences between price and RSI. Divergences indicate potential trend reversals or continuation. FVG Zone Recognition : Detects Fair Value Gaps (imbal
Noize Absorption Index MT4
Ekaterina Saltykova
5 (1)
Noize Absorption Index - is the manual trading system that measures the difference of pressure between bears forces and bulls forces. Green line - is a noize free index that showing curent situation. Zero value of index shows totally choppy/flat market.Values above zero level shows how powerfull bullish wave is and values below zero measures bearish forces.Up arrow appears on bearish market when it's ready to reverse, dn arrow appears on weak bullish market, as a result of reverse expectation. S
PABT Pattern Indicator - it's classical system one of the signal patterns. Indicator logic - the Hi & Lo of the bar is fully within the range of the preceding bar, look to trade them as pullback in trend. In the way if indicator found PABT pattern it's drawing two lines and arrow what showing trend way.  - First line - it's entry point and drawing at: 1. On the high of signal bar or on middle of the signal bar (depending from indicator mode) for buy; 2. On the low of signal bar or on middle of t
Trendiness Index
Libertas LLC
5 (3)
"The trend is your friend" is one of the best known sayings in investing, because capturing large trendy price movements can be extremely profitable. However, trading with the trend is often easier said than done, because many indicators are based on price reversals not trends. These aren't very effective at identifying trendy periods, or predicting whether trends will continue. We developed the Trendiness Index to help address this problem by indicating the strength and direction of price trend
"Impulses and Corrections 4" is created to help traders navigate the market situation. The indicator shows multi-time frame upward and downward "Impulses" of price movements. These impulses are the basis for determining the "Base" , which is composed of zones of corrections of price movements, as well as "Potential" zones for possible scenarios of price movement. Up and down impulses are determined based on a modified formula of Bill Williams' "Fractals" indicator. The last impulse is always "U
The indicator provides a superior alternative to price action analysis. It enables the identification of normalized patterns, which are then transformed into a graphical representation to forecast future steps within a time series. In the top-left corner, you'll find information regarding the expected prediction accuracy, determined through a complex MSQE calculation. You have the flexibility to adjust the time window, making it easy to validate the indicator's performance. Additionally, you can
Trade with Gann on your side!! MASTER CIRCLE 360 CIRCLE CHART, originally created by Gann admitted that this is “The Mother of all charts”. It is one of the last studies that this great trader left for us. The numeric tab le is apparently quite simple like all the tables and is based on square numbers, the SQUARE OF 12 and is by evolution, one of the most important square numbers. Here we can find CYCLE, PRICE AND TIME thanks to angles and grades, to show past and future support and resistance.
Quantum Falcon Signal Free is a smart visual trading indicator for MetaTrader 4 designed for Forex and Gold traders. The indicator combines: • Trend analysis • RSI momentum confirmation • MACD momentum filtering • ATR volatility filtering • Higher timeframe confirmation • Smart exit signal detection Main Features: • Smart Buy and Sell signals • Exit Buy / Exit Sell alerts • Real-time dashboard on chart • Professional candle arrows • Multi-timeframe trend confirmation • ATR market volatility filt
FREE
The Th3Eng PipFinite indicator is based on a very excellent analysis of the right trend direction with perfect custom algorithms. It show the true direction and the best point to start trading. With StopLoss point and Three Take Profit points. Also it show the right pivot of the price and small points to order to replace the dynamic support and resistance channel, Which surrounds the price. And Finally it draws a very helpful Box on the left side on the chart includes (take profits and Stop loss
Trend Ray
Andriy Sydoruk
The indicator shows the potential trend direction by cyclical-wave dependence. Thus, all the rays of the intersection will be optimal rays, in the direction of which the price is expected to move, taking into account the indicator period. Rays can be used as a direction for potential market movement. But we must not forget that the approach must be comprehensive, the indicator signals require additional information to enter the market.
[ZhiBiCCI] indicators are suitable for all cycle use, and are also suitable for all market varieties. [ZhiBiCCI] Green solid line is a reversal of bullish divergence. The green dotted line is a classic bullish divergence. [ZhiBiCCI] The solid line to the red is a reverse bearish divergence. The red dotted line is a classical bearish divergence. [ZhiBiCCI] can be set in the parameters (Alert, Send mail, Send notification), set to (true) to send instant signals to the alarm window, email, insta
Antabod Gamechanger
Rev Anthony Olusegun Aboderin
*Antabod GameChanger Indicator – Transform Your Trading!*   Are you tired of chasing trends too late or second-guessing your trades? The *Antabod GameChanger Indicator* is here to *revolutionize your trading strategy* and give you the edge you need in the markets!   Why Choose GameChanger? *Accurate Trend Detection* – GameChanger identifies trend reversals with *pinpoint accuracy*, ensuring you enter and exit trades at the optimal time.   *Clear Buy & Sell Signals* – No more guesswork! T
The indicator detects and displays М. Gartley's Butterfly pattern. The pattern is plotted by the extreme values of the ZigZag indicator (included in the resources, no need to install). After detecting the pattern, the indicator notifies of that by the pop-up window, a mobile notification and an email. The pattern and wave parameters are displayed on the screenshots. The default parameters are used for demonstration purposes only in order to increase the amount of detected patterns. Parameters z
Daily Candle Predictor est un indicateur qui prédit le cours de clôture d'une bougie. L'indicateur est principalement destiné à être utilisé sur les graphiques D1. Cet indicateur convient à la fois au trading forex traditionnel et au trading d'options binaires. L'indicateur peut être utilisé comme un système de trading autonome, ou il peut servir de complément à votre système de trading existant. Cet indicateur analyse la bougie actuelle, calcule certains facteurs de force à l'intérieur du corps
Color Stochastic Enhanced Stochastic Oscillator with Cross Detection and Visual Signal Support Overview Color Stochastic is a customized version of the classic Stochastic Oscillator designed for momentum analysis and crossover visualization. The indicator provides color-based signal marking and configurable crossover detection at user-defined overbought and oversold levels. It can be used as part of: Momentum analysis Mean reversion workflows DCA-based strategies Multi-indicator confirmation sys
The main idea of this indicator is rates analysis and prediction by Fourier transform. Indicator decomposes exchange rates into main harmonics and calculates their product in future. You may use the indicator as a standalone product, but for better prediction accuracy there is another related indicator - FreqoMaster - which uses FreqoMeterForecast as a backend engine and combines several instances of FreqoMeterForecast for different frequency bands. Parameters: iPeriod - number of bars in the ma

QuantumEdge Trader
Hossam Ali Ahmed Ali
QuantumEdge Trader v1.0 AI-Powered Precision Signals for Serious Traders QuantumEdge Trader is a smart and reliable indicator that delivers accurate BUY and SELL signals using advanced market analysis and trend detection. Designed for M1 to M60 timeframes, it's ideal for scalping and intraday strategies. --- Key Features: No Repaint – Signals never change after appearing Smart trend filters to reduce noise Adjustable sensitivity and alerts Perfect for XAUUSD, EURUSD, and m
Potential Reversal Price (PRP) Indicator - Ultimate Sniper Entries for XAUUSD Discounted   Price   !!     Secure your lifetime access   now   before it switches to   subscription-only ! Welcome to the   Potential Reversal Price (PRP) Indicator , your ultimate trading tool designed to catch high-probability market reversals with extreme precision. Built for serious traders who demand accuracy, the PRP Indicator combines advanced market structure analysis with momentum exhaustion to pinpoint the e
Chart Patterns Detect 15 patterns (Ascending Triangle, Descending Triangle, Rising Wedge, Falling Wedge, Bullish Flag, Bearish Flag, Bullish Rectangle, Bearish Rectangle Symmetrical triangle, Head and Shoulders, Inverted Head and Shoulders, Triple top, Triple Bottom, Double Top, Double Bottom) Use historical data to calculate the probability of each pattern to succeed (possibility to filter notification according to the chance of success) gives graphic indication about the invalidation level and
Price Magnet — Price Density and Attraction Levels Indicator Price Magnet is a professional analytical tool designed to identify key support and resistance levels based on statistical Price Density. The indicator analyzes a specified historical period and detects price levels where the market spent the most time. These zones act as “magnets,” attracting price action or forming a structural base for potential reversals. Unlike traditional Volume Profile tools, Price Magnet focuses on price-time d


RSI Speed mp
DMITRII GRIDASOV
Indicateur Crypto_Forex « RSI SPEED » pour MT4 : excellent outil prédictif, sans retouche. - Le calcul de cet indicateur est basé sur des équations physiques. Le RSI SPEED est la dérivée première du RSI lui-même. - Le RSI SPEED est idéal pour scalper les entrées dans la direction de la tendance principale. - Utilisez-le en combinaison avec un indicateur de tendance approprié, par exemple HTF MA (comme sur les images). - L'indicateur RSI SPEED indique la vitesse à laquelle le RSI change de dire
Infinity Trend Pro
Yaroslav Varankin
1 (1)
This is a trend indicator without redrawing Developed instead of the binary options strategy (by the color of the Martingale candlestick) Also works well in forex trading When to open trades (binary options) A signal will appear in the place with a candle signaling the current candle It is recommended to open a deal for one candle of the current timeframe M1 and M5 When a blue dot appears, open a deal up When a red dot appears, open a trade down. How to open trades on Forex. When a signal is rec
Les acheteurs de ce produit ont également acheté
TrendMaestro
Stefano Frisetti
4 (4)
Attention: beware of SCAMS, TRENDMAESTRO is only ditributed throught MQL5.com market place. note: this indicator is for METATRADER4, if you want the version for METATRADER5 this is the link:  https://www.mql5.com/it/market/product/108106 TRENDMAESTRO ver 2.5 TRENDMAESTRO recognizes a new TREND from the start, he never makes mistakes. The certainty of identifying a new TREND is priceless. DESCRIPTION TRENDMAESTRO identifies a new TREND in the bud, this indicator examines the volatility, volumes a
Indicateur Miraculous – Outil Forex et Binaire 100% Non-Repaint Basé sur le Carré de Neuf de Gann Cette vidéo présente l' Indicateur Miraculous , un outil de trading très précis et puissant, spécifiquement développé pour les traders du Forex et des Options Binaires . Ce qui rend cet indicateur unique est sa fondation sur le légendaire Carré de Neuf de Gann et la Loi de Vibration de Gann , en faisant l'un des outils de prévision les plus précis disponibles dans le trading moderne. L'Indicateur Mi
KuKl
IGOR KIRIANEN
The indicator is built on a non-standard Zig Zag, it draws accumulations after which if the price leaves this zone and a test of this zone occurs, then a sound signal is given and an arrow appears - after the test candle closes.The indicator does not redraw its signals, it is very easy to use, there are only three settings 1- this is the zig zag parameter 2- this is the minimum price exit from the zone 3- this is the maximum price exit from the zone. The lower the parameter for Zig Zag, the more
Breakout Arrows Mt4
Michael Oko Oboh
5 (1)
Trend Breakout Arrows Indicator The Trend Breakout Arrows Indicator is a momentum-based signal tool designed to identify potential bullish and bearish breakout opportunities. It displays clear arrow signals directly on the price chart, helping traders quickly recognize possible trend changes and continuation setups. Up Arrow (Buy Signal) A magenta up arrow appears below a candle when bullish momentum begins to strengthen. This signal indicates that buying pressure may be overtaking selling press
TRADING STRATEGY GUIDE DELIVERY The full Trading Strategy Guide will be sent directly to you after purchase. Just message me on MQL5 and ask for it — you'll receive it instantly, along with priority support and setup help. Powered Market Scanner for Smart Trading Decisions Keypad Support & Resistance is a next-generation MT4 trading system built for serious traders who demand precision, reliability, and clarity. It combines advanced smart filters with real-time price structure logic to genera
CountSig
Yin Zhou Luo
一款信号统计指标(MT4)——实现基于当前图表周期下的单线MA转向和双线MA金叉/死叉统计 . 转向定义:前一K向下或走平,当前K向上,视为转向向上;反之,转向向下。 金死叉定义:前一K快线在慢线下方,当前K快线在慢线上方,为金叉;反之,死叉。 参数及使用说明: 1、可指定统计K线数。 2、可指定4个不同的日内时间段,格式如"03:00-07:59",4个时间段可交叉任意输入。 3、可配置ABC三个浮盈区间段点值。如:分界区间统计小点值设为500,即当某转向信 号出现后到下一反向信号止浮盈<=此点值,计入A区间; 若大于此点值<大分界点值时,计入B区间;若大于“大分界点值”计入C区间。 4、最大/最小浮盈统计。显示所有统计区间内的最大浮盈点值和最小浮盈点值(亏损点值)。 5、输出完整信号,按信号出现顺序排列,如“ACCBCA”之类。 6、综合预测。使用概率、周期、趋势、马尔可夫链等综合概算输出预测该信号出现的归类概率值。 7、加载指定MA线。在当前图表自动载入相应设置的MA线。 8、自适应列宽。以完整显示统计信号数。 9、用法:点击相应统计按钮即输出相应的统计表格.
Fxland Price Reversal Zones (MT4) FXLAND Smart Reversal Indicator is a professional technical analysis tool designed to help traders identify potential price reversal zones and key market turning points with clarity and precision. The best reversal indicator and price return by choosing only one ceiling or floor in each time frame A masterpiece of combining mathematics and Gann, fractal matrix, Fibonacci, movement angle and time. Completely intelligent Key Features Detects potential pr
VTrende Pro mt4
Andrii Diachenko
3 (2)
VTrende Pro MT4 - MTF indicator for trend trading with a display panel for MT5 *** Videos can be translated into any language using subtitles (video language - Russian) Although the signals of the VTrende Pro indicator can be used as signals of a full-fledged trading system, it is recommended to use them in conjunction with the Bill Williams TS. VTrende Pro  MT4 is an extended version of the VTrende indicator. Difference between Pro version and VTrende: - Time zones - Signal V - signal 1-2 wave
WanaScalper MT4
Isaac Wanasolo
1 (1)
A scalping indicator based on mathematical patterns, which on average gives signals with relatively small SL, and also occasionally helps to catch big moves in the markets (more information in the video) This indicator has three main types of notifications: The first type warns of a possible/upcoming signal on the next bar The second type indicates the presence of a ready signal to enter the market/open a position The third type is for SL and TP levels - you will be notified every time price re
FFx Engulfing Setup Alerter gives trade suggestions with Entry, Target 1, Target 2 and StopLoss. Below are the different options available: Entry suggestion - pips to be added over the break for the entry 3 different options to calculate the SL - by pips, by ATR multiplier or at the pattern High/Low 3 different options to calculate the 2 TPs - by pips, by ATR multiplier or at Risk/Reward Offset the dashboard - any place on the chart Remove the suggestion once the price reached the SL line Lines
FFx InsideBar Setup Alerter gives trade suggestions with Entry, Target 1, Target 2 and StopLoss. Below are the different options available: Entry suggestion - pips to be added over the break for the entry Minimum candle size - to avoid too close buy/sell entry suggestions 3 different options to calculate the SL - by pips, by ATR multiplier or at the pattern High/Low 3 different options to calculate the 2 TPs - by pips, by ATR multiplier or at Risk/Reward Offset the dashboard - any place on the c
FFx OutsideBar Setup Alerter gives trade suggestions with Entry, Target 1, Target 2 and StopLoss. Below are the different options available: Entry suggestion - pips to be added over the break for the entry. 3 different options to calculate the SL - by pips, by ATR multiplier or at the pattern High/Low. 3 different options to calculate the 2 TPs - by pips, by ATR multiplier or at Risk/Reward. Offset the dashboard - any place on the chart. Remove the suggestion once the price reached the SL line.
FFx PinBar Setup Alerter gives trade suggestions with Entry, Target 1, Target 2 and StopLoss. Below are the different options available: Entry suggestion - pips to be added over the break for the entry Minimum candle size - to avoid too small candles 3 different options to calculate the SL - by pips, by ATR multiplier or at the pattern High/Low 3 different options to calculate the 2 TPs - by pips, by ATR multiplier or at Risk/Reward Offset the dashboard - any place on the chart Remove the sugges
Automatic, live & interactive picture of all trendlines. Assign push, email and sound alerts to the lines of your choice and be informed about price rollback, breakout, rollback after breakout, number of rollbacks, line expiration by double breakout. Correct, drag or delete the lines and interactively tune the line system. https://youtu.be/EJUo9pYiHFA . Chart examples https: //www.mql5.com/en/users/efficientforex Price Interaction Events All events are effective immediately and only after one
The purpose of this new version of the MT4 standard indicator provided in your platform is to display in a sub-window multiple timeframes of the same indicator with its divergences. See the example shown in the picture below. But the display isn't like a simple MTF indicator. This is the real display of the indicator on its timeframe. Here's the options available in the FFx divergences indicator: Select the timeframes to be displayed (M1 to Monthly) Define the width (number of bars) for each tim
The purpose of this new version of the MT4 standard indicator provided in your platform is to display in a sub-window multiple timeframes of the same indicator with its divergences. See the example shown in the picture below. But the display isn't like a simple MTF indicator. This is the real display of the indicator on its timeframe. Here's the options available in the FFx divergences indicator: Select the timeframes to be displayed (M1 to Monthly). Define the width (number of bars) for each ti
The FFx Dashboard MTF alerter will show you on a single chart all the timeframes (M1 to Monthly) with their own status for the indicator. 2 Alert Options: Single timeframe: each selected timeframe alert separately when a signal occurs Multi timeframes: all selected timeframes must agree for an alert to be triggered Both options have an input to select the timeframes to be used for the alert(s). How to Understand the Status: Green/Red square: histogram above/below 0 line Green square + Red bord
The FFx Dashboard MTF alerter will show you on a single chart all the timeframes (M1 to Monthly) with their own status for the indicator. 2 Alert Options: Single timeframe: each selected timeframe alert separately when a signal occurs Multi timeframes: all selected timeframes must agree for an alert to be triggered Both options have an input to select the timeframes to be used for the alert(s). How to understand the status: Green/Red square: RSI above/below 50 line Green square + Red border: R
The FFx Dashboard MTF alerter will show you on a single chart all the timeframes (M1 to Monthly) with their own status for the indicator. 2 Alert Options: Single timeframe: each selected timeframe alert separately when a signal occurs Multi timeframes: all selected timeframes must agree for an alert to be triggered Both options have an input to select the timeframes to be used for the alert(s). How to understand the status: Green/Red square: Stoch above/below 50 line Green square + Red border:
The FFx Dashboard MTF alerter will show you on a single chart all the timeframes (M1 to Monthly) with their own status for the indicator. 2 Alert Options: Single timeframe: each selected timeframe alert separately when a signal occurs Multi timeframes: all selected timeframes must agree for an alert to be triggered Both options have an input to select the timeframes to be used for the alert(s). How to understand the status: Green/Red square: Price above/below Cloud (Kumo) Green square + Red bo
The FFx Dashboard MTF alerter will show you on a single chart all the timeframes (M1 to Monthly) with their own status for the indicator. 2 Alert Options: Single timeframe: each selected timeframe alert separately when a signal occurs Multi timeframes: all selected timeframes must agree for an alert to be triggered Both options have an input to select the timeframes to be used for the alert(s). How to understand the status: Green/Red square: MA pointing Up/Down Green square + Red border: MA po
The FFx Dashboard MTF alerter will show you on a single chart all the timeframes (M1 to Monthly) with their own status for the indicator. 2 Alert Options: Single timeframe: each selected timeframe alert separately when a signal occurs. Multi timeframes: all selected timeframes must agree for an alert to be triggered. Both options have an input to select the timeframes to be used for the alert(s). How to understand the status: Green square: Price above PSAR Red square: Price below PSAR Options
The FFx Dashboard MTF alerter will show you on a single chart all the timeframes (M1 to Monthly) with their own status for the indicator. 2 Alert Options: Single timeframe: each selected timeframe alert separately when a signal occurs Multi timeframes: all selected timeframes must agree for an alert to be triggered Both options have an input to select the timeframes to be used for the alert(s). How to understand the status: Green/Red square: CCI above/below levels (ie. 100/-100) Grey square: C
The FFx Dashboard MTF alerter will show you on a single chart all the timeframes (M1 to Monthly) with their own status for the indicator. 2 Alert Options: Single timeframe: each selected timeframe alert separately when a signal occurs Multi timeframes: all selected timeframes must agree for an alert to be triggered Both options have an input to select the timeframes to be used for the alert(s). How to understand the status: Green/Red square: ADX above level Grey square: ADX below level Red bor
The FFx Dashboard MTF alerter will show you on a single chart all the timeframes (M1 to Monthly) with their own status. 2 Alert Options: Single timeframe: each selected timeframe alert separately when a signal occurs Multi timeframes: all selected timeframes must agree for an alert to be triggered Both options have an input to select the timeframes to be used for the alert(s). How to understand the status: Green/Red square: bullish/bearish candle Options available in the FFx Dashboard Alerter
The indicator of a Professional Trader is an arrow indicator for predicting the direction of price movement. I have been working on this indicator since 2014. You can use this indicator as your main indicator, use its entry signals, and use it as your only indicator to find entry points. About the product: Recommended TF [H4-D1-W1]   . The indicator predicts the direction of the next candle. Fits a variety of tools; Flexibility in settings for different instruments and intervals through the MO
The [GRAFF] III manual trading system is based on multiple MetaTrader (MT4) indicators. Together, the entire PACK of GRAFF III indicators makes an advanced trading tool. The system consists of over 20 different custom-built indicators which have been carefully selected and tested in the long term to produce strong and efficient trading signals. The particular indicators are based on different mathematical formulas, so the entire system is calibrated to remove false signals from its own indicator
Plus de l'auteur
KAMA Confluence Engine Tradez dans le sens de la tendance — et connaissez votre Entrée, Stop et Objectifs dès l’instant où le marché se retourne. Le KAMA Confluence Engine est un indicateur de tendance tout‑en‑un basé sur la moyenne mobile adaptative de Kaufman (KAMA), enrichi par une pondération du volume en ticks, une confirmation multi‑unités de temps et des niveaux de trading automatiques. Il s’adapte au marché : rapide et réactif en tendance, stable et filtré en période de range — pour vous
L’indicateur met en évidence les zones où un intérêt est déclaré sur le marché , puis montre la zone d’accumulation des ordres . Il fonctionne comme un carnet d’ordres à grande échelle . C’est l’indicateur destiné aux grands capitaux . Ses performances sont exceptionnelles. Quel que soit l’intérêt présent sur le marché, vous le verrez clairement . (Il s’agit d’une version entièrement réécrite et automatisée – l’analyse manuelle n’est plus nécessaire.) La vitesse de transaction est un indicateur
Meravith Scanner
Ivan Stefanov
5 (2)
MERAVITH SCANNER est un indicateur professionnel pour les marchés financiers sur MetaTrader 5, qui regroupe plusieurs outils d’analyse en un seul système intégré. Il effectue tous les calculs automatiquement en utilisant une méthodologie propriétaire de prix moyen pondéré par le volume (VWAP), éliminant ainsi toute interprétation subjective. Cet indicateur fonctionne sur toutes les classes d’actifs (Forex, actions, indices, matières premières, cryptomonnaies) et sur toutes les périodes, de M1 au
Imbalance Pro
Ivan Stefanov
5 (4)
L'indicateur mesure le déséquilibre entre les haussiers et les baissiers sur une période donnée et affiche une ligne droite entre les deux points. Si les haussiers ont plus de volume que les baissiers, la ligne devient verte.  Si les baissiers ont plus de volume, elle est rouge. La ligne indique également le pourcentage de différence de volume. L'indicateur affiche les mêmes données dans une fenêtre séparée. Vous pouvez également voir le volume divisé. L'indicateur a deux modes. À cet effe
MACD divergency
Ivan Stefanov
4.63 (8)
Cet indicateur identifie avec précision les divergences haussières et baissières entre les mouvements de prix et l’histogramme MACD, en utilisant des moyennes mobiles exponentielles (EMA) de périodes 5 (rapide) et 34 (lente), ainsi qu’une ligne de signal de période 5. Il met en évidence les points où le momentum faiblit, signalant de possibles renversements de tendance. Règles pour une identification correcte des divergences La divergence haussière est valide lorsque le prix forme des creux plus
FREE
Meravith MT5
Ivan Stefanov
5 (3)
Outil des market makers. Meravith va : Analyser toutes les unités de temps et afficher la tendance actuellement en vigueur. Mettre en évidence les zones de liquidité (équilibre des volumes) où le volume haussier et baissier est égal. Afficher tous les niveaux de liquidité provenant de différentes unités de temps directement sur votre graphique. Générer et présenter une analyse de marché sous forme de texte pour votre référence. Calculer les objectifs, les niveaux de support et les points de stop
RSI Divergence Pulse est un indicateur RSI complet qui combine détection de divergences, analyse multi-timeframe et outils visuels dans une seule application légère. Il identifie automatiquement les divergences régulières et cachées, affiche un panneau RSI Multi-Timeframe en direct, remplit les zones OB/OS pour une reconnaissance visuelle, trace des lignes de divergence à la fois sur le graphique des prix et dans la sous-fenêtre RSI, place des flèches Buy/Sell et fournit des alertes en temps ré

KAMA Confluence Engine Tradez dans le sens de la tendance — et connaissez votre Entrée, Stop et Objectifs dès l’instant où le marché se retourne. Le KAMA Confluence Engine est un indicateur de tendance tout‑en‑un basé sur la moyenne mobile adaptative de Kaufman (KAMA), enrichi par une pondération du volume en ticks, une confirmation multi‑unités de temps et des niveaux de trading automatiques. Il s’adapte au marché : rapide et réactif en tendance, stable et filtré en période de range — pour vous
FREE
Enigmera
Ivan Stefanov
5 (9)
ENIGMERA : Le cœur du marché Important : La démo de MQL5.com fonctionne dans le Strategy Tester et peut ne pas refléter pleinement les fonctionnalités d'Enigmera. Consultez la description, les captures d'écran et la vidéo pour plus de détails. N'hésitez pas à m'envoyer un message si vous avez des questions ! Le code de l'indicateur a été entièrement réécrit. La version 3.0 ajoute de nouvelles fonctionnalités et corrige les bugs accumulés depuis le lancement de l'indicateur. Introduction Cet in
Cet indicateur identifie avec précision les divergences haussières et baissières entre les mouvements de prix et l’histogramme MACD, en utilisant des moyennes mobiles exponentielles (EMA) de périodes 5 (rapide) et 34 (lente), ainsi qu’une ligne de signal de période 5. Il met en évidence les points où le momentum faiblit, signalant de possibles renversements de tendance. Règles pour une identification correcte des divergences La divergence haussière est valide lorsque le prix forme des creux plus
FREE
Times MT5
Ivan Stefanov
TIMES ajoute la dimension temporelle à votre analyse. C’est le troisième élément d’une trinité de trading : Meravith montre le prix juste, TransactionSpeed montre le volume juste, et TIMES montre à quel moment l’activité de marché se concentre — révélant si le momentum se construit ou s’affaiblit. Ce qu’il trace : les zones (rectangles) Au lieu d’encombrer le graphique avec des lignes, TIMES condense son analyse en rectangles colorés dessinés directement sur le graphique de prix. Chaque rectang
Two Snakes
Ivan Stefanov
5 (1)
2 SNAKES est un système de scalping de première classe. Comme les entrées sont très précises, il est probable que vous deviendrez rapidement accro à ce système.  Vous avez 2 serpents. Lorsque vous voyez une bougie au-dessus ou au-dessous d'eux qui ne les touche pas - c'est votre signal de scalping. Si vous utilisez un cadre temporel plus large, le scalping peut devenir un suivi de tendance. Les serpents sont calculés précisément en fonction de l'état actuel du marché. Ils NE SONT PAS des
Levelss
Ivan Stefanov
5 (1)
L'indicateur LEVELSS montre : - Les zones haussières et baissières quotidiennes. Elle est visible tous les jours de 00h00 à 23h59.  - La zone haussière et baissière hebdomadaire. Elle est visible du lundi 0:00 au vendredi 23:59 chaque semaine. - Canal spécialement calculé à partir d'un timeframe spécifique qui est affiché sur tous les autres timeframes. Par défaut, il s'agit de l'échelle de temps de 4 heures que vous pouvez changer pour l'échelle de temps de votre choix. Il est calculé en cont
GANN Master
Ivan Stefanov
5 (1)
Les objectifs précis de GANN sont calculés selon ses méthodes éprouvées et présentés devant vous. Cet outil est conçu pour rendre le trading plus fluide et intuitif. En déplaçant la ligne blanche vers le haut ou la ligne verte vers le bas, vous comprendrez immédiatement pourquoi les techniques de GANN restent influentes dans le monde du trading. Les stratégies de GANN se concentrent sur la prévision des mouvements de marché avec une grande précision, et cet outil met ce pouvoir à votre portée. Q
Sense
Ivan Stefanov
5 (2)
SENSE est un système automatisé qui combine des méthodes GANN sélectionnées avec des calculs fractals. Le système nous indique où ouvrir et fermer les transactions. Plus besoin de perdre du temps avec des calculs complexes - SENSE fait tout pour vous. Il suffit d'installer l'indicateur. Principes de base : Le marché est haussier lorsque le prix se situe au-dessus des lignes blanches. Acheter au-dessus des lignes blanches, s'arrêter en dessous Les lignes vertes sont des objectifs de hausse L
Meravith
Ivan Stefanov
5 (3)
Outil des market makers. Meravith va : Analyser toutes les unités de temps et afficher la tendance actuellement en vigueur. Mettre en évidence les zones de liquidité (équilibre des volumes) où le volume haussier et baissier est égal. Afficher tous les niveaux de liquidité provenant de différentes unités de temps directement sur votre graphique. Générer et présenter une analyse de marché sous forme de texte pour votre référence. Calculer les objectifs, les niveaux de support et les points de stop
Stefanov
Ivan Stefanov
The indicator displays support and resistance zones defined logically using the MACD. The entire concept is explained in the video, with specific examples shown. The indicator works on any instruments and timeframes. It does not repaint. After placing it on the chart, please go through all the timeframes sequentially, from monthly to 1-minute, so that all lines load correctly. After that, you can start using it. The concept is unique and has not been seen in other systems or indicators.
Fifty Pro
Ivan Stefanov
5 (1)
L'indicateur FIFTY est désormais disponible en version automatisée, éliminant le besoin de tracer manuellement les niveaux. Cette version affiche automatiquement les niveaux quotidiens, hebdomadaires, mensuels et annuels sur le graphique, garantissant une grande précision et un gain de temps. De plus, des boutons permettent d’activer ou de désactiver la visibilité de ces niveaux, offrant une personnalisation complète. Pour ceux qui le souhaitent, la version gratuite de l’indicateur reste disponi
« “Naturu” est un indicateur manuel qui utilise la symétrie de la nature comme algorithme. Dominez le marché grâce à une stratégie simple et à une sagesse cachée ! Lorsque vous chargez l’indicateur, deux lignes apparaissent — Haut (Top) et Bas (Bottom). Cliquez une fois sur une ligne pour l’activer. Pour la déplacer, cliquez simplement sur la bougie où vous souhaitez la placer. Vous définissez un point haut et un point bas, et l’indicateur calcule automatiquement : une zone magenta montrant l’en
RSI Divergence Pulse — Smart Divergence Scanner with MTF Panel, Zone Fill, Alerts & Dashboard SHORT DESCRIPTION Professional RSI indicator with automatic Regular & Hidden divergence detection, color-coded RSI line, Multi-Timeframe panel, OB/OS zone fills, Buy/Sell arrows, signal labels, real-time dashboard, and multi-channel alerts. Works on any symbol and timeframe. FULL DESCRIPTION
Enigmera MT5
Ivan Stefanov
3.67 (3)
ENIGMERA : Le noyau du marché (Ceci est un indicateur manuel et contient des fonctions qui peuvent ne pas être prises en charge par l’environnement de test actuel de MetaTrader) Introduction Cet indicateur et ce système de trading représentent une approche unique des marchés financiers. ENIGMERA utilise des cycles fractals pour calculer avec précision les niveaux de support et de résistance. Il montre la véritable phase d’accumulation et fournit la direction ainsi que les objectifs. C’est un sys
L’un des rares indicateurs qui calcule les niveaux uniquement en fonction du prix. Il n’est pas affecté par les unités de temps, les tendances ou les cycles de marché. L’un des indicateurs les plus logiques jamais créés. L’indicateur FIFTY est désormais disponible en version automatisée, supprimant le besoin de tracer manuellement les niveaux. Cette version affiche automatiquement les niveaux journaliers, hebdomadaires, mensuels et annuels sur le graphique, garantissant précision et gain de temp
Les niveaux légendaires de William Gann dans un indicateur MT5 entièrement automatisé. GANN Master identifie les zones clés où le prix est le plus susceptible de se retourner ou de poursuivre sa tendance, en se basant sur des données Daily, Weekly et Monthly. Fonctionnalités clés : Boutons de période en un clic : cliquez sur Daily, Weekly ou Monthly pour tracer instantanément les zones du jour, de la semaine ou du mois Modes automatique et manuel • Automatique : GANN Master calcule tous les nive
SPEKULATOR est un système de trading manuel et un indicateur qui vous aide à identifier les zones clés de support et la direction du marché. Maîtrisez le marché avec une stratégie simple et une sagesse cachée. Vous choisissez n'importe quel sommet (TOP) et bas (BOTTOM) sur le graphique, et l'indicateur trace : Une zone de support pour votre tendance. Pour une tendance haussière, une zone verte apparaît ; pour une tendance baissière, une zone rouge. La sensibilité de la zone de support peut être
Naturu
Ivan Stefanov
5 (1)
« “Naturu” est un indicateur manuel qui utilise la symétrie de la nature comme algorithme. Dominez le marché grâce à une stratégie simple et à une sagesse cachée ! Lorsque vous chargez l’indicateur, deux lignes apparaissent — Haut (Top) et Bas (Bottom). Cliquez une fois sur une ligne pour l’activer. Pour la déplacer, cliquez simplement sur la bougie où vous souhaitez la placer. Vous définissez un point haut et un point bas, et l’indicateur calcule automatiquement : une zone magenta montrant l’en
Oscillateur de momentum avancé qui ajuste automatiquement sa période en fonction de la volatilité du marché pour des signaux de surachat et de survente plus précis. Fonctionnement : L'indicateur utilise un calcul de période adaptative qui se raccourcit en période de forte volatilité et s'allonge en période de faible volatilité. Cet ajustement dynamique fournit des signaux plus rapides lorsque le marché est en tendance et réduit les faux signaux pendant les phases de consolidation. La valeur RSI
Institutional Sniper — Flux d’Ordres Institutionnels + Structure Smart Money + Signaux de Précision Institutional Sniper est un indicateur complet tout‑en‑un qui combine un moteur de tendance professionnel, des zones de support/résistance et d’offre/demande, les concepts Smart Money (BOS / CHoCH + Order Blocks), un tableau de bord multi‑unités de temps, ainsi qu’un plan de trading automatique (Entrée / Stop Loss / TP1 / TP2) — le tout dans un outil unique, sans repaint, doté d’une interface pro
Filtrer:
Aucun avis
Répondre à l'avis