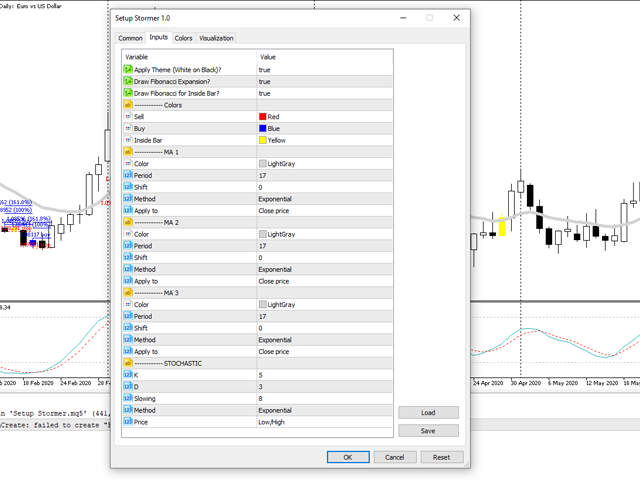
Setup Stormer
- Indicadores
- Versión: 1.0

Configuración gráfica y señales de compra y venta basadas en la estrategia de swing, posición y day trade de Stormer (Alexandre Wolwacz, trader brasileño ), descrita en su canal de youtube (https://www.youtube.com/watch?v= 0QZ_NjWkwl0).
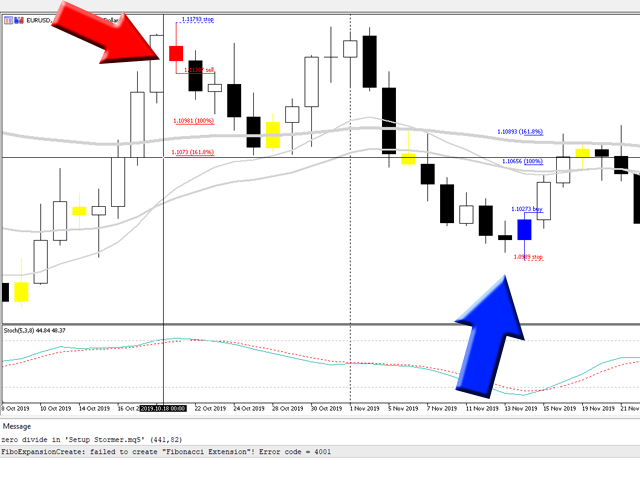
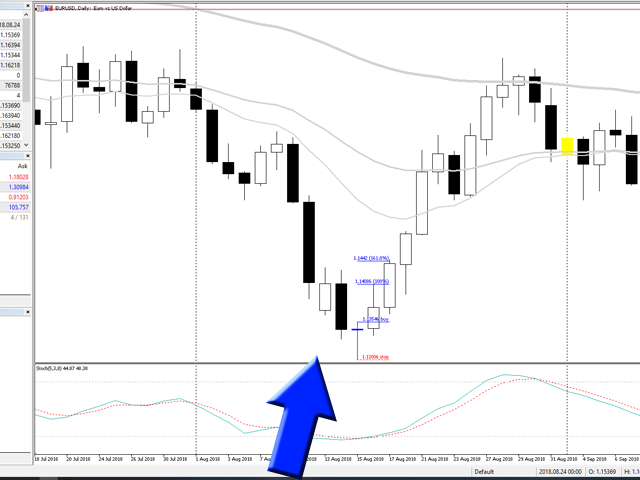
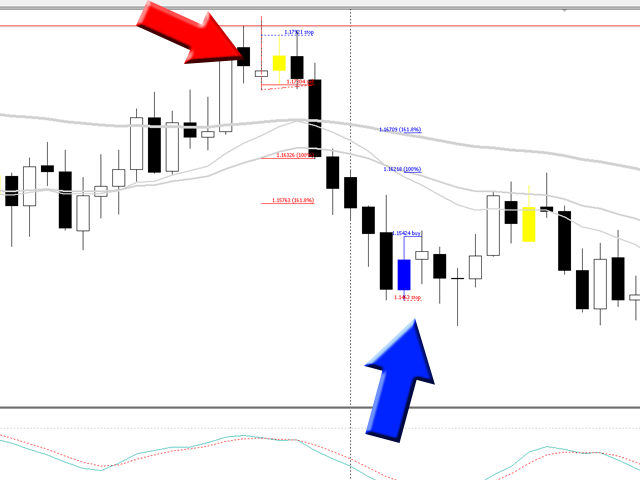
Las indicaciones de compra y venta se basan en 2 patrones de velas(Inside Bar [Amarillo] y Reversal Closing Price [Azul y Rojo]), 3 Medias Móviles y 1 Estocástico.
Indicadores:
- Inside Bar - Patrón de velas que indica la continuidad de la tendencia o un cambio de tendencia.
- Reversal Closing Price - Patrón de velas que indica un cambio de tendencia.
- Medias móviles: se utilizan para determinar la tendencia del precio.
- Estocástico - Se utiliza para comprobar los estados en los que el mercado vendió o compró más de lo que debería, y por lo tanto existe la posibilidad de crear tops y bottoms
Cómo utilizarlo:
Cuando hay una oportunidad para comprar o vender, el indicador mostrará una expansión de Fibonacci que contiene los siguientes valores:
- compra/venta - Valor recomendado de entrada de una operación
- stop - Valor recomendado para colocar el stop de la operación
- 100% - Valor del objetivo para realizar parcialmente la operación. En este momento, puede mover el stop de la operación para garantizar el beneficio
- 161.8% - Valor del objetivo de beneficio de la operación
¡IMPORTANTE! La operación sólo se puede introducir hasta 2 velas después de que aparezca la SEÑAL.
Ej. Si la señal de entrada fue una Inside Bar [Amarilla], introduzca la vela sólo después de la Inside bar o de la Next Candle. Si la señal de entrada fue en una vela de inversión [Rojo, Azul], introduzca sólo la vela después de la vela de inversión o la vela siguiente.


Muito bom obrigado por compartilhar