ST Cross

Introduction

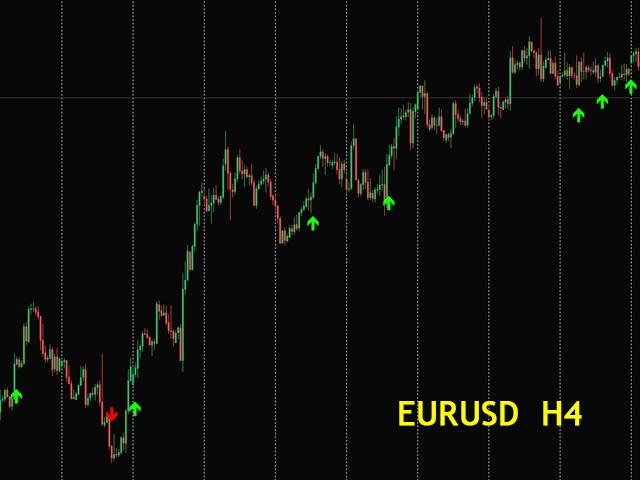
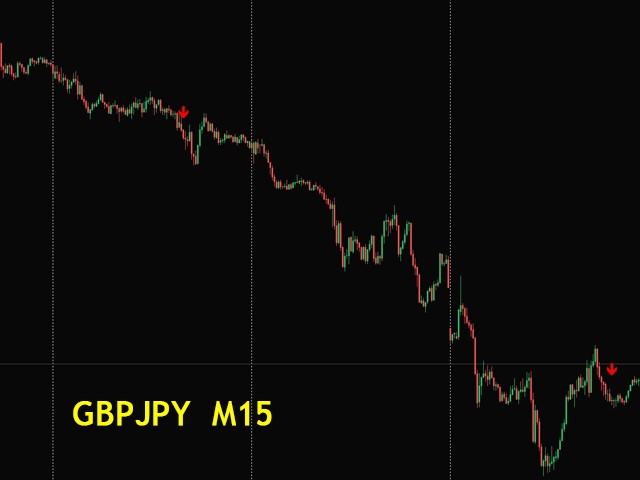
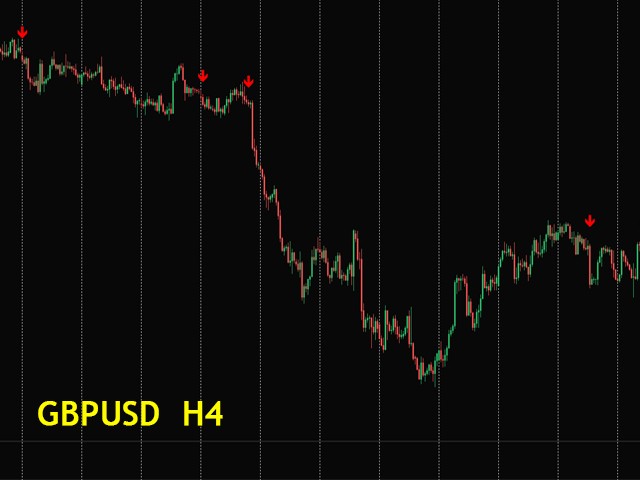
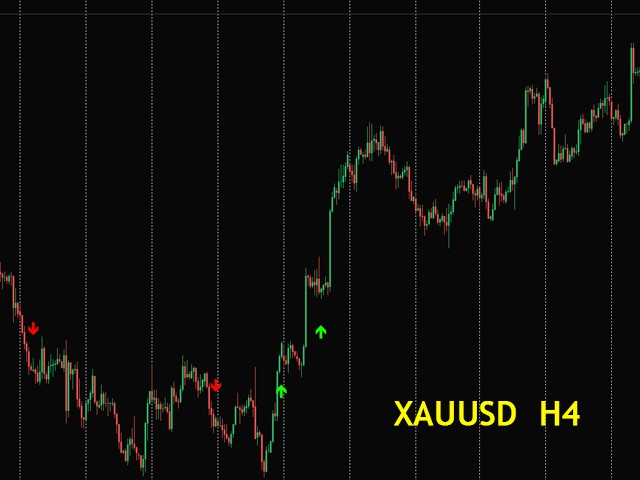
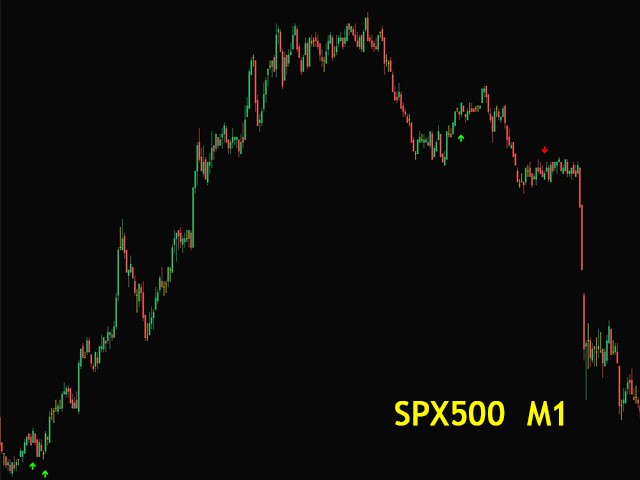
The ST Cross indicator is based on the traditional Moving Average (MA) Cross which uses a fast and slow moving average. Entry signals to buy and sell are given when both moving averages cross. However with the basic strategy there are a lot of false signals. In order to filter the trades we use the 200 (MA) to identify the overall direction of the trend.

Input Settings

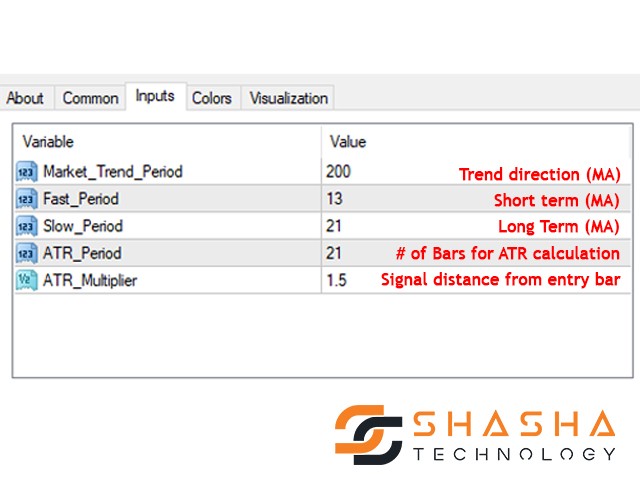
  •           Master Trend Period     -     200 Period moving average used to get the trend direction.
  •           Fast Period                  -     This moving average sticks close to price and shows short term movement.        
  •           Slow Period                 -     This moving average is further away from price and shows medium term movement.
  •           ATR Period                   -     Sets the number of bars to use for the ATR calculation
  •           ATR Multiplier              -     Sets the indicator distance away from candle low (for buy) candle High (for sell)

This indicator can be used on any timeframe and any symbol but works best with symbols that trends more.


Recommended products
RelicusRoad MACD v2
Relicus LLC
4.6 (5)
The Moving Average Convergence Divergence (MACD) trading strategy is a popular technical analysis tool that is used to identify changes in momentum and trend direction. The MACD is calculated by subtracting the 26-period exponential moving average (EMA) from the 12-period EMA. A 9-period EMA, called the "signal line," is then plotted on top of the MACD to act as a trigger for buy and sell signals. The MACD is considered to be in bullish territory when the MACD line is above the signal line and
FREE
Persian Ichimoku: The Next Generation of Fibonacci-Enhanced Trading Elevate your Ichimoku strategy with the most advanced and customizable Ichimoku indicator on the Market. The Persian Ichimoku is not just another Ichimoku cloner; it is a professional-grade trading powerhouse designed for traders who demand precision, flexibility, and deeper market insights. By merging classic Ichimoku Kinko Hyo logic with Fibonacci ratios and the innovative Quality Line , this tool redefines trend analysis. ###
HMA Trend
Pavel Zamoshnikov
4.55 (71)
A trend indicator based on the Hull Moving Average (HMA) with two periods. The Hull Moving Average is an improved variant of the moving average, which shows the moment of trend reversal quite accurately. It is often used as a signal filter. Combination of two types of Hull Moving Averages makes a better use of these advantages: HMA with a slow period identifies the trend, while HMA with a fast period determines the short-term movements and signals in the trend direction. Features The movement d
FREE
OsMA Arrow MTF
Pavel Shutovskiy
3.9 (10)
The indicator displays crossing zero level by Moving Average of Oscillator (OsMA) in the form of arrows. The this is a multi-timeframe indicator, and it displays signals from other timeframes. The indicator notifies about a signal by means of a pop-up Alert window, or sending notification to e-mail. Parameters Time-frame - select timeframe to show indicator signals. Fast EMA Period - fast EMA. This is an exponential moving average from a price with a short period. Slow EMA Period - slow EMA. Th
FREE
Th3Eng HistoMaster
Ahmed Farag
4.67 (3)
Th3Eng HistoMaster  indicator Free Histogram Indicator to detect the current trend direction. The indicator is based on CCI indicator. Also draw arrows when it detect the trend is strong buy or strong sell, with Alerting system (Popup with sound, Email alerting and mobile notification). Also draws a dashboard shows all Time-Frames' current signal. Requirements works with all pairs, stocks, CFDs and crypto currencies. works with all Spreads works with all Account types works on all Time-Frames
FREE
SMA Indicator
Nitu Brijesh Yadav
Arrow Indicator (Buy/Sell Alerts) – Simple Yet Powerful Tool!             Product Version: 1.01           Indicator Type: Trend Reversal Signals           Timeframes Supported: All (Recommended: H1, H4, D1)           Key Features: Buy Signal: Green upward arrow () appears below the candle  Sell Signal : Red downward arrow () appears above the candle Accurate Trend Reversal Detection – Based on tried and tested SMA strategy. ️ Clean Chart View – Minimalist, non-i
FREE
Candle Countdown — Accurate Time to Close for MT4 Candle Countdown is a simple and precise tool that shows the remaining time until the current candle closes directly on the chart. When your entry depends on the candle close, even a few seconds matter. This indicator helps you see the exact time and make decisions without rushing or guessing. An indicator for precise control over candle closing time. The indicator displays: time remaining until candle close current server time spread Stop Level
FREE
Crystal Heikin Ashi MT4
Muhammad Jawad Shabir
4 (1)
Crystal Heikin Ashi – Advanced Visual Heikin Ashi -MT4 Version Overview Crystal Heikin Ashi for MetaTrader 4 is a clean, professional-grade Heikin Ashi indicator that enhances chart visualization and provides clarity for price action traders, scalpers, and analysts. This MT4 version focuses on pure Heikin Ashi candles with smart styling , while keeping the system lightweight and optimized for fast performance. Note: Trend-based coloring and advanced momentum detection are available in the MT5 ve
FREE
The Crossing
Anton Iudakov
5 (2)
+ 2 bonus strategies! Alerts! I recommend watching my advisor -   Night Zen EA The indicator combines the most popular moving average strategies: Simple moving average crossover. Moving average crossover relative to the position of the slower moving average. 2 bonus strategies : The crossing of the fast moving average with the calculation of the opening prices of the slow moving average with the calculation of the closing prices taking into account the slower moving average. (The settings for th
FREE
What is Schaff Trend Cycle? The Schaff Trend Cycle (STC) is an oscillator-type indicator designed to detect trend reversals in a timely manner. Compared to traditional indicators like moving averages or MACD, it combines cyclical patterns with momentum to more clearly identify the beginning and end of trends. Main Features Clear trend reversal signals: The cycle line rises in an uptrend and falls in a downtrend. Noise reduction in ranging markets: Smoothing based on cyclical timing helps filter
FREE
MA Search 3
Mariusz Piotr Rodacki
This indicator allows you to overlay three different moving averages on the chart simultaneously. Each of these moving averages has additional settings such as: -Time frame -Shift -MA method -Applied price Using this indicator, you can easily set up three moving averages and find the one that suits you the best. You can also use this indicator to determine the trend when the moving averages cross.
FREE
Power Trend Free
Yurij Kozhevnikov
5 (2)
Power Trend Free - the indicator shows the trend strength in the selected period. Input Parameters The indicator has three input parameters: Period - a positive number greater than one, it shows the number of candlesticks used for calculations. If you enter one or zero, there will be no error, but the indicator will not be drawn. Applied Price - the standard "Apply to:" set meaning data used for the indicator calculation: Close - Close prices; Open - Open prices; High - High prices; Low - Low p
FREE
Volume Oscilator is a popular indicator available in trading view which is very popular among traders Definition The Volume Oscillator is an indicator made up of two Moving Averages (MA) surrounding volume, one being fast and the other slow. The slow volume MA value is then subtracted from the value of the fastlow Moving Average. The Volume Oscillator measures volume by analyzing the relationship between the two Moving Averages mentioned. When combined with other indicators it provides a very st
FREE
MTF Stochastic and RSI
Georgiy Gazaryan
5 (2)
A simple but effective helper that will allow you to track both global and local market trends. The indicator combines the work of two oscillators: Stochastic and RSI. Both indicators can be set to any timeframe. Advantages of Use Multitimeframe - you can adjust both indicators to the desired timeframes. To obtain the entry points, you can use the Elder's triple screen system. Highly customizable - you can configure not only the parameters of the indicators, but also their appearance (color and
FREE
Trendline indicator
David Muriithi
2 (1)
Are you tired of drawing trendlines every time you're analyzing charts? Or perhaps you would like more consistency in your technical analysis. Then this is for you. This indicator will draw trend lines automatically when dropped on a chart. How it works Works similar to standard deviation channel found on mt4 and mt5. It has 2 parameters: 1. Starting Bar 2. Number of bars for calculation The   starting bar   is the bar which drawing of the trend lines will begin, while the   number of bars for c
FREE
Traditional MACD MT4
Daniel Lewis
4.58 (55)
MACD indicator in MetaTrader 4/5 looks different than MACD does in most other charting software. That is because the MetaTrader 4/5 version of MACD displays the MACD line as a histogram when it is traditionally displayed as a line. Additionally, the MetaTrader 4/5 version computes the Signal line using an SMA, while according to MACD definition it is supposed to be an EMA. The MetaTrader 4/5 version also does not compute a true MACD Histogram (the difference between the MACD/Signal lines). This
FREE
WAD Stoch
Yonny Pascal Ekwa Mezui
WAD Divergence + Stochastic Overview WAD Divergence + Stochastic is a technical indicator designed to assist traders in identifying potential market turning points. It combines price behavior with momentum confirmation to highlight areas where buying or selling pressure may be shifting. The indicator works directly on the chart and provides clear visual signals to support decision-making in fast-moving markets. How It Works The indicator analyzes the relationship between price movement and inte
FREE
Extremum by trend
Anton Iudakov
5 (2)
Looking for entry points along the local trend without repaint! Arrows indicate entry points. Based on classic indicators. The indicator is easy to use. Settings Наименование Описание Frequency factor Signal frequency. The less, the more often. This affects the quality. Recommendations Recommended for use on major currency pairs. Timeframe from m5, m15, m30 Subscribe to my telegram channel, where we discuss intraday trading, ideas, indicators, etc., a link in my profile contacts.
FREE
Double HMA lines MTF
Pavel Zamoshnikov
5 (1)
This is a multi-timeframe version of the popular Hull Moving Average (HMA). The Double HMA MTF Light indicator combines two timeframes on a single chart. The HMA of the higher timeframe defines the trend, and the HMA of the current timeframe defines short-term price movements. The indicator is freely distributed and hasn't audio signals or messages. Its main function is the visualization of price movements. If you need advanced functionality of the HMA multi-timeframe indicator (information ab
FREE
Wise Men Indicator demo
Bohdan Kasyanenko
3 (2)
The indicator displays signals according to the strategy of Bill Williams on the chart. Demo version of the indicator has the same features as the paid, except that it can work only on a demo account . Signal "First Wise Man" is formed when there is a divergent bar with angulation.  Bullish divergent bar - with lower minimum and closing price in the upper half. Bearish divergent bar - higher maximum and the closing price at the bottom half. Angulation is formed when all three lines of Alligator
FREE
Triple RSI
Pablo Leonardo Spata
1 (1)
LOOK AT THE FOLLOWING STRATEGY WITH THIS INDICATOR. Triple RSI is a tool that uses the classic Relative Strength Indicator, but in several timeframes to find market reversals.    1.  ️ Idea behind the indicator and its strategy: In Trading, be it Forex or any other asset, the ideal is to keep it simple, the simpler the better . The triple RSI strategy is one of the simple strategies that seek market returns. In our experience, where there is more money to always be won, is in the marke
FREE
Follow The Line
Oliver Gideon Amofa Appiah
3.94 (16)
FOLLOW THE LINE GET THE FULL VERSION HERE: https://www.mql5.com/en/market/product/36024 This indicator obeys the popular maxim that: "THE TREND IS YOUR FRIEND" It paints a GREEN line for BUY and also paints a RED line for SELL.  It gives alarms and alerts of all kinds. IT DOES NOT REPAINT and can be used for all currency pairs and timeframes. Yes, as easy and simple as that. Even a newbie can use it to make great and reliable trades. NB: For best results, get my other premium indicators for more
FREE
Crossover MA Histogram
Mariusz Piotr Rodacki
The Cossover MA Histogram indicator is a simple tool showing the trend based on crossover of moving averages. Simply specify two mobving averages and addicional parameters like MA method and Applied price. When fast MA is above slow MA the histogram is green, indicating an uptrend. When MA fast is below MA slow the histogram is red, indicating an downtrend.
FREE
FlatBreakout
Aleksei Vorontsov
FlatBreakout (Free Version) Flat Range Detector and Breakout Panel for MT4 — GBPUSD Only FlatBreakout is the free version of the professional FlatBreakoutPro indicator, specially designed for flat (range) detection and breakout signals on the GBPUSD pair only. Perfect for traders who want to experience the unique fractal logic of FlatBreakout and test breakout signals on a live market without limitations. Who Is This Product For? For traders who prefer to trade breakout of flat ranges (breakout,
FREE
Free automatic Fibonacci is an indicator that automatically plots a Fibonacci retracement based on the number of bars you select on the BarsToScan setting in the indicator. The Fibonacci is automatically updated in real time as new highest and lowest values appears amongst the selected bars. You can select which level values to be displayed in the indicator settings. You can also select the color of the levels thus enabling the trader to be able to attach the indicator several times with differe
FREE
Tipu Heikin Ashi Panel
Kaleem Haider
4.56 (18)
Tipu Heikin-Ashi Panel is the modified version of the original Heiken Ashi indicator published by MetaQuotes here . A professional version of this indicator is available here . Features An easy to use Panel that shows the Heiken Ashi trend of selected timeframe. Customizable Buy/Sell alerts, push alerts, email alerts, or visual on-screen alerts. Customizable Panel. The panel can be moved to any place on the chart or minimized to allow more space. Heikin means "the average", and Ashi means "foot
FREE
............................................hi................................................ .........................its a simple indicator of movings ............................ .........................a diffrent show of moving averages.......................... ...............can select period , shift , mode and applied price.................. ............many traders use movings for find market movement................. ...........................it can helpfull for finding trends.......
FREE
Head and Shoulders Pattern Indicator - Your Key to Recognizing Trend Reversals Unlock the power of pattern recognition with the "Head and Shoulders Pattern Indicator." This cutting-edge tool, designed for MetaTrader, is your trusted ally in identifying one of the most powerful chart patterns in technical analysis. Whether you're a novice or an experienced trader, this indicator simplifies the process of spotting the Head and Shoulders pattern, allowing you to make informed trading decisions. Key
FREE
PZ Penta O MT4
PZ TRADING SLU
2.33 (3)
The Penta-O is a 6-point retracement harmonacci pattern which usually precedes big market movements. Penta-O patterns can expand and repaint quite a bit. To make things easier this indicator implements a twist: it waits for a donchian breakout in the right direction before signaling the trade. The end result is an otherwise repainting indicator with a very reliable trading signal. The donchian breakout period is entered as an input. [ Installation Guide | Update Guide | Troubleshooting | FAQ | A
FREE
With this system you can spot high-probability trades in direction of strong trends. You can profit from stop hunt moves initiated by the smart money! Important Information How you can maximize the potential of the scanner, please read here: www.mql5.com/en/blogs/post/718109 Please read also the blog about the usage of the indicator: Professional Trading With Strong Momentum This FREE Version of the indicator works only on EURUSD and GBPUSD. The full version of the indicator can be found here:
FREE
Buyers of this product also purchase
Genesis Matrix Pro is a professional multi-timeframe trend detection indicator designed to help traders identify high-quality market alignment with clarity and structure. It combines 12 different technical indicators into one visual alignment matrix, allowing traders to quickly see when market conditions are bullish, bearish, or neutral. A signal is generated only when the selected strategies are aligned, helping reduce noise and improve decision-making. PLEASE CONTACT ME AFTER PURCHASE TO GET
Gann Made Easy
Oleg Rodin
4.83 (163)
Gann Made Easy is a professional and easy to use Forex trading system which is based on the best principles of trading using the theory of W.D. Gann. The indicator provides accurate BUY and SELL signals including Stop Loss and Take Profit levels. You can trade even on the go using PUSH notifications. PLEASE CONTACT ME AFTER PURCHASE TO GET TRADING  INSTRUCTIONS AND GREAT EXTRA INDICATORS   FOR FREE! Probably you already heard about the Gann trading methods before. Usually the Gann theory is a ve
The Propfolio Master Suite is the ultimate all-in-one analytical workstation for professional traders. Combining the power of the Beat The Market Maker (BTMM) methodology, Smart Money Concepts (SND/Liquidity), and Advanced Volume Profile, this suite replaces multiple different indicators with one optimized engine. Monitor up to 14 pairs simultaneously from a single chart, instantly identify market cycles, and seamlessly map institutional footprints with the click of a button. The Command Center
Scalper Inside PRO
Alexey Minkov
4.74 (69)
Scalper Inside PRO Scalper Inside PRO is an intraday trend and scalping indicator for MetaTrader 4 that uses an exclusive algorithm to quickly detect market direction and key target levels. It automatically calculates entry, exit and multiple profit targets, and shows detailed performance statistics so you can see how different instruments and strategies performed. This helps you choose the most suitable trading instruments for the current market conditions. Additionally, you can easily integrat
M1 Sniper
Oleg Rodin
5 (23)
M1 SNIPER is an easy to use trading indicator system. It is an arrow indicator which is designed for M1 time frame. The indicator can be used as a standalone system for scalping on M1 time frame and it can be used as a part of your existing trading system. Though this trading system was designed specifically for trading on M1, it still can be used with other time frames too. Originally I designed this method for trading XAUUSD and BTCUSD. But I find this method helpful in trading other markets a
PRO Renko System
Oleg Rodin
5 (30)
PRO Renko System is a highly accurate trading system specially designed for trading RENKO charts. The ARROWS and Trend Indicators DO NOT REPAINT! The system effectively neutralizes so called market noise giving you access to accurate reversal signals. The indicator is very easy to use and has only one parameter responsible for signal generation. You can easily adapt the tool to any trading instrument of your choice and the size of the renko bar. I am always ready to provide extra support to help
Auto Optimized Parabolic RSI: Advanced 3D Momentum Engine Most retail indicators fail because they rely on static inputs that break the moment market volatility shifts. Auto Optimized Parabolic RSI solves the problem of "indicator decay" by continuously recalculating its own mathematical edge, bringing institutional-grade quantitative adaptation directly to your MT5 terminal. The Core Advantage: Custom In-Memory 3D Optimization   Standard auto-optimizers often freeze the MT5 platform because the
NAM Order Blocks
NAM TECH GROUP, CORP.
3.67 (3)
MT4 Multi-timeframe Order Blocks detection indicator. Features - Fully customizable on chart control panel, provides complete interaction. - Hide and show control panel wherever you want. - Detect OBs on multiple timeframes. - Select OBs quantity to display. - Different OBs user interface. - Different filters on OBs. - OB proximity alert. - ADR High and Low lines. - Notification service (Screen alerts | Push notifications). Summary Order block is a market behavior that indicates order collection
First of all Its worth emphasizing here that this Trading Tool is Non-Repainting Non-Redrawing and Non-Lagging Indicator Which makes it ideal for professional trading . [Online course] ,   and   [manual] The Smart Price Action Concepts Indicator is a very powerful tool for both new and experienced traders . It packs more than 20 useful indicators into one combining advanced trading ideas like Inner Circle Trader Analysis and Smart Money Concepts Trading Strategies . This indicator focuses on Sm
Quants HL Break
Ferhat Mutlu
5 (2)
Advanced calculation made by pure price action to find LH and HL breakouts. It will give you a great reversal points in the market. LH and HL signals can used for the traingle breakouts as well. Once breakout happens its indicate strong reversal. Nice filter for Moving Averages. I highly suggest to use that with trend indicators. Can be used as an extra confirmation for support and resistance , supply demand indicators. The indicator is not repainting. Buffers :   SetIndexBuffer ( 0 ,UpBar);
Dynamic Forex28 Navigator
Bernhard Schweigert
4.43 (7)
Specials Discount now. The Next Generation Forex Trading Tool. Dynamic Forex28 Navigator is the evolution of our long-time, popular indicators, combining the power of three into one: Advanced Currency Strength28 Indicator (695 reviews) + Advanced Currency IMPULSE with ALERT (520 reviews) + CS28 Combo Signals (recent Bonus) Details about the indicator  https://www.mql5.com/en/blogs/post/758844 What Does The Next-Generation Strength Indicator Offer? Everything you loved about the originals, now
PZ Harmonacci Patterns
PZ TRADING SLU
3.17 (6)
Trade smarter, not harder: Empower your trading with Harmonacci Patterns This is arguably the most complete harmonic price formation auto-recognition indicator you can find for the MetaTrader Platform. It detects 19 different patterns, takes fibonacci projections as seriously as you do, displays the Potential Reversal Zone (PRZ) and finds suitable stop-loss and take-profit levels. [ Installation Guide | Update Guide | Troubleshooting | FAQ | All Products  ] It detects 19 different harmonic pric
RFI levels PRO
Roman Podpora
5 (1)
The indicator accurately shows the reversal points and price return zones where the   Major players . You see where new trends are forming and make decisions with maximum precision, maintaining control over every trade. VERSION MT5     -     Reveals its maximum potential when combined with the   TREND LINES PRO   indicator What the indicator shows: Reversal structures and reversal levels with activation at the beginning of a new trend. Display of   TAKE PROFIT   and   STOP LOSS   levels with mi
Trend Catcher ind
Ramil Minniakhmetov
TREND CATCHER INDICATOR Trend Catcher Indicator analyzes market price movements, using a combination of the author’s proprietary and customized adaptive trend-analysis indicators.  It identifies the true market direction by filtering out short-term noise and focusing on underlying momentum strength, volatility expansion, and price structure behavior.  It also uses a combination of smoothing and trend-filtering customized indicators such as moving averages, RSI, and volatility filters.   Real ope
Apollo SR Master is a Support/Resistance indicator with special features which make trading with Support/Resistance zones easier and more reliable. The indicator calculates Support/Resistance zones in real-time without any time lag by detecting local price tops and bottoms. Then to confirm the newly formed SR area, the indicator shows special signal which signalizes that the SR zone can be taken into consideration and used as an actual SELL or BUY signal. In this case the strength of the SR zone
Grabber System
Ihor Otkydach
5 (2)
Let me introduce you to an excellent technical indicator – Grabber, which works as a ready-to-use "All-Inclusive" trading strategy. Within a single code, it integrates powerful tools for technical market analysis, trading signals (arrows), alert functions, and push notifications. Every buyer of this indicator also receives the following for free: Grabber Utility for automatic management of open orders Step-by-step video guide: how to install, configure, and trade with the indicator Custom set fi
Advanced Supply Demand
Bernhard Schweigert
4.91 (300)
Trading Special – 40% OFF Best Solution for any Newbie or Expert Trader! This indicator is a unique, high quality and affordable trading tool because we have incorporated a number of proprietary features and a new formula. With this update, you will be able to show double timeframe zones. You will not only be able to show a higher TF but to show both, the chart TF, PLUS the higher TF: SHOWING NESTED ZONES. All Supply Demand traders will love it. :) Important Information Revealed Maximize the pot
GoldRush Trend Arrow Signal V1.6 The GoldRush Trend Arrow Signal indicator V1.6 continues to provide precise, real-time trend analysis tailored for high-speed, short-term scalpers in XAU/USD , but it now has additional features and improved efficiency and reliability. Built specifically for the 1-minute time frame, this tool displays directional arrows for clear entry points, allowing scalpers to navigate volatile market conditions with confidence. The indicator consists of PRIMARY and SECONDARY
Introduction to Fractal Pattern Scanner Fractal Indicator refers to the technical indicator that makes use of the fractal geometry found in the financial market. Fractal Pattern Scanner is the advanced Fractal Indicator that brings the latest trading technology after the extensive research and development work in the fractal geometry in the financial market. The most important feature in Fractal Pattern Scanner is the ability to measure the turning point probability as well as the trend probabi
Trading Special –40% OFF Best Solution for any Newbie or Expert Trader! This Indicator is a unique, high quality and affordable trading tool because we have incorporated a number of proprietary features and a new formula. With only ONE chart you can read Currency Strength for 28 Forex pairs! Imagine how your trading will improve because you are able to pinpoint the exact trigger point of a new trend or scalping opportunity? User manual: click here That's the first one, the original! Don't buy a
Cycle Sniper
Elmira Memish
4.39 (36)
Please contact us after your purchase and we will send you the complimentary indicators to complete the system Cycle Sniper is not a holy grail but when you use it in a system which is explained in the videos, you will feel the difference. If you are not willing to focus on the charts designed with Cycle Sniper and other free tools we provide, we recommend not buying this indicator. We recommend watching the videos about the indiactor and system before purchasing. Videos, settings  and descri
Market Structure Patterns MT4
Samuel Manoel De Souza
5 (18)
Market Structure Patterns   is an indicator based on   smart money concepts   that displays   SMC/ICT   elements that can take your trading decisions to the next level. Take advantage of the   alerts ,   push notifications   and   email messages   to keep informed from when an element is formed on the chart, the price crosses a level and/or enters in a box/zone. Developers can access the values of the elements of the indicator using the   global variables  what allows the automation of trading d
Advanced UT BOT ALERTS for MT4 Professional Multi-Filter Trend Detection System | Enhanced UT BOT Engine We only provide high-quality indicators.  Advanced UT BOT is built for professional use, featuring a stable signal logic and secure calculation process that prevents any delays or false updates. It does not repaint, redraw, remove, or modify past signals in any way. All BUY and SELL signals are generated only after the candle has closed , ensuring consistent accuracy and reliability. There is
Contact me after purchase to get Bonus EA based on this indicator. The Self Optimizing Double MA Strategy is a professional-grade trading tool designed to eliminate parameter guesswork. Powered by a built-in auto-optimization engine, it continuously adapts to shifting market conditions by simulating thousands of parameter combinations in the background to maintain a statistical edge. Instead of relying on static, outdated settings, the indicator dynamically updates its own logic to find the mos
Day Trader Master is a complete trading system for traders who prefer intraday trading. The system consists of two indicators. The main indicator is the one which is represented by arrows of two colors for BUY and SELL signals. This is the indicator which you actually pay for. I provide the second indicator to my clients absolutely for free. This second indicator is actually a good trend filter indicator which works with any time frame. THE INDICATORS DO NOT REPAINT AND DO NOT LAG! The system is
Candle Power Pro
Thushara Dissanayake
4.5 (8)
The   Candle Power Pro   is a sophisticated trading tool designed to decode   real volume pressure, tick data imbalances, and institutional order flow dynamics   by measuring the   battle between bull ticks and bear ticks   in real time. This indicator transforms raw   volume data into actionable insights , helping traders identify   Smart Money movements, liquidity hunts, and hidden market psychology   behind each price candle. By analyzing   buyer/seller volume percentages, divergence pattern
If you trade Forex, having detailed information about the currency strength and currency pairs correlation can take your trading to new heights. The correlation will help to cut your risk in half, and strength analysis will help to maximize the profits. This indicator provides a hybrid approach for selecting the most appropriate currency pairs using the strength analysis and currency pairs correlation. How to use the Currency Strength Analysis Suppose your trading strategy provides a buying opp
CRT Candle Range Theory HTF MT4.   Ultimate CRT Indicator: Advanced ICT Concepts and Malaysian SnR Trading System Discounted   Price   $50  !!     Secure your lifetime access   now   before it switches to   subscription-only ! Master the Market Maker's Footprints with the Most Advanced Candle Range Theory Indicator Unlock the true power of   Smart Money Concepts (SMC)   and trade precisely like the institutions with the   Ultimate CRT Indicator . Built exclusively for serious traders, this indic
Route Lines Prices is an indicator designed for finding price directions. Its simple interface contains multiple algorithms for price behavior and future direction calculations. These algorithms include volatility calculations and price smoothing based on the timeframes used. The indicator has a single parameter for changing the " Calculating Price Values " value. The default value of 1 provides a balanced automatic calculation, which can be used without manually configuring the indicator. By m
KURAMA GOLD SIGNAL PRO (MT4) — Complete XAUUSD Trading System with 7-Layer Filter, Auto TP/SL, and Quality Scoring NON-REPAINTING. NON-REDRAWING. NON-LAGGING. Every signal is permanent. What you see is what you get. BONUS: Buy the lifetime license and receive AI Zone Radar ($59 value) + full PDF manual FREE. Message me after purchase. AI Zone Radar: https://www.mql5.com/en/market/product/175834 TRUSTED BY TRADERS: Already used by an active community of Gold traders. Praised for accuracy and
More from author
ST Rsi2
Curtis Daniel Jr -
5 (1)
Hello traders, this trading strategy is based on the the Larry Connors RSI-2 strategy, We begin with a 200 periods EMA to find the direction of the market. This is important because we only trade in the main trend direction. We then look for pull backs using the RSI with a period of 2 to get entry signals. Trades are then exited using the 5 EMA. Lot size should be calculated using 1% of 1 the ATR value and positions can be added as long as the entry criterion is met. TRADING IS RISKY AND I D
FREE
In a departure from the conventional approach, traders can leverage the bearish engulfing candlestick pattern as a buy signal for short-term mean reversion trades. Here's how this alternative strategy unfolds: The bearish engulfing pattern, (typically signaling a reversal of bullish momentum) , is interpreted differently in this context. Instead of viewing it as a precursor to further downward movement, we perceive it as an indication of a potential short-term bounce or mean reversion in prices.
FREE
ST Engulfing
Curtis Daniel Jr -
Engulfing candlestick patterns are   comprised of two bars on a price chart. They are used to indicate a market reversal. The second candlestick will be much larger than the first, so that it completely covers or 'engulfs' the length of the previous bar. By combining this with the ability to look at trend direction this indicator eliminates a lot of false signals that are normally generated if no overall trend is taken into consideration
FREE
TWJ Anchored VWAP
Curtis Daniel Jr -
1. Overview TWJ Anchored VWAP is a professional-grade MetaTrader 5 indicator that plots the Volume Weighted Average Price anchored to the open of each new trading day. The VWAP resets automatically at the start of every session, giving you a clean, accurate intraday reference price calculated from the true open of each day.   Unlike fixed or manually anchored VWAP tools, TWJ Anchored VWAP requires zero configuration to stay relevant — it handles the daily anchor logic automatically while giving
Velotrak Live Trade Tracking & Execution Dashboard for MetaTrader 5 1. Overview Velotrak is a real-time trade tracking and execution dashboard built as a MetaTrader 5 Expert Advisor. It overlays a fully featured panel on any chart, giving you an instant, always-visible view of your daily and lifetime trading performance — without automating any trades unless you explicitly activate the equity manager. Designed for prop firm traders, funded account holders, and disciplined retail traders who ne
Filter:
No reviews
Reply to review