Fluctuation Extreme Indicator
- Indicators
-
Yonggang Shang
 **********************************************************************
Join Channel: http://t.me/algo_forex_trading
********************************************************************** - Version: 1.30
- Updated: 30 December 2022
- Activations: 5
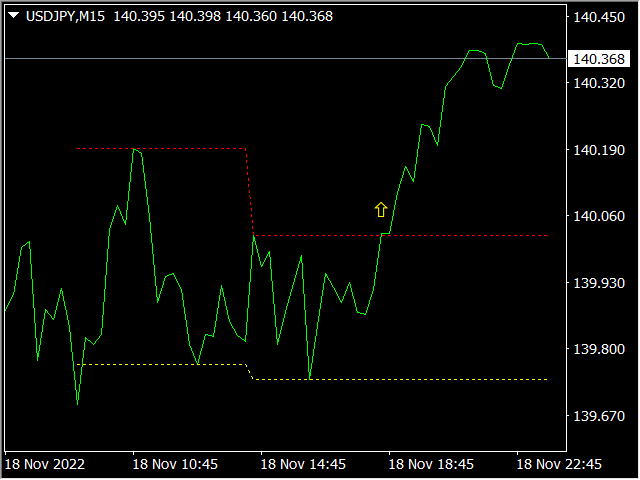
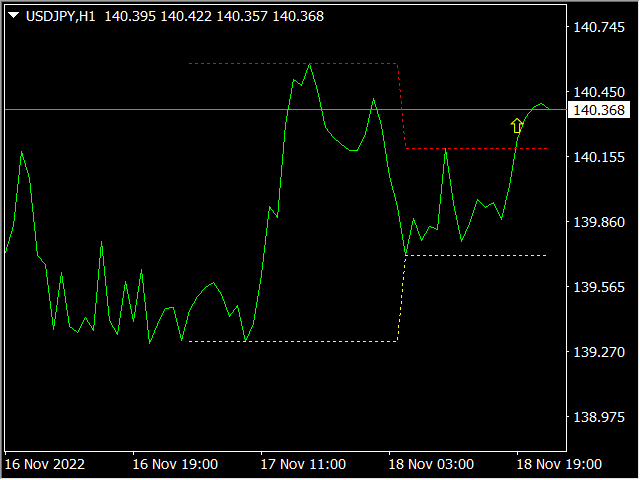
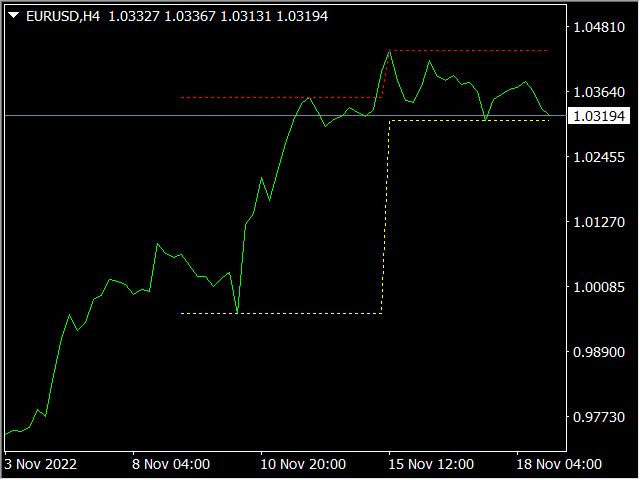
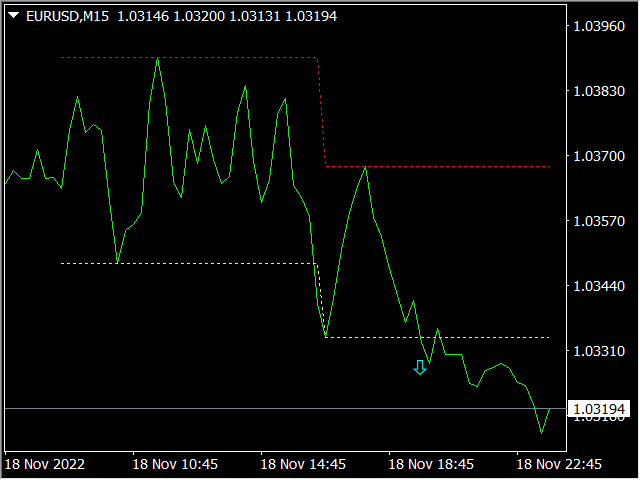
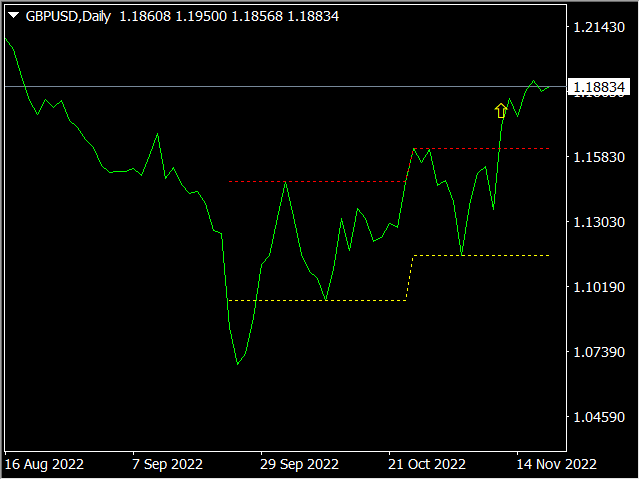
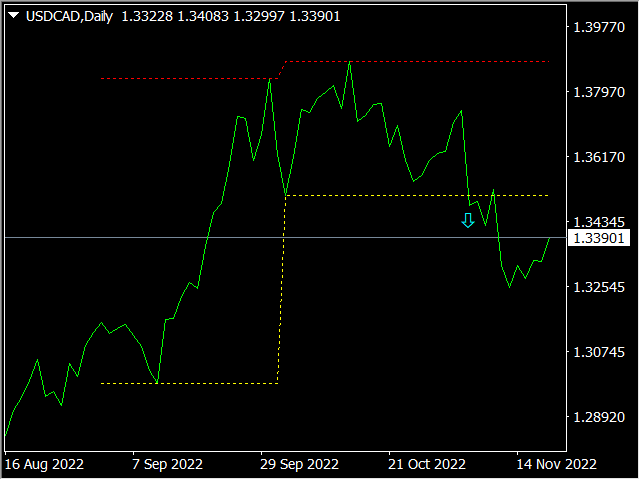
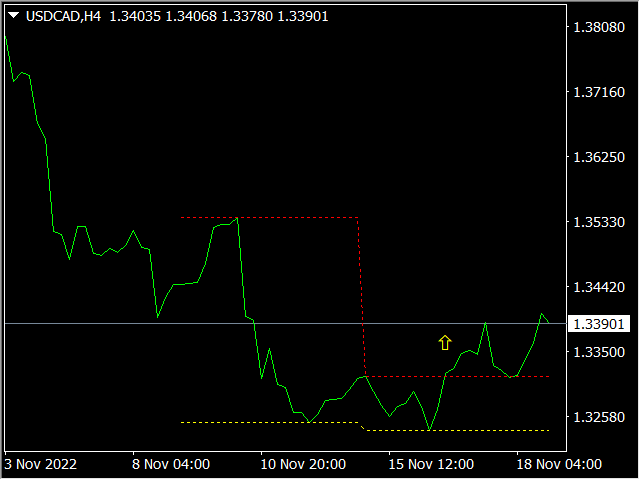
This is an MT4 indicator based on fluctuation statistics, which mainly includes two parts: one is display the fluctuation area, and the other is to display the signal at the same time if there is a signal generated.
Its main principle is to conduct data statistics based on the specified extreme value fluctuation radius, and draw the fluctuation area. If the breakthrough area is displayed, the signal in the same direction will be displayed.
Advantage:
- Suitable for all breeds.
- Applies to all cycles.
- With only one adjustable parameter, it is easy to use.
Input parameters:
- Fluctuation Extreme Radius: the radius of fluctuation extreme value, which counts the number of cycles used by the extreme value.
Notice:
- This indicator only provides fluctuation areas and breakthrough signals, and users can refer to their own analysis results and signal directions to place orders.
You can contact me if you have any questions, and I will reply to you in time. Thank you.
MQL5 Contact: https://www.mql5.com/zh/users/zhihui_dianjin
Contact me by telegram: https://t.me/ai_trade_best