SuperTrend Plus

5

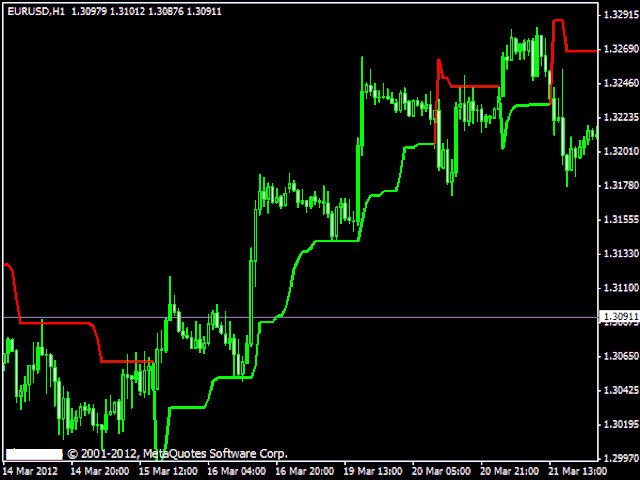
The Supertrend draws a line following the current trend..

  • Green Line under the candle means a likely bullish trend
  • Red Line above the candle means a likely bearish trend


How to trade with SuperTrend indicator

Buy when the Supertrend Green line is below the price, Sell when the Supertrend Red line is above the price. It is strongly suggested to use this indicator in a trending market.


    Parameters

    • Multiplier - the lower it is and the more sensitive is the line, meaning it will follow the price more closely
    • Period - Period of the ATR used for the calculation

    If you like this tool please take a minute to leave a review.

    Reviews 2
    Kedrov
    1251
    Kedrov 2024.02.13 10:30 
     

    Хороший индикатор! Спасибо!

    Recommended products
    Mr Beast Sniper
    Luis Mariano Vazquez Marcos
    5 (1)
    Asesor Experto "Sniper FX": Precisión Milimétrica para Tus Operaciones El asesor experto "Sniper FX" redefine la precisión en el trading automatizado al ofrecer un enfoque estratégico centrado en pocas, pero extraordinariamente precisas, entradas en el mercado. Inspirado por la agudeza de un francotirador, este asesor experto utiliza algoritmos avanzados para identificar oportunidades óptimas de compra y venta, maximizando el potencial de beneficios mientras minimiza la exposición al mercado.
    FREE
    RSI vs Envelopes
    Yurij Izyumov
    2 (2)
    This semaphore indicator is based in the standard RSI, which is applied over the Envelopes indicator that shows an envelope or envelope fluctuation borders. This is a version of RSI vs Envelopes Graph drawn in a separate window . A sell signal emerges when the upper envelope/border is broken by the RSI indicator from top to bottom. A buy signal emerges when the lower envelope/border is broken by the RSI indicator from bottom upwards. The indicator can draw arrows on the indicator, draw vertical
    FREE
    Trend Radar Chart Tracker
    Natasha Diedericks
    3 (2)
    Easily track and trade with the trend using this indicator. Uses a circle and line to indicate the trend direction. Excellent for channels. Features alert function. Parameter TrendPeriod can be changed to your preference. How to use: Simply attach to any chart. Blue circle plus blue line cross below price = Buy. Red circle plus red line  cross above price = Sell. Best results when taking higher time frames into consideration before entering a trade. (Hint: Wait for the radar/circle to appear on
    FREE
    Easy Channels
    Alexander Nikolaev
    4.5 (2)
    The indicator draws price channels. It can be customized so that only buy or sell channels are displayed. Also, trend lines can be displayed instead of channels. This indicator is easy to use, but nevertheless, there are many trading strategies based on channel trading. Advisor based on this indicator:  https://www.mql5.com/en/market/product/37952 Parameters History - maximum number of bars to build channels; Distance - minimum distance from one High (or Low) to another when constructing a chann
    FREE
    MQLTA Bollinger Bands Breakout Alert
    MQL4 Trading Automation
    3.75 (4)
    Bollinger Bands Breakout Alert is a simple indicator that can notify you when the price breaks out of the Bollinger Bands. You just need to set the parameters of the Bollinger Bands and how you want to be notified. Parameters: Indicator Name - is used for reference to know where the notifications are from Bands Period - is the period to use to calculate the Bollinger Bands Bands Shift - is the shift to use to calculate the Bollinger Bands Bands Deviation - is the deviation to use to calculate t
    FREE
    Ppr PA
    Yury Emeliyanov
    4.75 (4)
    "Ppr PA" is a unique technical indicator created to identify "PPR" patterns on the currency charts of the MT4 trading platform. These patterns can indicate possible reversals or continuation of the trend, providing traders with valuable signals to enter the market. Features: Automatic PPR Detection: The indicator automatically identifies and marks PPR patterns with arrows on the chart. Visual Signals: Green and red arrows indicate the optimal points for buying and selling, respectively. Arrow
    FREE
    This indicator for MT4 automatically draws support and resistance levels based on fractals, highlighting key areas of the market where the price could reverse or slow down. Fractals are graphical structures that identify significant highs and lows, thus forming a dynamic system of support and resistance levels. The indicator allows you to visualize these levels directly on the chart, facilitating technical analysis and identifying potential entry or exit points in the market. It is an ideal too
    FREE
    MACalcAuto MT4
    Tatiana Savkevych
    As you know, the main invariable indicator of all traders is the moving average; it is used in some way in most strategies. It is also obvious that this indicator is capable of showing good entries in every local area. For which it usually needs to be optimized or just visually adjusted. This development is intended for automatic optimization of the indicator. Once placed on the chart, the indicator will automatically re-optimize itself with the specified period ( PeriodReOptimization ) and dis
    PLEASE NOTE   You can  customize the settings of Fast EMA, Slow EMA, MACD SMA & Main SMA.  The accuracy will change as per your settings. 100% Non repaint indicator Pre-alert (get ready) signals Non-delay indications 24/7 signals 100% No lag No recalculating The arrows wont repaint even if the signal fails, or you refresh or restart the mt4 Indicator is based on simple crossover strategy of main line and signal line of MACD indicator in consideration with zero line and Main SMA.  The best thing
    FREE
    Signals and Alerts for Accelerator/Decelerator indicator based on these MQL5 posts: Accelerator Oscillator and Signals of the Indicator Accelerator Oscillator . Note : this tool is based on the code of Accelerator indicator developed by MetaQuotes Software Corp. Features The signals are triggered at   closing   of last bar/opening of a new bar; Any kind of alerts can be enabled: Dialog Box, Email message, SMS notifications for smartphones and tablets, and Sound alerts; Customizable arrows. By d
    FREE
    Ultimate Fractals MT4
    Wissam Hussein
    5 (3)
    This indicator is based on the famous fractal indicator but with much customization  and flexibility , this is a powerful tool for identifying trend reversals and maximizing your profit potential. With its advanced features and user-friendly interface, it's the ultimate choice for traders of all levels. MT5 Version :  Ultimate Fractals MT5 Features :  Customizable Fractal Candle count. Reversal Lines. Customizable Settings. User-Friendly Interface.  Main Parameters:  Candles On Left - number o
    FREE
    USDJPY Keltner Range M15 Strategy is a fully automated MetaTrader 5 strategy designed to capture structured breakout opportunities on USDJPY using daily directional confirmation, Keltner Channel reference levels, volatility-buffered pending STOP entries and simple fixed-risk management. The strategy is designed for USDJPY on the M15 timeframe. Its goal is to participate when the market shows directional intent through daily high or daily low behavior, while using Keltner Channel structure and
    FREE
    CCI Breakout SW
    Mohamed Hassan Mohamed Hassan Alsherbiny
    Probability emerges to record higher prices when Commodity Channel Index breaks out oscillator historical resistance level when exhibit overbought values. Since, oscillator breakout of support and resistance have similar effect as price breaks support and resistance levels, therefore, its highly advised to confirm price breakout with oscillator breakout; certainly, will have the same output in short trades. Concept is based on find swing levels which based on number of bars by each side of peak
    FREE
    This expert advisor implements the original Dennis and Eckhardt trading system, commonly known as The Turtle Trader. It trades exactly like the original turtles did, and can be used by experienced traders to capture trends in up or down markets. [ Installation Guide | Update Guide | Troubleshooting | FAQ | All Products  |  Get Help ] Easy to use and supervise Fully configurable strategy settings Fully configurable trading settings Works for ECN/Non-ECN brokers and 2-3-4-5 digit symbols Works f
    FREE
    Monitors the current trend, gives signals for an uptrend, downtrend and weakening of the current trend. Colors the situation on the market with the appropriate color. Tool - any. Timeframe - any. Advantages The indicator does not repaint its signals. There are alert signals. Easy to use. Flexible settings. Suitable for trading any financial instruments. Settings Name Description Fast parameter The value of the fast parameter in the indicator (Should be less than the slow one). Slow parameter The
    FREE
    StrikePin
    Mike Pascal Plavonil
    1 (1)
    The StrikePin indicator is a technical, analytical tool designed to identify trend reversals and find optimal market entries.  The StrikePin indicator is based on the pin bar pattern, which is the Price Action reversal pattern. An entry signal, in a trending market, can offer a very high-probability entry and a good risk to reward scenario. Be careful: the indicator is repainting since it is looking for highest high and lowest lows.  You should avoid to use it in experts but you can use it in
    FREE
    Fractal Divergence Channel is based on the fractal divergence patterns , representing them in the form of a channel with the borders changing the moment the next pattern appears. The upper border of the channel corresponds to the upper part of the last found bearish fractal divergence pattern. The lower border of the channel is the lower part of the last found bullish pattern (see screenshot 1). Compared to the FractalDivergence_Patterns indicator, the channel version has the same parameters wit
    FREE
    VHP channel PRT
    Irina Cherkashina
    This channel is based on the Hodrick-Prescott filter, which is a type of zero-lag digital filter. First, filtered Close price values are calculated. Then, a second filtering with a longer period is applied. This results in two arrays: HP and HPSlow. In the next step, the standard deviation of HP relative to HPSlow is computed, and a channel is constructed.   The VHP channel PRT indicator displays the average spread value and the channel width relative to HPSlow (expressed as a percentage) at th
    FREE
    Comb
    Iurii Tokman
    The indicator displays a grid in the form of a "honeycomb" or regular hexagon. An alternative to the standard grid of the terminal. Description of the indicator settings: color_comb - grid color width - width, for example: 22 for a screen resolution of 1920*1080, 15 for a screen resolution of 1366*768, etc. height - height, for example: 6 for a screen resolution of 1920*1080, 4 for a screen resolution of 1366*768, etc.
    FREE
    Break Lines
    Alexander Nikolaev
    4.67 (3)
    The indicator draws lines the the price highs and lows. Break through the high or low usually indicates trend change (or continuation). Once the price moves through a line, and the candlestick closes, the indicator draws an appropriate arrow (also, you can enable alerts). A deal should be conducted in the breakthrough direction immediately or after a slight rollback. It is best to trade following the trend on a larger timeframe. This indicator is easy to use, but nevertheless, there are many tra
    FREE
    Wise Men Indicator demo
    Bohdan Kasyanenko
    3 (2)
    The indicator displays signals according to the strategy of Bill Williams on the chart. Demo version of the indicator has the same features as the paid, except that it can work only on a demo account . Signal "First Wise Man" is formed when there is a divergent bar with angulation.  Bullish divergent bar - with lower minimum and closing price in the upper half. Bearish divergent bar - higher maximum and the closing price at the bottom half. Angulation is formed when all three lines of Alligator
    FREE
    PZ Stretch
    PZ TRADING SLU
    The Stretch is a Toby Crabel  price pattern which represents the minimum average price movement/deviation from the open price during a period of time, and is used to calculate two breakout levels for every single trading day. It is calculated by taking the 10 period SMA of the absolute difference between the open and either the high or low, whichever difference is smaller. This value is used to calculate breakout thresholds for the current trading session, which are displayed in the indicator as
    FREE
    BBWidth 3Lines
    Etsushi Ishizuka
    Overview BBWidth 3Lines is a custom indicator that visualizes the width between the upper and lower Bollinger Bands (i.e., +σ minus −σ) as a line in a separate subwindow. The value is expressed in points, not in price. While conventional Bollinger Bands are often used to assess price deviation or band touch, this tool focuses exclusively on the width of the bands , allowing you to analyze market volatility visually and precisely. Key Features Displays the difference between the upper and lower B
    FREE
    Fakey Detector — False Breakout (Fakey) Indicator Fakey Detector is an indicator that automatically detects the classic Fakey pattern (false breakout of an inside bar) from Price Action and displays it on the chart using an arrow and breakout level. How it works: The Fakey pattern consists of three candles: Mother Bar — the largest by range Inside Bar — fully contained within the Mother Bar's range Fakey Candle — breaks out (up or down), but then closes back inside the range The indicator
    FREE
    Fractals Dynamic Fractals Dynamic   – is a modified free fractal indicator by Bill Williams, in which you can manually set the number of bars on the left and right, thereby building unique patterns on the chart. Now all trading strategies based on or based on the Fractals Dynamic indicator will have an additional signal. In addition, fractals can act as support and resistance levels. And in some trading strategies, show liquidity levels. For this purpose, levels were introduced in this version
    FREE
    What is Schaff Trend Cycle? The Schaff Trend Cycle (STC) is an oscillator-type indicator designed to detect trend reversals in a timely manner. Compared to traditional indicators like moving averages or MACD, it combines cyclical patterns with momentum to more clearly identify the beginning and end of trends. Main Features Clear trend reversal signals: The cycle line rises in an uptrend and falls in a downtrend. Noise reduction in ranging markets: Smoothing based on cyclical timing helps filter
    FREE
    This semaphore indicator is based in the standard RSI, which is applied over the Envelopes indicator that shows an envelope or envelope fluctuation borders. This is a version of RSI vs Envelopes drawn in the symbol window . A sell signal emerges when the upper envelope/border is broken by the RSI indicator from top to bottom. A buy signal emerges when the lower envelope/border is broken by the RSI indicator from bottom upwards. The indicator can draw arrows on the indicator, draw vertical lines
    FREE
    WPR Breakout MT4
    Mohamed Hassan Mohamed Hassan Alsherbiny
    When prices breakout resistance levels are combined with   Larry Williams' Percentage Range "WPR"   oscillator breaks out its historical resistance levels then probability emerges to record farther prices.   It's strongly encouraged to confirm price breakout with oscillator breakout since they have comparable effects to price breaking support and resistance levels; surely, short trades will have the same perception. Concept is based on find swing levels which based on number of bars by each side
    FREE
    Sure Reverse Channel
    Abdulkarim Karazon
    5 (3)
    The Sure Reverse Channel is a dynamic non repaint trend indicator with entry arrows, the indicator focuses on catching a reverse swing in the market by using channel and price action formula, the indicator comes with built-in money management . HOW TO TRADE : Open buy trade when buy arrow pops up and set your SL below arrow, for TP you have TP  which is opposite band. Open sell trade when sell arrow pops up and set your SL above arrow,   for TP you have TP  which is opposite band. band. Why is
    FREE
    Price Ladder
    Kourosh Hossein Davallou
    This indicator is based on the Channel . Input Parameters channel_One- show trend line One on or off. timeFrame_One - time Frame of channel One . ColorChannel_One - color of  trend line One. channel_Two- show trend line Two on or off. timeFrame_Two - time Frame of channel Two . ColorChannel_Two - color of  trend line Two. channel_Three- show trend line Three on or off. timeFrame_Three - time Frame of channel Three . ColorChannel_Three - color of  trend line three. channel_Four- show trend line F
    FREE
    Buyers of this product also purchase
    Neuro Poseidon MT4
    Daria Rezueva
    4.94 (34)
    Neuro Poseidon is a new indicator by Daria Rezueva. It combines precise trading signals with adaptive TP/SL levels - creating best possible trades as a result! Message me and get  Neuro Poseidon Assistant  as a gift to automize your trading process! What makes it stand out? 1. Proven profitability on all assets and timeframes 2. Only confirmed BUY and SELL signals present on the chart 3. Adaptive TP & SL levels generated by the software for each trade 4. Easy to understand - suitable for all
    Gann Made Easy
    Oleg Rodin
    4.84 (165)
    Gann Made Easy is a professional and easy to use Forex trading system which is based on the best principles of trading using the theory of W.D. Gann. The indicator provides accurate BUY and SELL signals including Stop Loss and Take Profit levels. You can trade even on the go using PUSH notifications. PLEASE CONTACT ME AFTER PURCHASE TO GET TRADING  INSTRUCTIONS AND GREAT EXTRA INDICATORS   FOR FREE! Probably you already heard about the Gann trading methods before. Usually the Gann theory is a ve
    M1 Sniper
    Oleg Rodin
    5 (24)
    M1 SNIPER is an easy to use trading indicator system. It is an arrow indicator which is designed for M1 time frame. The indicator can be used as a standalone system for scalping on M1 time frame and it can be used as a part of your existing trading system. Though this trading system was designed specifically for trading on M1, it still can be used with other time frames too. Originally I designed this method for trading XAUUSD and BTCUSD. But I find this method helpful in trading other markets a
    Trend Catcher ind
    Ramil Minniakhmetov
    5 (2)
    TREND CATCHER INDICATOR Trend Catcher Indicator analyzes market price movements, using a combination of the author’s proprietary and customized adaptive trend-analysis indicators.  It identifies the true market direction by filtering out short-term noise and focusing on underlying momentum strength, volatility expansion, and price structure behavior.  It also uses a combination of smoothing and trend-filtering customized indicators such as moving averages, RSI, and volatility filters.   Real ope
    This indicator is an indicator for automatic wave analysis that is perfect for practical trading! Case... Note:   I am not used to the Western name for wave classification. Influenced by the naming habit of Chaos Theory (Chanzhongshuochan), I named the basic wave as   pen   , the secondary wave band as   segment   , and the segment with trend direction   as main trend segment   (this naming method will be used in future notes, let me tell you in advance), but the algorithm is not closely relate
    Scalper Inside PRO
    Alexey Minkov
    4.74 (68)
    Scalper Inside PRO Scalper Inside PRO is an intraday trend and scalping indicator for MetaTrader 4 that uses an exclusive algorithm to quickly detect market direction and key target levels. It automatically calculates entry, exit and multiple profit targets, and shows detailed performance statistics so you can see how different instruments and strategies performed. This helps you choose the most suitable trading instruments for the current market conditions. Additionally, you can easily integrat
    Breakout Arrows Mt4
    Michael Oko Oboh
    5 (1)
    Trend Breakout Arrows Indicator The Trend Breakout Arrows Indicator is a momentum-based signal tool designed to identify potential bullish and bearish breakout opportunities. It displays clear arrow signals directly on the price chart, helping traders quickly recognize possible trend changes and continuation setups. Up Arrow (Buy Signal) A magenta up arrow appears below a candle when bullish momentum begins to strengthen. This signal indicates that buying pressure may be overtaking selling press
    PRO Renko System
    Oleg Rodin
    5 (30)
    PRO Renko System is a highly accurate trading system specially designed for trading RENKO charts. The ARROWS and Trend Indicators DO NOT REPAINT! The system effectively neutralizes so called market noise giving you access to accurate reversal signals. The indicator is very easy to use and has only one parameter responsible for signal generation. You can easily adapt the tool to any trading instrument of your choice and the size of the renko bar. I am always ready to provide extra support to help
    Current event:  https://c.mql5.com/1/326/A2SR2025_NoMusic.gif A. What is A2SR ?   * It's a leading technical indicator (no repaint, no lagging). -- Guidance : -- at   https://www.mql5.com/en/blogs/post/734748/page4#comment_16532516 -- and  https://www.mql5.com/en/users/yohana/blog A2SR has a special technique in determining the levels of Support ( demand ) and Resistance ( supply ) . Unlike the ordinary way that we seen on the net, A2SR has a original concept in determining actual SR levels.
    Advanced Supply Demand
    Bernhard Schweigert
    4.91 (300)
    Trading Special – 30% OFF Best Solution for any Newbie or Expert Trader! This indicator is a unique, high quality and affordable trading tool because we have incorporated a number of proprietary features and a new formula. With this update, you will be able to show double timeframe zones. You will not only be able to show a higher TF but to show both, the chart TF, PLUS the higher TF: SHOWING NESTED ZONES. All Supply Demand traders will love it. :) Important Information Revealed Maximize the pot
    MetaBands M4
    Vahidreza Heidar Gholami
    3.5 (6)
    MetaBands uses powerful and unique algorithms to draw channels and detect trends so that it can provide traders with potential points for entering and exiting trades. It’s a channel indicator plus a powerful trend indicator. It includes different types of channels which can be merged to create new channels simply by using the input parameters. MetaBands uses all types of alerts to notify users about market events. Features Supports most of the channel algorithms Powerful trend detection algorith
    Genesis Matrix Pro is a professional multi-timeframe trend detection indicator designed to help traders identify high-quality market alignment with clarity and structure. It combines 12 different technical indicators into one visual alignment matrix, allowing traders to quickly see when market conditions are bullish, bearish, or neutral. A signal is generated only when the selected strategies are aligned, helping reduce noise and improve decision-making. PLEASE CONTACT ME AFTER PURCHASE TO GET
    This product was   updated   for the   2026 market   and   optimized   for the   latest MT5 builds . PRICE UPDATE NOTICE: Smart Trend Trading System   is currently available for $99. The price will   increase to $199   after the next   30 purchases. SPECIAL OFFER:  After purchasing Smart Trend Trading System, send me a private message to claim the Smart Universal EA for FREE and turn your Smart Trend signals into automated trades. Smart Trend Trading System is a complete non-repainting, non-re
    Dynamic Forex28 Navigator
    Bernhard Schweigert
    4.43 (7)
    Specials Discount now. The Next Generation Forex Trading Tool. Dynamic Forex28 Navigator is the evolution of our long-time, popular indicators, combining the power of three into one: Advanced Currency Strength28 Indicator (695 reviews) + Advanced Currency IMPULSE with ALERT (520 reviews) + CS28 Combo Signals (recent Bonus) Details about the indicator  https://www.mql5.com/en/blogs/post/758844 What Does The Next-Generation Strength Indicator Offer? Everything you loved about the originals, now
    BTMM State Engine Pro is a MetaTrader 4 indicator for traders who use the Beat The Market Maker approach: Asian session context, kill zone timing, level progression, peak formation detection, and a multi-pair scanner from a single chart. It combines cycle state logic with a built-in scanner dashboard so you do not need the same tool on many charts at once. What it does Draws the Asian session range; session times can follow broker server offset or be set in inputs. Tracks level progression (L
    IQ FX Gann Levels a precision trading indicator based on W.D. Gann’s square root methods . It plots real-time, non-repainting support and resistance levels to help traders confidently spot intraday and scalping opportunities with high accuracy. William Delbert Gann (W.D. Gann) was an exceptional market analyst, whose trading technique was based on a complex blend of mathematics, geometry, astrology, and ancient mathematics which proved to be extremely accurate. Setup & Guide:  Download  MT5 Ver
    PZ Swing Trading
    PZ TRADING SLU
    5 (3)
    Protect against whipsaws: revolutionize your swing trading approach Swing Trading is the first indicator designed to detect swings in the direction of the trend and possible reversal swings. It uses the baseline swing trading approach, widely described in trading literature. The indicator studies several price and time vectors to track the aggregate trend direction and detects situations in which the market is oversold or overbought and ready to correct. [ Installation Guide | Update Guide | Tro
    Neo Wave PRO
    Nikolay Raykov
    5 (1)
    Price & Time Market Structure Indicator A professional market structure tool that analyzes waves through both price and time — not price alone. Main Description NeoWave PRO is a professional market structure indicator for MetaTrader 4 designed for traders who want to move beyond traditional one-dimensional wave tools such as ZigZag, swing indicators, and basic high/low systems. Most wave indicators analyze only one thing: Price. But a real market wave is not only a price movement. A true wave de
    GOLD Impulse with Alert
    Bernhard Schweigert
    4.67 (12)
    This indicator is a super combination of our 2 products  Advanced Currency IMPULSE with ALERT  and  Currency Strength Exotics . It works for all time frames and shows graphically impulse of strength or weakness for the 8 main currencies plus one Symbol! This Indicator is specialized to show currency strength acceleration for any symbols like Gold, Exotic Pairs, Commodities, Indexes or Futures. Is first of its kind, any symbol can be added to the 9th line to show  true currency strength accelerat
    Market Structure Order Block Dashboard MT4 is a MetaTrader 4 indicator designed for traders who want to read market structure and the main price reaction zones directly on the chart. It combines BOS, ChoCH, Order Blocks, Fair Value Gaps (FVG), Liquidity, Kill Zones, Volume Profile, and a compact dashboard for quick analysis. This indicator is intended for traders who use market structure, ICT and Smart Money concepts as a decision framework. It can help spot trend continuations, possible reversa
    The " Dynamic Scalper System " indicator is designed for the scalping method of trading within trend waves. Tested on major currency pairs and gold, compatibility with other trading instruments is possible. Provides signals for short-term opening of positions along the trend with additional price movement support. The principle of the indicator. Large arrows determine the trend direction. An algorithm for generating signals for scalping in the form of small arrows operates within trend waves.
    An MT5 version is also available https://www.mql5.com/en/market/product/170916 M30/H1/H4 Swing Version Available Want to catch the big moves that M5/M15 can't reach? Gold Signal Swing Pro (M30/H1/H4) is now available. Target $20-$80+ per trade. https://www.mql5.com/en/market/product/177643 KURAMA GOLD SIGNAL PRO (MT4) — Complete XAUUSD Trading System with 7-Layer Filter, Auto TP/SL, and Quality Scoring NON-REPAINTING
    PZ 123 Pattern
    PZ TRADING SLU
    1 (1)
    Unlock powerful breakout opportunities The 123 Pattern is one of the most popular, powerful and flexible chart patterns. The pattern is made up of three price points: a bottom, a peak or valley, and a Fibonacci retracement between 38.2% and 71.8%. A pattern is considered valid when the price breaks beyond the last peak or valley, moment at which the indicator plots an arrow, rises an alert, and the trade can be placed. [ Installation Guide | Update Guide | Troubleshooting | FAQ | All Products  ]
    Enigmera
    Ivan Stefanov
    5 (8)
    ENIGMERA: The core of the market (This is a manual indicator and contains features that may not supported by the MetaTrader current testing environment) Introduction This indicator and trading system is a remarkable approach to the financial markets . ENIGMERA uses the fractal cycles to accurately calculate support and resistance levels. It shows the authentic accumulation phase and gives direction and targets.  A system that works whether we are in a trend or a correction.   How It Works Most
    The Seismograph Marketquake Detector . No matter way you trade, you definitely want to avoid entry in the low liquidity market. - The seismograph will help you the right time to enter the market before market rally. However, even though you have made sure to entry at market times that should be busy, the fact is that many people are often trapped in markets with low liquidity. After several hours of waiting, the market suddenly became busy, but... it turned out that many people were now in the
    Scalper Vault
    Oleg Rodin
    5 (37)
    Scalper Vault is a professional scalping system which provides you with everything you need for successful scalping. This indicator is a complete trading system which can be used by forex and binary options traders. The recommended time frame is M5. The system provides you with accurate arrow signals in the direction of the trend. It also provides you with top and bottom signals and Gann market levels. The indicator provides all types of alerts including PUSH notifications. PLEASE CONTACT ME AFT
    Introduction to Fractal Pattern Scanner Fractal Indicator refers to the technical indicator that makes use of the fractal geometry found in the financial market. Fractal Pattern Scanner is the advanced Fractal Indicator that brings the latest trading technology after the extensive research and development work in the fractal geometry in the financial market. The most important feature in Fractal Pattern Scanner is the ability to measure the turning point probability as well as the trend probabi
    Trend Lines PRO
    Roman Podpora
    5 (1)
    TREND LINES PRO    helps understand where the market is truly changing direction. The indicator shows real trend reversals and points where major players re-enter. You see   BOS lines   Trend changes and key levels on higher timeframes — without complex settings or unnecessary noise. Signals don't repaint and remain on the chart after the bar closes. VERSION MT 5     -     Reveals its maximum potential when paired with the   RFI LEVELS PRO  indicator What the indicator shows: Real shifts   tren
    The Propfolio Master Suite is the ultimate all-in-one analytical workstation for professional traders. Combining the power of the Beat The Market Maker (BTMM) methodology, Smart Money Concepts (SND/Liquidity), and Advanced Volume Profile, this suite replaces multiple different indicators with one optimized engine. Monitor up to 14 pairs simultaneously from a single chart, instantly identify market cycles, and seamlessly map institutional footprints with the click of a button. The Command Center
    RFI levels PRO
    Roman Podpora
    5 (1)
    The indicator accurately shows the reversal points and price return zones where the   Major players . You see where new trends are forming and make decisions with maximum precision, maintaining control over every trade. VERSION MT5     -     Reveals its maximum potential when combined with the   TREND LINES PRO   indicator What the indicator shows: Reversal structures and reversal levels with activation at the beginning of a new trend. Display of   TAKE PROFIT   and   STOP LOSS   levels with mi
    More from author
    MACD Candle Signal
    Jonathan Destailleur
    4.75 (4)
    The MACD Signal Candle indicator  changes color according to the MACD trends. Colored Candles, based on MACD. HOW IT WORKS For a Buy:  -If the indicator is above zero, the market is bullish. -If the market is bullish, you can take a stand with green candle signals. For a Sell: -If the indicator is below zero, the market is bearish. -If the market is bearish, you can take a stand with the red candles.
    FREE
    Donchian Channels Bands
    Jonathan Destailleur
    4.25 (4)
    Price Channels are also known as Donchian Channels being named after Richard Donchian.  They use the highest and lowest price of a set number of periods to create an upper and lower channel or envelope around the price. The upper channel shows the high of the number of periods chosen. The lower channel shows the low of the number of periods chosen. For example, the screenshot shows the Price Channels using 320 periods. The upper channel in the screenshot shows the highest high of the previous 3
    FREE
    RSI Candle Signal
    Jonathan Destailleur
    4.5 (2)
    RSI Candle Signal Indicator will change bars’ color when set overbought or oversold levels reach. How to Use RSI Candle Signal Uptrend/Downtrends  - RSI may be used to detect trending markets. For example, the RSI may stay above the mid line 50 in an uptrend. Top and Buttoms  - RSI may help in identifying the tops around the overbought readings (usually above 70), and the bottoms around the oversold area (usually below 30). Divergence  - divergence occurs when RSI directional movement is not co
    FREE
    Yesterday High Low
    Jonathan Destailleur
    5 (2)
    The "Yesterday High Low" indicator for the MetaTrader 4 (MT4) trading platform is a powerful tool designed to help traders identify key price levels from the previous trading day. This indicator provides a visual representation of the high prices, low prices, high/low price averages, and intermediate average levels on the chart. Primarily used by institutional and professional traders, this indicator offers an instant view of price levels that are often considered crucial in financial markets.
    FREE
    AO Signal Candle
    Jonathan Destailleur
    The  Awesome Oscillator  (AO)  Signal Candle Indicator  is an indicator used to measure market momentum.  Awesome Oscillator  (AO)  Signal Candle Indicator  will change bar's color when set overbought or oversold levels reach. Colored Candles, based on Awesome Oscillator (AO) Signal. -If the indicator is above zero, the market is bullish. -If the indicator is below zero, the market is bearish. -If the market is bullish, you can take a stand with green candle signals. -If the market is bearish,
    FREE
    Filter:
    Kedrov
    1251
    Kedrov 2024.02.13 10:30 
     

    Хороший индикатор! Спасибо!

    frank75
    148
    frank75 2020.08.13 10:54 
     

    User didn't leave any comment to the rating

    Reply to review