SuperTrend Plus
- Indikatoren
- Version: 1.0

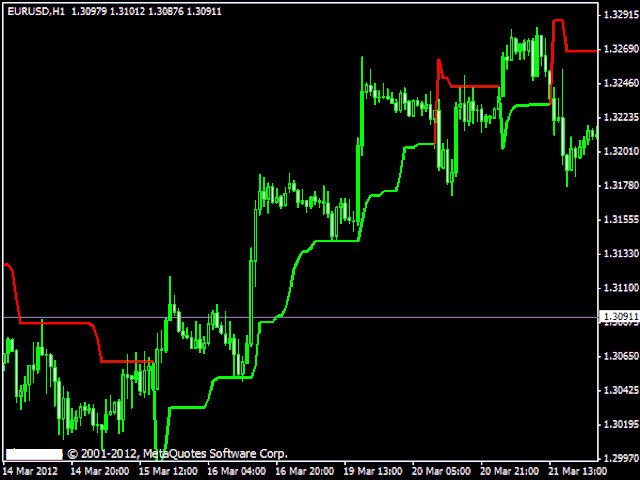
Der Supertrend zeichnet eine Linie, die dem aktuellen Trend folgt.
- Die grüne Linie unter der Kerze bedeutet einen wahrscheinlichen Aufwärtstrend
- Rote Linie oberhalb der Kerze bedeutet einen wahrscheinlichen Abwärtstrend
So handeln Sie mit dem Supertrend-Indikator
Kaufen Sie, wenn die grüne Supertrend-Linie unter dem Preis liegt, verkaufen Sie, wenn die rote Supertrend-Linie über dem Preis liegt. Es wird dringend empfohlen, diesen Indikator in einem Trendmarkt zu verwenden.
Parameter
- Multiplikator - je niedriger er ist, desto empfindlicher ist die Linie, d.h. sie folgt dem Kurs stärker
- Periode - Periode der ATR, die für die Berechnung verwendet wird
Wenn Ihnen dieses Tool gefällt, nehmen Sie sich bitte eine Minute Zeit, um eine Bewertung zu hinterlassen.
Хороший индикатор! Спасибо!