Visual correlation
- Indicators
-
Andrey Tatarinov
 Robot for trading on news
https://www.mql5.com/en/market/product/10427
Trend Hunter indicator with the ability to send signals to Telegram - Version: 2.0
- Updated: 13 November 2026
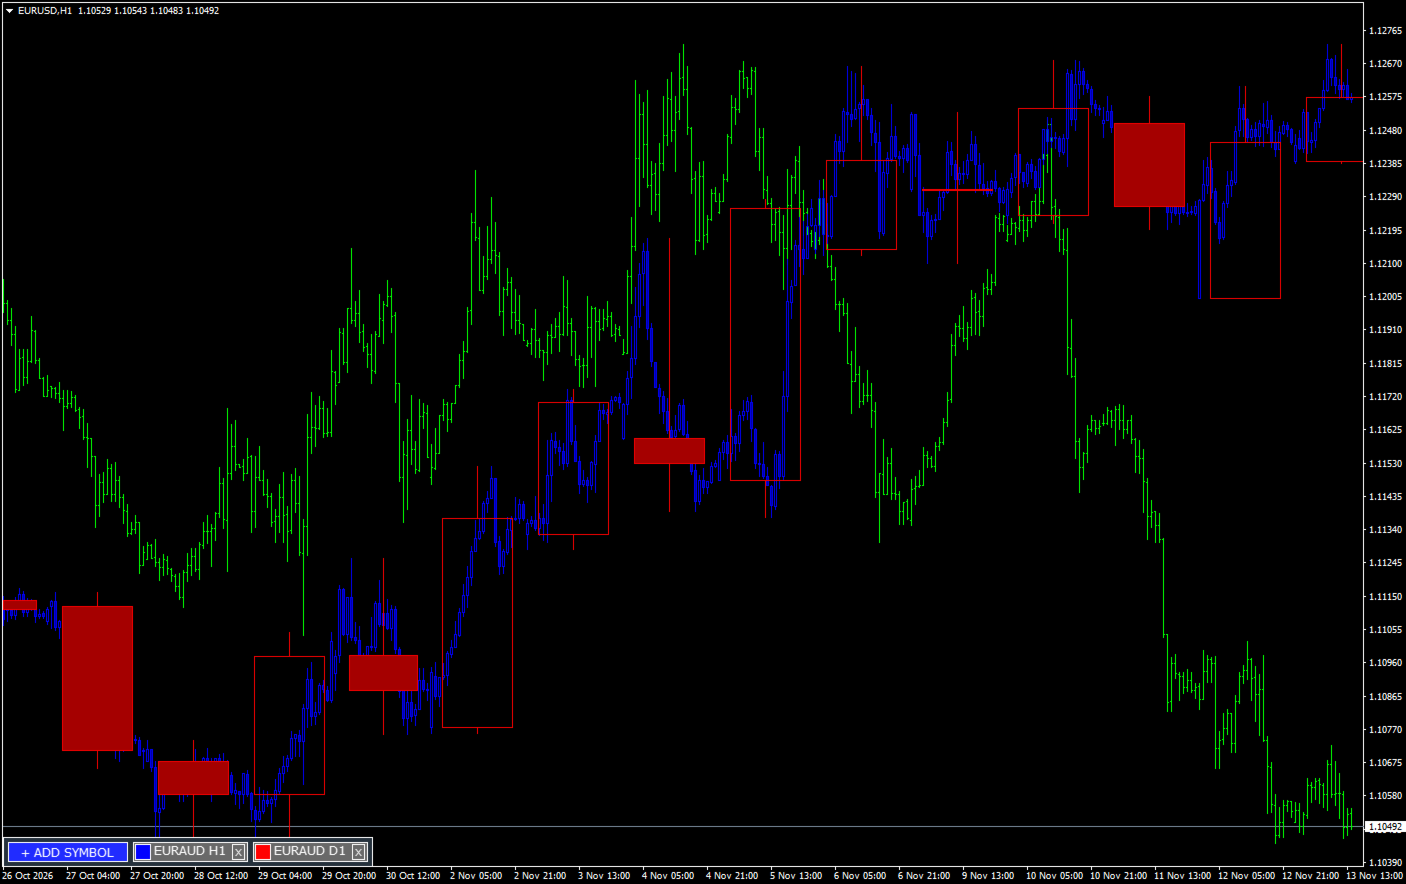
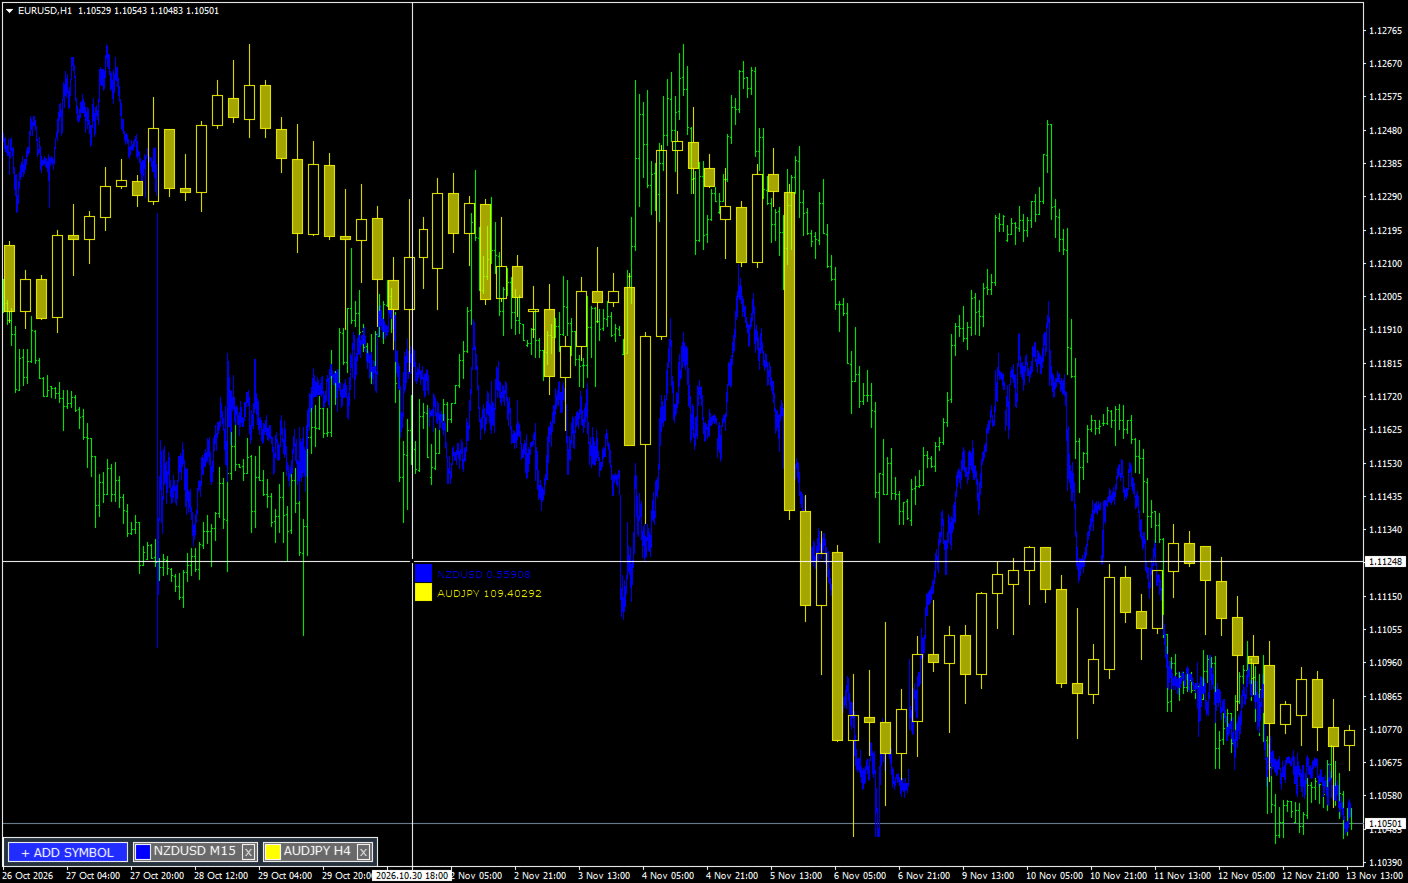
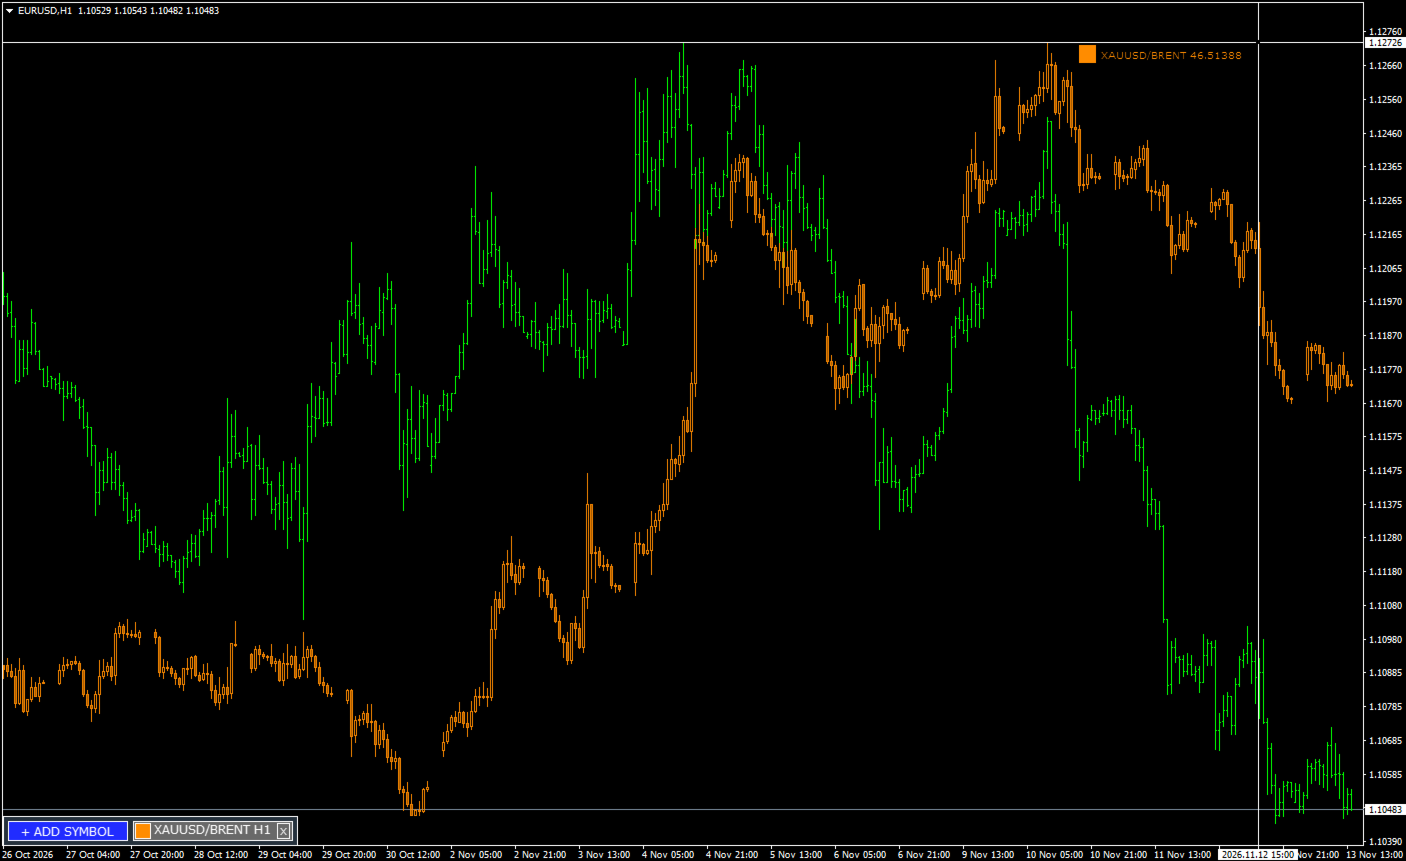
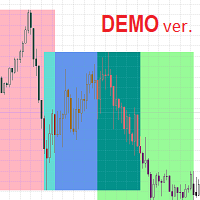
The behavior of different currency pairs is interconnected. The Visual Correlation indicator allows you to display various instruments on a single chart while maintaining their respective scales.
You can identify positive correlation, negative correlation, or the absence of any correlation.
Some instruments begin their movement earlier than others; such instances can be identified by overlaying their charts.
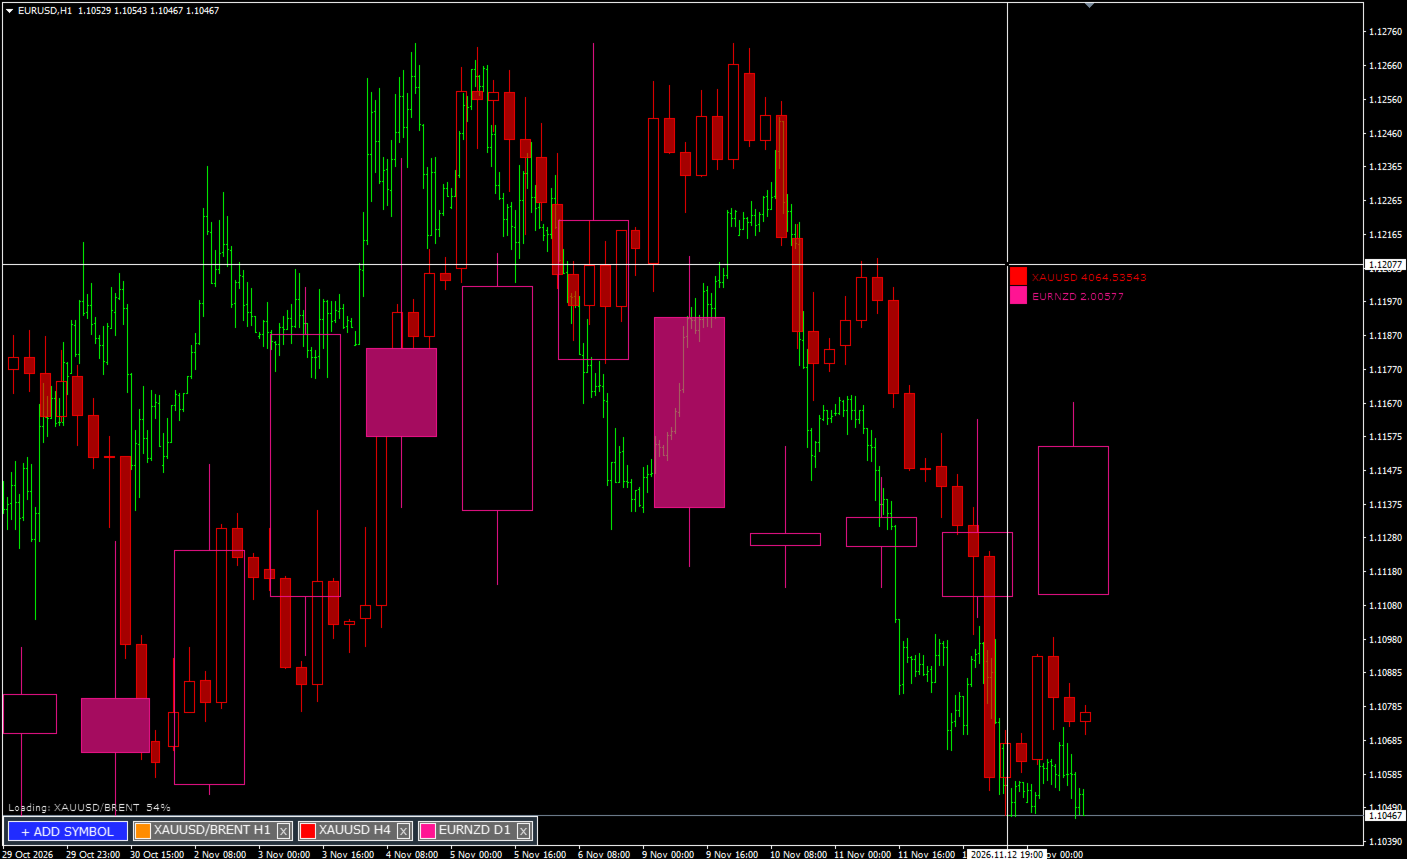
The indicator supports the display of up to 5 symbols on a single chart, with each symbol capable of being shown using its own specific timeframe.
Additionally, the indicator supports the display of synthetic symbols, which are derived from the quotes of two separate instruments.
The following operations are available for constructing such charts:
- division "/"
- multiplication "*"
- addition "+"
- subtraction "-"
For example, if you select gold (XAUUSD) as the first symbol and Brent crude oil as the second, the chart will display the price of an ounce of gold denominated in barrels of Brent oil.
This approach can be useful for unconventional analysis of financial instruments.
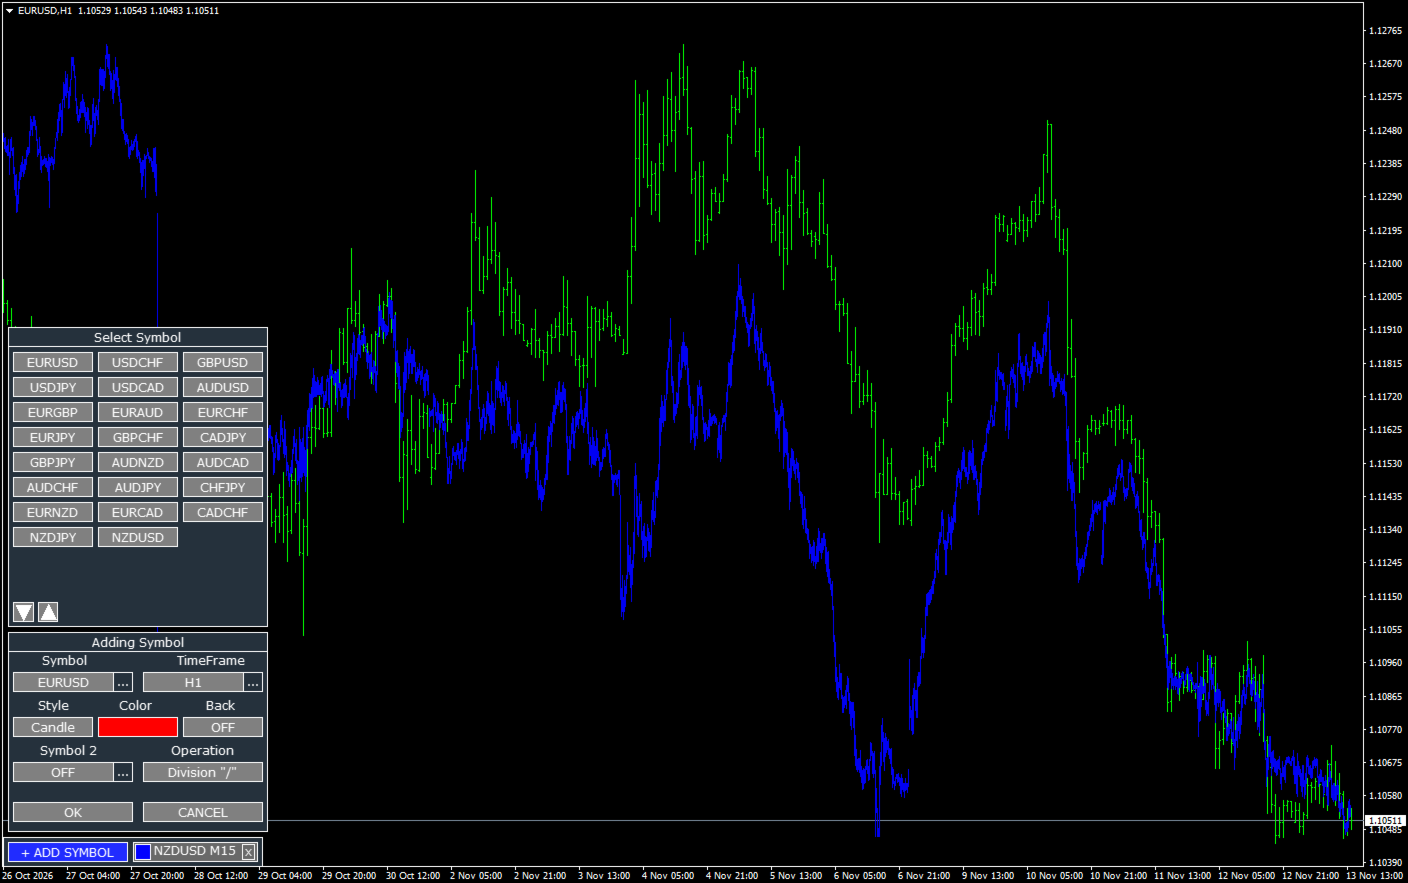
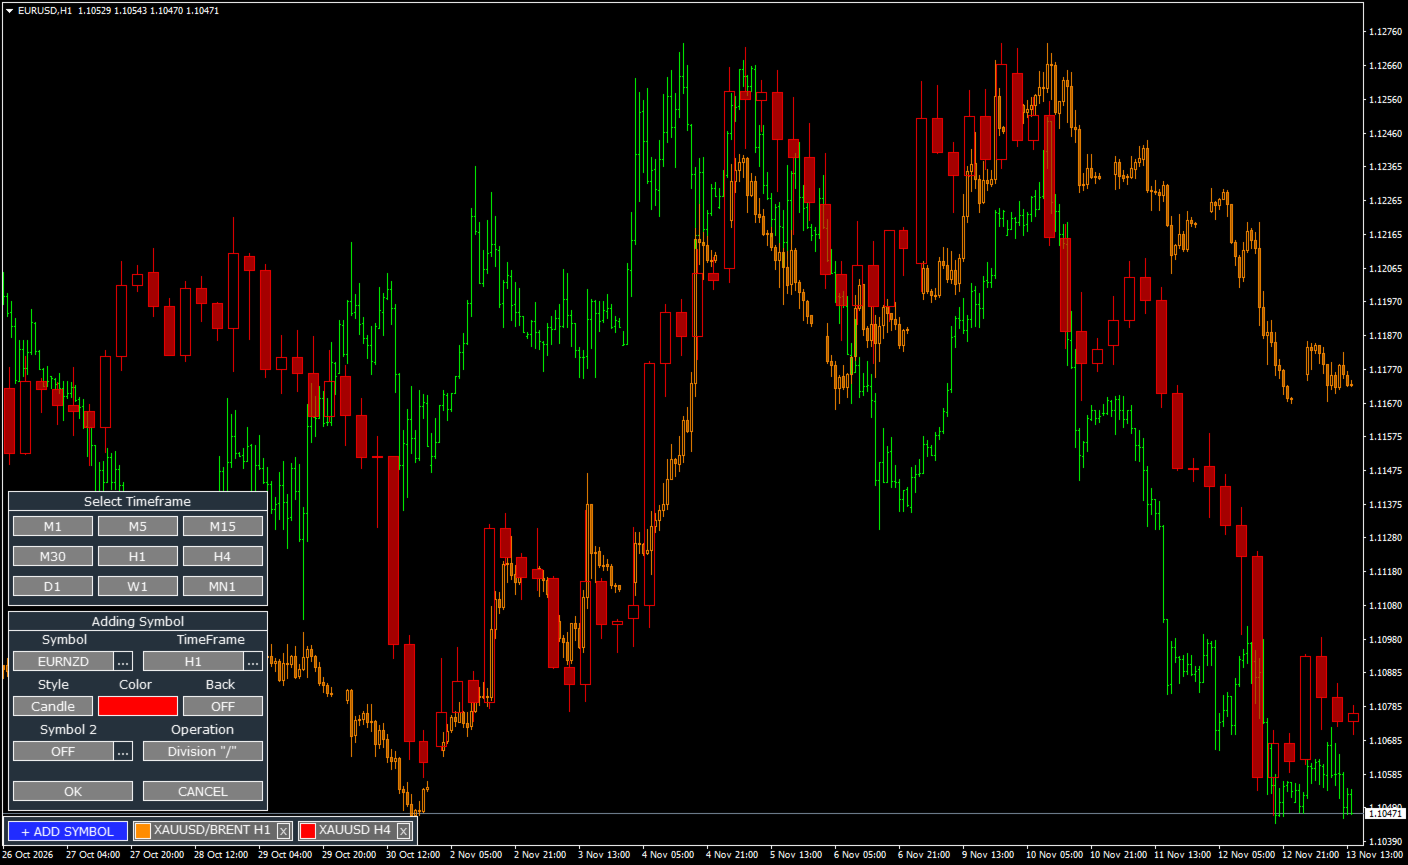
To add a symbol, click "+ ADD SYMBOL." In the window that appears, select the symbol, timeframe, style, color, and background display settings. To create a synthetic chart, add a second symbol and choose an operation—for instance, division. Once you click "OK," the chart will be generated.
Version for MT5 https://www.mql5.com/en/market/product/109155
















































Good